Free Statistics
of Irreproducible Research!
Description of Statistical Computation | |||||||||||||||||||||||||||||||||||||||||||||||||||||||||||||||||||||||||||||||||||||||||||||||||||||||||||||||||||||||||||||||||||||||||||||||||||||||||||||||||||||||||||||||||||||
|---|---|---|---|---|---|---|---|---|---|---|---|---|---|---|---|---|---|---|---|---|---|---|---|---|---|---|---|---|---|---|---|---|---|---|---|---|---|---|---|---|---|---|---|---|---|---|---|---|---|---|---|---|---|---|---|---|---|---|---|---|---|---|---|---|---|---|---|---|---|---|---|---|---|---|---|---|---|---|---|---|---|---|---|---|---|---|---|---|---|---|---|---|---|---|---|---|---|---|---|---|---|---|---|---|---|---|---|---|---|---|---|---|---|---|---|---|---|---|---|---|---|---|---|---|---|---|---|---|---|---|---|---|---|---|---|---|---|---|---|---|---|---|---|---|---|---|---|---|---|---|---|---|---|---|---|---|---|---|---|---|---|---|---|---|---|---|---|---|---|---|---|---|---|---|---|---|---|---|---|---|---|
| Author's title | |||||||||||||||||||||||||||||||||||||||||||||||||||||||||||||||||||||||||||||||||||||||||||||||||||||||||||||||||||||||||||||||||||||||||||||||||||||||||||||||||||||||||||||||||||||
| Author | *The author of this computation has been verified* | ||||||||||||||||||||||||||||||||||||||||||||||||||||||||||||||||||||||||||||||||||||||||||||||||||||||||||||||||||||||||||||||||||||||||||||||||||||||||||||||||||||||||||||||||||||
| R Software Module | rwasp_samplenorm.wasp | ||||||||||||||||||||||||||||||||||||||||||||||||||||||||||||||||||||||||||||||||||||||||||||||||||||||||||||||||||||||||||||||||||||||||||||||||||||||||||||||||||||||||||||||||||||
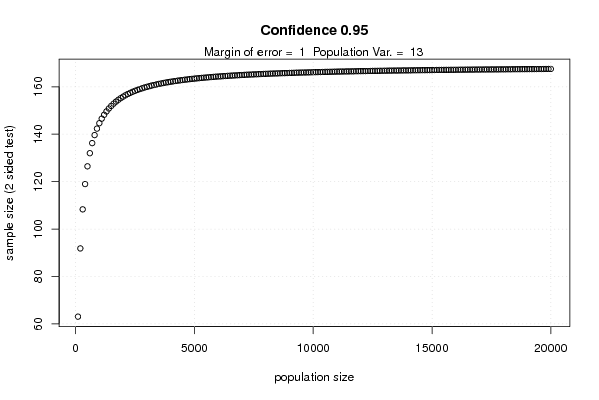
| Title produced by software | Minimum Sample Size - Testing Mean | ||||||||||||||||||||||||||||||||||||||||||||||||||||||||||||||||||||||||||||||||||||||||||||||||||||||||||||||||||||||||||||||||||||||||||||||||||||||||||||||||||||||||||||||||||||
| Date of computation | Mon, 25 Oct 2010 22:09:12 +0000 | ||||||||||||||||||||||||||||||||||||||||||||||||||||||||||||||||||||||||||||||||||||||||||||||||||||||||||||||||||||||||||||||||||||||||||||||||||||||||||||||||||||||||||||||||||||
| Cite this page as follows | Statistical Computations at FreeStatistics.org, Office for Research Development and Education, URL https://freestatistics.org/blog/index.php?v=date/2010/Oct/26/t1288044528d0rcid0goac0tw9.htm/, Retrieved Mon, 03 Aug 2026 03:06:08 +0000 | ||||||||||||||||||||||||||||||||||||||||||||||||||||||||||||||||||||||||||||||||||||||||||||||||||||||||||||||||||||||||||||||||||||||||||||||||||||||||||||||||||||||||||||||||||||
| Statistical Computations at FreeStatistics.org, Office for Research Development and Education, URL https://freestatistics.org/blog/index.php?pk=88641, Retrieved Mon, 03 Aug 2026 03:06:08 +0000 | |||||||||||||||||||||||||||||||||||||||||||||||||||||||||||||||||||||||||||||||||||||||||||||||||||||||||||||||||||||||||||||||||||||||||||||||||||||||||||||||||||||||||||||||||||||
| QR Codes: | |||||||||||||||||||||||||||||||||||||||||||||||||||||||||||||||||||||||||||||||||||||||||||||||||||||||||||||||||||||||||||||||||||||||||||||||||||||||||||||||||||||||||||||||||||||
|
| |||||||||||||||||||||||||||||||||||||||||||||||||||||||||||||||||||||||||||||||||||||||||||||||||||||||||||||||||||||||||||||||||||||||||||||||||||||||||||||||||||||||||||||||||||||
| Original text written by user: | |||||||||||||||||||||||||||||||||||||||||||||||||||||||||||||||||||||||||||||||||||||||||||||||||||||||||||||||||||||||||||||||||||||||||||||||||||||||||||||||||||||||||||||||||||||
| IsPrivate? | This computation is/was private until 2010-10-27 | ||||||||||||||||||||||||||||||||||||||||||||||||||||||||||||||||||||||||||||||||||||||||||||||||||||||||||||||||||||||||||||||||||||||||||||||||||||||||||||||||||||||||||||||||||||
| User-defined keywords | |||||||||||||||||||||||||||||||||||||||||||||||||||||||||||||||||||||||||||||||||||||||||||||||||||||||||||||||||||||||||||||||||||||||||||||||||||||||||||||||||||||||||||||||||||||
| Estimated Impact | 1432 | ||||||||||||||||||||||||||||||||||||||||||||||||||||||||||||||||||||||||||||||||||||||||||||||||||||||||||||||||||||||||||||||||||||||||||||||||||||||||||||||||||||||||||||||||||||
Tree of Dependent Computations | |||||||||||||||||||||||||||||||||||||||||||||||||||||||||||||||||||||||||||||||||||||||||||||||||||||||||||||||||||||||||||||||||||||||||||||||||||||||||||||||||||||||||||||||||||||
| Family? (F = Feedback message, R = changed R code, M = changed R Module, P = changed Parameters, D = changed Data) | |||||||||||||||||||||||||||||||||||||||||||||||||||||||||||||||||||||||||||||||||||||||||||||||||||||||||||||||||||||||||||||||||||||||||||||||||||||||||||||||||||||||||||||||||||||
| - [Minimum Sample Size - Testing Mean] [] [2010-10-25 22:09:12] [d76b387543b13b5e3afd8ff9e5fdc89f] [Current] - P [Minimum Sample Size - Testing Mean] [workshop 4 Q 11] [2010-10-28 11:52:44] [87d60b8864dc39f7ed759c345edfb471] - [Minimum Sample Size - Testing Mean] [W4-verbetering11] [2010-11-02 09:01:14] [48146708a479232c43a8f6e52fbf83b4] - P [Minimum Sample Size - Testing Mean] [Q 11] [2010-10-28 18:53:04] [97ad38b1c3b35a5feca8b85f7bc7b3ff] - P [Minimum Sample Size - Testing Mean] [Workshop 4 questi...] [2010-11-18 13:54:23] [1ec36cc0fd92fd0f07d0b885ce2c369b] - P [Minimum Sample Size - Testing Mean] [] [2010-11-18 16:17:47] [f47feae0308dca73181bb669fbad1c56] - P [Minimum Sample Size - Testing Mean] [] [2010-11-18 18:42:49] [adca540665f1dd1a5a4406fd7f55bdf4] - P [Minimum Sample Size - Testing Mean] [Vraag 11] [2010-11-18 19:01:34] [4f1a20f787b3465111b61213cdeef1a9] - R P [Minimum Sample Size - Testing Mean] [ws4TimDamen] [2011-01-24 13:07:42] [74be16979710d4c4e7c6647856088456] - R [Minimum Sample Size - Testing Mean] [] [2011-10-20 16:11:57] [b4c8fd31b0af00c33711722ddf8d2c4c] - P [Minimum Sample Size - Testing Mean] [WS 4 Question 11] [2012-10-23 18:44:36] [04ad92fd38637a2baad7dd3848f865a0] - R P [Minimum Sample Size - Testing Mean] [WS 4 - vraag 11] [2011-10-22 09:28:19] [6a3e51c0c7ab195427042dfaef1df5a0] - RMP [Minimum Sample Size - Testing Mean] [Week 4 Opdracht 11] [2011-10-23 15:56:38] [d2d464c5b110c95dc0c66eb9ae81f8ec] - R P [Minimum Sample Size - Testing Mean] [question 11] [2011-10-24 19:18:35] [bcad5ea7a7be31884500e96b7abaff18] - R P [Minimum Sample Size - Testing Mean] [WS4.11] [2011-10-25 15:46:31] [9b13650c94c5192ca5135ec8a1fa39f7] - R P [Minimum Sample Size - Testing Mean] [Taak 11] [2011-10-25 19:12:11] [088a244c534fec2347300624359db3c1] - RMP [Minimum Sample Size - Testing Mean] [verbetering works...] [2011-10-30 18:37:18] [fbaf17a8836493f6de0f4e0e997711e1] - RMPD [Paired and Unpaired Two Samples Tests about the Mean] [WS 5 - Q1] [2011-10-31 14:04:48] [586787d3e7267c593af3e1f6b16aa21a] - R D [Paired and Unpaired Two Samples Tests about the Mean] [] [2011-11-07 19:03:19] [74be16979710d4c4e7c6647856088456] - R D [Paired and Unpaired Two Samples Tests about the Mean] [] [2011-11-07 19:21:09] [74be16979710d4c4e7c6647856088456] - D [Paired and Unpaired Two Samples Tests about the Mean] [] [2011-11-07 19:24:22] [74be16979710d4c4e7c6647856088456] - D [Paired and Unpaired Two Samples Tests about the Mean] [] [2011-11-07 19:28:14] [74be16979710d4c4e7c6647856088456] - R P [Paired and Unpaired Two Samples Tests about the Mean] [Treatment S] [2011-11-07 21:57:27] [586787d3e7267c593af3e1f6b16aa21a] - R P [Paired and Unpaired Two Samples Tests about the Mean] [Treatment S] [2011-11-07 22:09:31] [586787d3e7267c593af3e1f6b16aa21a] - R P [Paired and Unpaired Two Samples Tests about the Mean] [treatment E] [2011-11-07 21:54:22] [586787d3e7267c593af3e1f6b16aa21a] - R P [Paired and Unpaired Two Samples Tests about the Mean] [Treatment E] [2011-11-07 22:06:09] [586787d3e7267c593af3e1f6b16aa21a] - M [Paired and Unpaired Two Samples Tests about the Mean] [] [2011-11-15 23:27:52] [46d7ccc24e5d35a2decd922dfb3b3a39] - R [Paired and Unpaired Two Samples Tests about the Mean] [WS 5 - Q5] [2011-11-07 21:48:59] [586787d3e7267c593af3e1f6b16aa21a] - M [Paired and Unpaired Two Samples Tests about the Mean] [] [2011-11-15 23:27:13] [46d7ccc24e5d35a2decd922dfb3b3a39] - R [Paired and Unpaired Two Samples Tests about the Mean] [] [2011-11-07 20:13:37] [74be16979710d4c4e7c6647856088456] - M [Paired and Unpaired Two Samples Tests about the Mean] [] [2011-11-15 23:26:16] [46d7ccc24e5d35a2decd922dfb3b3a39] - R [Paired and Unpaired Two Samples Tests about the Mean] [] [2011-11-07 20:14:33] [74be16979710d4c4e7c6647856088456] - RMPD [Paired and Unpaired Two Samples Tests about the Mean] [WS 5 - Q2] [2011-10-31 14:09:40] [586787d3e7267c593af3e1f6b16aa21a] - R [Paired and Unpaired Two Samples Tests about the Mean] [] [2011-11-07 20:15:26] [74be16979710d4c4e7c6647856088456] - M [Paired and Unpaired Two Samples Tests about the Mean] [] [2011-11-15 23:26:37] [46d7ccc24e5d35a2decd922dfb3b3a39] - R [Paired and Unpaired Two Samples Tests about the Mean] [] [2011-11-07 20:16:42] [74be16979710d4c4e7c6647856088456] - RMPD [Paired and Unpaired Two Samples Tests about the Mean] [WS 5 - Q3] [2011-10-31 14:10:42] [586787d3e7267c593af3e1f6b16aa21a] - R [Paired and Unpaired Two Samples Tests about the Mean] [] [2011-11-07 20:18:50] [74be16979710d4c4e7c6647856088456] - M [Paired and Unpaired Two Samples Tests about the Mean] [] [2011-11-15 23:26:56] [46d7ccc24e5d35a2decd922dfb3b3a39] - RMP [Minimum Sample Size - Testing Mean] [xcvxcvxcvx] [2011-11-04 19:35:05] [a9671b130b33f9fcb98554992ce4582f] - R P [Minimum Sample Size - Testing Mean] [ws4: vraag 11 .] [2011-11-06 17:36:21] [8ce6c7315af51b5eb6923c5fe455d382] - R P [Minimum Sample Size - Testing Mean] [] [2012-10-05 17:58:44] [8fcd082199f7dbedf65d69a953eb5ad7] - R P [Minimum Sample Size - Testing Mean] [j] [2012-10-08 15:01:03] [b6dc7003e7767578f97246d87c77862e] - R P [Minimum Sample Size - Testing Mean] [ss] [2012-12-05 15:39:53] [b6dc7003e7767578f97246d87c77862e] - RMP [Minimum Sample Size - Testing Mean] [] [2012-10-08 15:23:38] [3f0a8a13d98297c9ceadbbb730620b41] - RMP [Testing Mean with known Variance - p-value] [] [2012-10-08 15:27:35] [3f0a8a13d98297c9ceadbbb730620b41] - RMP [Testing Mean with known Variance - Critical Value] [] [2012-10-08 15:27:55] [3f0a8a13d98297c9ceadbbb730620b41] - RMPD [Paired and Unpaired Two Samples Tests about the Mean] [] [2012-10-08 15:28:17] [3f0a8a13d98297c9ceadbbb730620b41] - R P [Minimum Sample Size - Testing Mean] [] [2012-10-08 15:28:41] [3f0a8a13d98297c9ceadbbb730620b41] [Truncated] | |||||||||||||||||||||||||||||||||||||||||||||||||||||||||||||||||||||||||||||||||||||||||||||||||||||||||||||||||||||||||||||||||||||||||||||||||||||||||||||||||||||||||||||||||||||
| Feedback Forum | |||||||||||||||||||||||||||||||||||||||||||||||||||||||||||||||||||||||||||||||||||||||||||||||||||||||||||||||||||||||||||||||||||||||||||||||||||||||||||||||||||||||||||||||||||||
Post a new message | |||||||||||||||||||||||||||||||||||||||||||||||||||||||||||||||||||||||||||||||||||||||||||||||||||||||||||||||||||||||||||||||||||||||||||||||||||||||||||||||||||||||||||||||||||||
Dataset | |||||||||||||||||||||||||||||||||||||||||||||||||||||||||||||||||||||||||||||||||||||||||||||||||||||||||||||||||||||||||||||||||||||||||||||||||||||||||||||||||||||||||||||||||||||
Tables (Output of Computation) | |||||||||||||||||||||||||||||||||||||||||||||||||||||||||||||||||||||||||||||||||||||||||||||||||||||||||||||||||||||||||||||||||||||||||||||||||||||||||||||||||||||||||||||||||||||
| |||||||||||||||||||||||||||||||||||||||||||||||||||||||||||||||||||||||||||||||||||||||||||||||||||||||||||||||||||||||||||||||||||||||||||||||||||||||||||||||||||||||||||||||||||||
Figures (Output of Computation) | |||||||||||||||||||||||||||||||||||||||||||||||||||||||||||||||||||||||||||||||||||||||||||||||||||||||||||||||||||||||||||||||||||||||||||||||||||||||||||||||||||||||||||||||||||||
Input Parameters & R Code | |||||||||||||||||||||||||||||||||||||||||||||||||||||||||||||||||||||||||||||||||||||||||||||||||||||||||||||||||||||||||||||||||||||||||||||||||||||||||||||||||||||||||||||||||||||
| Parameters (Session): | |||||||||||||||||||||||||||||||||||||||||||||||||||||||||||||||||||||||||||||||||||||||||||||||||||||||||||||||||||||||||||||||||||||||||||||||||||||||||||||||||||||||||||||||||||||
| par1 = 63 ; par2 = 14 ; par3 = 13 ; par4 = 0.35 ; | |||||||||||||||||||||||||||||||||||||||||||||||||||||||||||||||||||||||||||||||||||||||||||||||||||||||||||||||||||||||||||||||||||||||||||||||||||||||||||||||||||||||||||||||||||||
| Parameters (R input): | |||||||||||||||||||||||||||||||||||||||||||||||||||||||||||||||||||||||||||||||||||||||||||||||||||||||||||||||||||||||||||||||||||||||||||||||||||||||||||||||||||||||||||||||||||||
| par1 = 105 ; par2 = 1 ; par3 = 0.95 ; par4 = 13 ; par5 = 0.95 ; | |||||||||||||||||||||||||||||||||||||||||||||||||||||||||||||||||||||||||||||||||||||||||||||||||||||||||||||||||||||||||||||||||||||||||||||||||||||||||||||||||||||||||||||||||||||
| R code (references can be found in the software module): | |||||||||||||||||||||||||||||||||||||||||||||||||||||||||||||||||||||||||||||||||||||||||||||||||||||||||||||||||||||||||||||||||||||||||||||||||||||||||||||||||||||||||||||||||||||
par1 <- as.numeric(par1) | |||||||||||||||||||||||||||||||||||||||||||||||||||||||||||||||||||||||||||||||||||||||||||||||||||||||||||||||||||||||||||||||||||||||||||||||||||||||||||||||||||||||||||||||||||||