Free Statistics
of Irreproducible Research!
Description of Statistical Computation | |||||||||||||||||||||||||||||||||||||||||||||||||||||||||||||||||||||||||||||||||||||||||||||||||||||||||||||||||||||||||||||||||||||||||||||||||||||||||||||||||||||||||
|---|---|---|---|---|---|---|---|---|---|---|---|---|---|---|---|---|---|---|---|---|---|---|---|---|---|---|---|---|---|---|---|---|---|---|---|---|---|---|---|---|---|---|---|---|---|---|---|---|---|---|---|---|---|---|---|---|---|---|---|---|---|---|---|---|---|---|---|---|---|---|---|---|---|---|---|---|---|---|---|---|---|---|---|---|---|---|---|---|---|---|---|---|---|---|---|---|---|---|---|---|---|---|---|---|---|---|---|---|---|---|---|---|---|---|---|---|---|---|---|---|---|---|---|---|---|---|---|---|---|---|---|---|---|---|---|---|---|---|---|---|---|---|---|---|---|---|---|---|---|---|---|---|---|---|---|---|---|---|---|---|---|---|---|---|---|---|---|---|---|
| Author's title | |||||||||||||||||||||||||||||||||||||||||||||||||||||||||||||||||||||||||||||||||||||||||||||||||||||||||||||||||||||||||||||||||||||||||||||||||||||||||||||||||||||||||
| Author | *The author of this computation has been verified* | ||||||||||||||||||||||||||||||||||||||||||||||||||||||||||||||||||||||||||||||||||||||||||||||||||||||||||||||||||||||||||||||||||||||||||||||||||||||||||||||||||||||||
| R Software Module | rwasp_twosampletests_mean.wasp | ||||||||||||||||||||||||||||||||||||||||||||||||||||||||||||||||||||||||||||||||||||||||||||||||||||||||||||||||||||||||||||||||||||||||||||||||||||||||||||||||||||||||
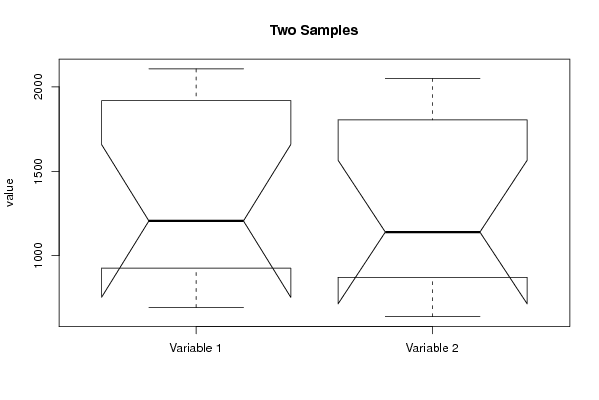
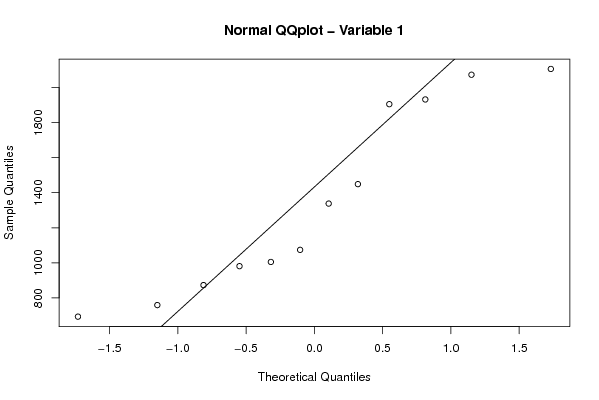
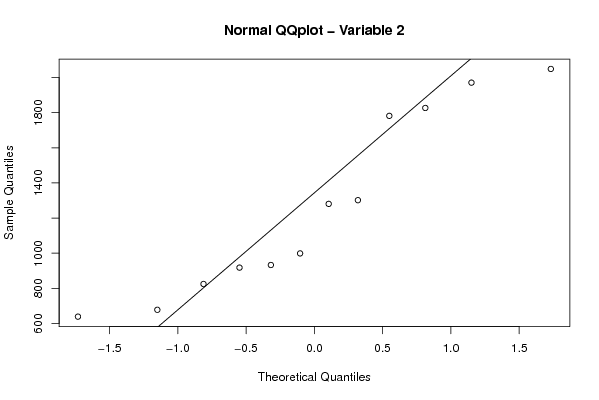
| Title produced by software | Paired and Unpaired Two Samples Tests about the Mean | ||||||||||||||||||||||||||||||||||||||||||||||||||||||||||||||||||||||||||||||||||||||||||||||||||||||||||||||||||||||||||||||||||||||||||||||||||||||||||||||||||||||||
| Date of computation | Mon, 25 Oct 2010 11:22:12 +0000 | ||||||||||||||||||||||||||||||||||||||||||||||||||||||||||||||||||||||||||||||||||||||||||||||||||||||||||||||||||||||||||||||||||||||||||||||||||||||||||||||||||||||||
| Cite this page as follows | Statistical Computations at FreeStatistics.org, Office for Research Development and Education, URL https://freestatistics.org/blog/index.php?v=date/2010/Oct/25/t12880057575svsq8l9hwncm1b.htm/, Retrieved Sat, 23 May 2026 22:50:21 +0000 | ||||||||||||||||||||||||||||||||||||||||||||||||||||||||||||||||||||||||||||||||||||||||||||||||||||||||||||||||||||||||||||||||||||||||||||||||||||||||||||||||||||||||
| Statistical Computations at FreeStatistics.org, Office for Research Development and Education, URL https://freestatistics.org/blog/index.php?pk=88044, Retrieved Sat, 23 May 2026 22:50:21 +0000 | |||||||||||||||||||||||||||||||||||||||||||||||||||||||||||||||||||||||||||||||||||||||||||||||||||||||||||||||||||||||||||||||||||||||||||||||||||||||||||||||||||||||||
| QR Codes: | |||||||||||||||||||||||||||||||||||||||||||||||||||||||||||||||||||||||||||||||||||||||||||||||||||||||||||||||||||||||||||||||||||||||||||||||||||||||||||||||||||||||||
|
| |||||||||||||||||||||||||||||||||||||||||||||||||||||||||||||||||||||||||||||||||||||||||||||||||||||||||||||||||||||||||||||||||||||||||||||||||||||||||||||||||||||||||
| Original text written by user: | zie p. 277-278 | ||||||||||||||||||||||||||||||||||||||||||||||||||||||||||||||||||||||||||||||||||||||||||||||||||||||||||||||||||||||||||||||||||||||||||||||||||||||||||||||||||||||||
| IsPrivate? | No (this computation is public) | ||||||||||||||||||||||||||||||||||||||||||||||||||||||||||||||||||||||||||||||||||||||||||||||||||||||||||||||||||||||||||||||||||||||||||||||||||||||||||||||||||||||||
| User-defined keywords | |||||||||||||||||||||||||||||||||||||||||||||||||||||||||||||||||||||||||||||||||||||||||||||||||||||||||||||||||||||||||||||||||||||||||||||||||||||||||||||||||||||||||
| Estimated Impact | 917 | ||||||||||||||||||||||||||||||||||||||||||||||||||||||||||||||||||||||||||||||||||||||||||||||||||||||||||||||||||||||||||||||||||||||||||||||||||||||||||||||||||||||||
Tree of Dependent Computations | |||||||||||||||||||||||||||||||||||||||||||||||||||||||||||||||||||||||||||||||||||||||||||||||||||||||||||||||||||||||||||||||||||||||||||||||||||||||||||||||||||||||||
| Family? (F = Feedback message, R = changed R code, M = changed R Module, P = changed Parameters, D = changed Data) | |||||||||||||||||||||||||||||||||||||||||||||||||||||||||||||||||||||||||||||||||||||||||||||||||||||||||||||||||||||||||||||||||||||||||||||||||||||||||||||||||||||||||
| - [Paired and Unpaired Two Samples Tests about the Mean] [Dagelijkse omzet ...] [2010-10-25 11:22:12] [d76b387543b13b5e3afd8ff9e5fdc89f] [Current] F PD [Paired and Unpaired Two Samples Tests about the Mean] [WS5 Q1] [2010-10-28 18:44:27] [afe9379cca749d06b3d6872e02cc47ed] - PD [Paired and Unpaired Two Samples Tests about the Mean] [Experiment 1 - Q2] [2010-10-30 09:24:14] [033eb2749a430605d9b2be7c4aac4a0c] - R [Paired and Unpaired Two Samples Tests about the Mean] [] [2010-11-07 14:47:29] [d7b28a0391ab3b2ddc9f9fba95a43f33] - R P [Paired and Unpaired Two Samples Tests about the Mean] [WS5 - Q1 - Treatm...] [2010-10-31 09:49:50] [8ef49741e164ec6343c90c7935194465] - [Paired and Unpaired Two Samples Tests about the Mean] [WS5 - Q1] [2010-11-02 12:55:48] [18fa53e8b37a5effc0c5f8a5122cdd2d] - R [Paired and Unpaired Two Samples Tests about the Mean] [Workshop 5; Quest...] [2010-11-02 12:55:29] [8ffb4cfa64b4677df0d2c448735a40bb] - D [Paired and Unpaired Two Samples Tests about the Mean] [Workshop 5; Quest...] [2010-11-02 13:45:10] [8ffb4cfa64b4677df0d2c448735a40bb] - D [Paired and Unpaired Two Samples Tests about the Mean] [Workshop 5; Quest...] [2010-11-02 13:45:10] [8ffb4cfa64b4677df0d2c448735a40bb] - D [Paired and Unpaired Two Samples Tests about the Mean] [Workshop 5; Quest...] [2010-11-02 13:49:58] [8ffb4cfa64b4677df0d2c448735a40bb] - D [Paired and Unpaired Two Samples Tests about the Mean] [Workshop 5; Quest...] [2010-11-02 13:53:26] [8ffb4cfa64b4677df0d2c448735a40bb] - RM D [One-Way-Between-Groups ANOVA- Free Statistics Software (Calculator)] [Workshop 5; Quest...] [2010-11-02 14:13:00] [8ffb4cfa64b4677df0d2c448735a40bb] - RM D [One-Way-Between-Groups ANOVA- Free Statistics Software (Calculator)] [Workshop 5; Quest...] [2010-11-02 14:29:30] [8ffb4cfa64b4677df0d2c448735a40bb] - R [Paired and Unpaired Two Samples Tests about the Mean] [WS5 - Task 1] [2010-11-02 12:57:22] [1f5baf2b24e732d76900bb8178fc04e7] - D [Paired and Unpaired Two Samples Tests about the Mean] [WS 5 - Q2] [2010-11-02 13:05:14] [18fa53e8b37a5effc0c5f8a5122cdd2d] - R D [Paired and Unpaired Two Samples Tests about the Mean] [Workshop 5; Quest...] [2010-11-02 13:06:43] [8ffb4cfa64b4677df0d2c448735a40bb] - D [Paired and Unpaired Two Samples Tests about the Mean] [WS 5 - Q3] [2010-11-02 13:08:54] [18fa53e8b37a5effc0c5f8a5122cdd2d] - R D [Paired and Unpaired Two Samples Tests about the Mean] [WS5 - Task 2] [2010-11-02 13:08:56] [1f5baf2b24e732d76900bb8178fc04e7] - R D [Paired and Unpaired Two Samples Tests about the Mean] [Workshop 5; Quest...] [2010-11-02 13:09:56] [8ffb4cfa64b4677df0d2c448735a40bb] - D [Paired and Unpaired Two Samples Tests about the Mean] [WS 5 - Q3] [2010-11-02 13:13:32] [18fa53e8b37a5effc0c5f8a5122cdd2d] - R D [Paired and Unpaired Two Samples Tests about the Mean] [WS5 - Task 3] [2010-11-02 13:13:48] [1f5baf2b24e732d76900bb8178fc04e7] - D [Paired and Unpaired Two Samples Tests about the Mean] [WS 5 - Q5_1] [2010-11-02 13:40:49] [18fa53e8b37a5effc0c5f8a5122cdd2d] - R D [Paired and Unpaired Two Samples Tests about the Mean] [WS5 - Task 5 Trea...] [2010-11-02 13:41:42] [1f5baf2b24e732d76900bb8178fc04e7] - D [Paired and Unpaired Two Samples Tests about the Mean] [WS 5 - Q5_2] [2010-11-02 13:43:09] [18fa53e8b37a5effc0c5f8a5122cdd2d] - R D [Paired and Unpaired Two Samples Tests about the Mean] [WS5 - Task 5 Trea...] [2010-11-02 13:44:27] [1f5baf2b24e732d76900bb8178fc04e7] - D [Paired and Unpaired Two Samples Tests about the Mean] [WS 5 - Q5_3] [2010-11-02 13:44:49] [18fa53e8b37a5effc0c5f8a5122cdd2d] - R D [Paired and Unpaired Two Samples Tests about the Mean] [WS5 - Task 5 Trea...] [2010-11-02 13:45:53] [1f5baf2b24e732d76900bb8178fc04e7] - RMPD [One-Way-Between-Groups ANOVA- Free Statistics Software (Calculator)] [WS5 - Task 6 Post 1] [2010-11-02 14:12:11] [1f5baf2b24e732d76900bb8178fc04e7] - RMPD [One-Way-Between-Groups ANOVA- Free Statistics Software (Calculator)] [WS 5 - Q7] [2010-11-02 14:12:58] [18fa53e8b37a5effc0c5f8a5122cdd2d] - [One-Way-Between-Groups ANOVA- Free Statistics Software (Calculator)] [WS 5 - Q6] [2010-11-02 14:16:10] [18fa53e8b37a5effc0c5f8a5122cdd2d] - P [One-Way-Between-Groups ANOVA- Free Statistics Software (Calculator)] [WS 5 - Q6] [2010-11-02 14:28:42] [18fa53e8b37a5effc0c5f8a5122cdd2d] - PD [One-Way-Between-Groups ANOVA- Free Statistics Software (Calculator)] [WS 5 - Q7_1] [2010-11-02 14:59:39] [18fa53e8b37a5effc0c5f8a5122cdd2d] - PD [One-Way-Between-Groups ANOVA- Free Statistics Software (Calculator)] [Q 7_2] [2010-11-02 16:35:44] [74be16979710d4c4e7c6647856088456] - RMPD [Two-Way ANOVA] [Q8] [2010-11-02 17:10:35] [74be16979710d4c4e7c6647856088456] - PD [One-Way-Between-Groups ANOVA- Free Statistics Software (Calculator)] [WS 5 - Q7_2] [2010-11-02 15:01:55] [18fa53e8b37a5effc0c5f8a5122cdd2d] - RMPD [One-Way-Between-Groups ANOVA- Free Statistics Software (Calculator)] [WS5 - Task 6 Post 3] [2010-11-02 14:13:57] [1f5baf2b24e732d76900bb8178fc04e7] - RMPD [One-Way-Between-Groups ANOVA- Free Statistics Software (Calculator)] [WS5 - Task 6 Post...] [2010-11-02 14:30:04] [1f5baf2b24e732d76900bb8178fc04e7] - RMPD [One-Way-Between-Groups ANOVA- Free Statistics Software (Calculator)] [WS5 - Task 6 Post...] [2010-11-02 14:32:27] [1f5baf2b24e732d76900bb8178fc04e7] - [Paired and Unpaired Two Samples Tests about the Mean] [WS 5 vraag 1] [2010-11-02 23:35:25] [74be16979710d4c4e7c6647856088456] - R PD [Paired and Unpaired Two Samples Tests about the Mean] [WS5 - Q2 - Treatm...] [2010-10-31 09:51:52] [8ef49741e164ec6343c90c7935194465] - [Paired and Unpaired Two Samples Tests about the Mean] [WS 5 Vraag 2] [2010-11-02 23:44:43] [74be16979710d4c4e7c6647856088456] - R PD [Paired and Unpaired Two Samples Tests about the Mean] [WS5 - Q3 - Treatm...] [2010-10-31 09:54:33] [8ef49741e164ec6343c90c7935194465] - D [Paired and Unpaired Two Samples Tests about the Mean] [WS5 - Q5 - Treatm...] [2010-10-31 18:35:40] [8ef49741e164ec6343c90c7935194465] - [Paired and Unpaired Two Samples Tests about the Mean] [ws 5 vraag 5 (T) ...] [2010-11-02 22:05:42] [8214fe6d084e5ad7598b249a26cc9f06] - R [Paired and Unpaired Two Samples Tests about the Mean] [WS 5 Vraag 4] [2010-11-03 00:00:55] [74be16979710d4c4e7c6647856088456] - D [Paired and Unpaired Two Samples Tests about the Mean] [WS5 - Q5 - Treatm...] [2010-10-31 18:39:35] [8ef49741e164ec6343c90c7935194465] - [Paired and Unpaired Two Samples Tests about the Mean] [ws 5 vraag 5 - Ch...] [2010-11-02 22:02:40] [8214fe6d084e5ad7598b249a26cc9f06] - R [Paired and Unpaired Two Samples Tests about the Mean] [WS 5 Vraag 5] [2010-11-03 00:06:43] [74be16979710d4c4e7c6647856088456] - D [Paired and Unpaired Two Samples Tests about the Mean] [WS5 - Q5 - Treatm...] [2010-10-31 18:41:37] [8ef49741e164ec6343c90c7935194465] [Truncated] | |||||||||||||||||||||||||||||||||||||||||||||||||||||||||||||||||||||||||||||||||||||||||||||||||||||||||||||||||||||||||||||||||||||||||||||||||||||||||||||||||||||||||
| Feedback Forum | |||||||||||||||||||||||||||||||||||||||||||||||||||||||||||||||||||||||||||||||||||||||||||||||||||||||||||||||||||||||||||||||||||||||||||||||||||||||||||||||||||||||||
Post a new message | |||||||||||||||||||||||||||||||||||||||||||||||||||||||||||||||||||||||||||||||||||||||||||||||||||||||||||||||||||||||||||||||||||||||||||||||||||||||||||||||||||||||||
Dataset | |||||||||||||||||||||||||||||||||||||||||||||||||||||||||||||||||||||||||||||||||||||||||||||||||||||||||||||||||||||||||||||||||||||||||||||||||||||||||||||||||||||||||
| Dataseries X: | |||||||||||||||||||||||||||||||||||||||||||||||||||||||||||||||||||||||||||||||||||||||||||||||||||||||||||||||||||||||||||||||||||||||||||||||||||||||||||||||||||||||||
1005 918 2073 1971 873 825 1074 999 1932 1827 1338 1281 1449 1302 759 678 1905 1782 693 639 2106 2049 981 933 | |||||||||||||||||||||||||||||||||||||||||||||||||||||||||||||||||||||||||||||||||||||||||||||||||||||||||||||||||||||||||||||||||||||||||||||||||||||||||||||||||||||||||
Tables (Output of Computation) | |||||||||||||||||||||||||||||||||||||||||||||||||||||||||||||||||||||||||||||||||||||||||||||||||||||||||||||||||||||||||||||||||||||||||||||||||||||||||||||||||||||||||
| |||||||||||||||||||||||||||||||||||||||||||||||||||||||||||||||||||||||||||||||||||||||||||||||||||||||||||||||||||||||||||||||||||||||||||||||||||||||||||||||||||||||||
Figures (Output of Computation) | |||||||||||||||||||||||||||||||||||||||||||||||||||||||||||||||||||||||||||||||||||||||||||||||||||||||||||||||||||||||||||||||||||||||||||||||||||||||||||||||||||||||||
Input Parameters & R Code | |||||||||||||||||||||||||||||||||||||||||||||||||||||||||||||||||||||||||||||||||||||||||||||||||||||||||||||||||||||||||||||||||||||||||||||||||||||||||||||||||||||||||
| Parameters (Session): | |||||||||||||||||||||||||||||||||||||||||||||||||||||||||||||||||||||||||||||||||||||||||||||||||||||||||||||||||||||||||||||||||||||||||||||||||||||||||||||||||||||||||
| par1 = 1 ; par2 = 2 ; par3 = 0.95 ; par4 = two.sided ; par5 = paired ; par6 = -0.5 ; | |||||||||||||||||||||||||||||||||||||||||||||||||||||||||||||||||||||||||||||||||||||||||||||||||||||||||||||||||||||||||||||||||||||||||||||||||||||||||||||||||||||||||
| Parameters (R input): | |||||||||||||||||||||||||||||||||||||||||||||||||||||||||||||||||||||||||||||||||||||||||||||||||||||||||||||||||||||||||||||||||||||||||||||||||||||||||||||||||||||||||
| par1 = 1 ; par2 = 2 ; par3 = 0.95 ; par4 = two.sided ; par5 = paired ; par6 = 0.0 ; | |||||||||||||||||||||||||||||||||||||||||||||||||||||||||||||||||||||||||||||||||||||||||||||||||||||||||||||||||||||||||||||||||||||||||||||||||||||||||||||||||||||||||
| R code (references can be found in the software module): | |||||||||||||||||||||||||||||||||||||||||||||||||||||||||||||||||||||||||||||||||||||||||||||||||||||||||||||||||||||||||||||||||||||||||||||||||||||||||||||||||||||||||
par1 <- as.numeric(par1) #column number of first sample | |||||||||||||||||||||||||||||||||||||||||||||||||||||||||||||||||||||||||||||||||||||||||||||||||||||||||||||||||||||||||||||||||||||||||||||||||||||||||||||||||||||||||