\begin{tabular}{lllllllll}
\hline
Summary of computational transaction \tabularnewline
Raw Input & view raw input (R code)  \tabularnewline
Raw Output & view raw output of R engine  \tabularnewline
Computing time & 1 seconds \tabularnewline
R Server & 'Gwilym Jenkins' @ 72.249.127.135 \tabularnewline
\hline
\end{tabular}
%Source: https://freestatistics.org/blog/index.php?pk=79887&T=0
[TABLE]
[ROW][C]Summary of computational transaction[/C][/ROW]
[ROW][C]Raw Input[/C][C]view raw input (R code) [/C][/ROW]
[ROW][C]Raw Output[/C][C]view raw output of R engine [/C][/ROW]
[ROW][C]Computing time[/C][C]1 seconds[/C][/ROW]
[ROW][C]R Server[/C][C]'Gwilym Jenkins' @ 72.249.127.135[/C][/ROW]
[/TABLE]
Source: https://freestatistics.org/blog/index.php?pk=79887&T=0
If you paste this QR Code into your document, anyone with a smartphone or tablet will be able to scan it and view this table in a browser.
If you paste this QR Code into your document, anyone with a smartphone or tablet will be able to scan it and view this table in a browser.
If you paste this QR Code into your document, anyone with a smartphone or tablet will be able to scan it and view this table in a browser.
If you paste this QR Code into your document, anyone with a smartphone or tablet will be able to scan it and view this table in a browser.
If you paste this QR Code into your document, anyone with a smartphone or tablet will be able to scan it and view this table in a browser.
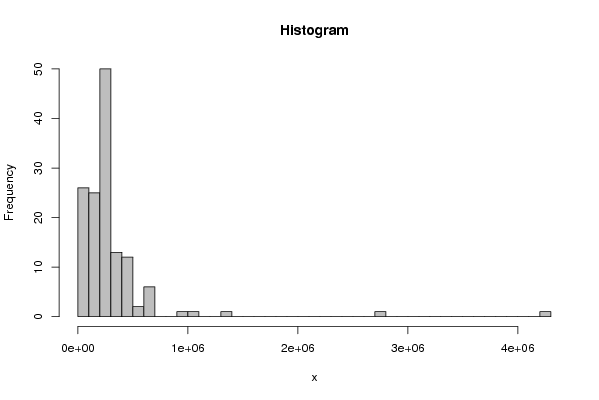
| Frequency Table (Histogram) | | Bins | Midpoint | Abs. Frequency | Rel. Frequency | Cumul. Rel. Freq. | Density | | [0,1e+05[ | 50000 | 26 | 0.18705 | 0.18705 | 2e-06 | | [1e+05,2e+05[ | 150000 | 25 | 0.179856 | 0.366906 | 2e-06 | | [2e+05,3e+05[ | 250000 | 50 | 0.359712 | 0.726619 | 4e-06 | | [3e+05,4e+05[ | 350000 | 13 | 0.093525 | 0.820144 | 1e-06 | | [4e+05,5e+05[ | 450000 | 12 | 0.086331 | 0.906475 | 1e-06 | | [5e+05,6e+05[ | 550000 | 2 | 0.014388 | 0.920863 | 0 | | [6e+05,7e+05[ | 650000 | 6 | 0.043165 | 0.964029 | 0 | | [7e+05,8e+05[ | 750000 | 0 | 0 | 0.964029 | 0 | | [8e+05,9e+05[ | 850000 | 0 | 0 | 0.964029 | 0 | | [9e+05,1e+06[ | 950000 | 1 | 0.007194 | 0.971223 | 0 | | [1e+06,1100000[ | 1050000 | 1 | 0.007194 | 0.978417 | 0 | | [1100000,1200000[ | 1150000 | 0 | 0 | 0.978417 | 0 | | [1200000,1300000[ | 1250000 | 0 | 0 | 0.978417 | 0 | | [1300000,1400000[ | 1350000 | 1 | 0.007194 | 0.985612 | 0 | | [1400000,1500000[ | 1450000 | 0 | 0 | 0.985612 | 0 | | [1500000,1600000[ | 1550000 | 0 | 0 | 0.985612 | 0 | | [1600000,1700000[ | 1650000 | 0 | 0 | 0.985612 | 0 | | [1700000,1800000[ | 1750000 | 0 | 0 | 0.985612 | 0 | | [1800000,1900000[ | 1850000 | 0 | 0 | 0.985612 | 0 | | [1900000,2e+06[ | 1950000 | 0 | 0 | 0.985612 | 0 | | [2e+06,2100000[ | 2050000 | 0 | 0 | 0.985612 | 0 | | [2100000,2200000[ | 2150000 | 0 | 0 | 0.985612 | 0 | | [2200000,2300000[ | 2250000 | 0 | 0 | 0.985612 | 0 | | [2300000,2400000[ | 2350000 | 0 | 0 | 0.985612 | 0 | | [2400000,2500000[ | 2450000 | 0 | 0 | 0.985612 | 0 | | [2500000,2600000[ | 2550000 | 0 | 0 | 0.985612 | 0 | | [2600000,2700000[ | 2650000 | 0 | 0 | 0.985612 | 0 | | [2700000,2800000[ | 2750000 | 1 | 0.007194 | 0.992806 | 0 | | [2800000,2900000[ | 2850000 | 0 | 0 | 0.992806 | 0 | | [2900000,3e+06[ | 2950000 | 0 | 0 | 0.992806 | 0 | | [3e+06,3100000[ | 3050000 | 0 | 0 | 0.992806 | 0 | | [3100000,3200000[ | 3150000 | 0 | 0 | 0.992806 | 0 | | [3200000,3300000[ | 3250000 | 0 | 0 | 0.992806 | 0 | | [3300000,3400000[ | 3350000 | 0 | 0 | 0.992806 | 0 | | [3400000,3500000[ | 3450000 | 0 | 0 | 0.992806 | 0 | | [3500000,3600000[ | 3550000 | 0 | 0 | 0.992806 | 0 | | [3600000,3700000[ | 3650000 | 0 | 0 | 0.992806 | 0 | | [3700000,3800000[ | 3750000 | 0 | 0 | 0.992806 | 0 | | [3800000,3900000[ | 3850000 | 0 | 0 | 0.992806 | 0 | | [3900000,4e+06[ | 3950000 | 0 | 0 | 0.992806 | 0 | | [4e+06,4100000[ | 4050000 | 0 | 0 | 0.992806 | 0 | | [4100000,4200000[ | 4150000 | 0 | 0 | 0.992806 | 0 | | [4200000,4300000] | 4250000 | 1 | 0.007194 | 1 | 0 |
\begin{tabular}{lllllllll}
\hline
Frequency Table (Histogram) \tabularnewline
Bins & Midpoint & Abs. Frequency & Rel. Frequency & Cumul. Rel. Freq. & Density \tabularnewline
[0,1e+05[ & 50000 & 26 & 0.18705 & 0.18705 & 2e-06 \tabularnewline
[1e+05,2e+05[ & 150000 & 25 & 0.179856 & 0.366906 & 2e-06 \tabularnewline
[2e+05,3e+05[ & 250000 & 50 & 0.359712 & 0.726619 & 4e-06 \tabularnewline
[3e+05,4e+05[ & 350000 & 13 & 0.093525 & 0.820144 & 1e-06 \tabularnewline
[4e+05,5e+05[ & 450000 & 12 & 0.086331 & 0.906475 & 1e-06 \tabularnewline
[5e+05,6e+05[ & 550000 & 2 & 0.014388 & 0.920863 & 0 \tabularnewline
[6e+05,7e+05[ & 650000 & 6 & 0.043165 & 0.964029 & 0 \tabularnewline
[7e+05,8e+05[ & 750000 & 0 & 0 & 0.964029 & 0 \tabularnewline
[8e+05,9e+05[ & 850000 & 0 & 0 & 0.964029 & 0 \tabularnewline
[9e+05,1e+06[ & 950000 & 1 & 0.007194 & 0.971223 & 0 \tabularnewline
[1e+06,1100000[ & 1050000 & 1 & 0.007194 & 0.978417 & 0 \tabularnewline
[1100000,1200000[ & 1150000 & 0 & 0 & 0.978417 & 0 \tabularnewline
[1200000,1300000[ & 1250000 & 0 & 0 & 0.978417 & 0 \tabularnewline
[1300000,1400000[ & 1350000 & 1 & 0.007194 & 0.985612 & 0 \tabularnewline
[1400000,1500000[ & 1450000 & 0 & 0 & 0.985612 & 0 \tabularnewline
[1500000,1600000[ & 1550000 & 0 & 0 & 0.985612 & 0 \tabularnewline
[1600000,1700000[ & 1650000 & 0 & 0 & 0.985612 & 0 \tabularnewline
[1700000,1800000[ & 1750000 & 0 & 0 & 0.985612 & 0 \tabularnewline
[1800000,1900000[ & 1850000 & 0 & 0 & 0.985612 & 0 \tabularnewline
[1900000,2e+06[ & 1950000 & 0 & 0 & 0.985612 & 0 \tabularnewline
[2e+06,2100000[ & 2050000 & 0 & 0 & 0.985612 & 0 \tabularnewline
[2100000,2200000[ & 2150000 & 0 & 0 & 0.985612 & 0 \tabularnewline
[2200000,2300000[ & 2250000 & 0 & 0 & 0.985612 & 0 \tabularnewline
[2300000,2400000[ & 2350000 & 0 & 0 & 0.985612 & 0 \tabularnewline
[2400000,2500000[ & 2450000 & 0 & 0 & 0.985612 & 0 \tabularnewline
[2500000,2600000[ & 2550000 & 0 & 0 & 0.985612 & 0 \tabularnewline
[2600000,2700000[ & 2650000 & 0 & 0 & 0.985612 & 0 \tabularnewline
[2700000,2800000[ & 2750000 & 1 & 0.007194 & 0.992806 & 0 \tabularnewline
[2800000,2900000[ & 2850000 & 0 & 0 & 0.992806 & 0 \tabularnewline
[2900000,3e+06[ & 2950000 & 0 & 0 & 0.992806 & 0 \tabularnewline
[3e+06,3100000[ & 3050000 & 0 & 0 & 0.992806 & 0 \tabularnewline
[3100000,3200000[ & 3150000 & 0 & 0 & 0.992806 & 0 \tabularnewline
[3200000,3300000[ & 3250000 & 0 & 0 & 0.992806 & 0 \tabularnewline
[3300000,3400000[ & 3350000 & 0 & 0 & 0.992806 & 0 \tabularnewline
[3400000,3500000[ & 3450000 & 0 & 0 & 0.992806 & 0 \tabularnewline
[3500000,3600000[ & 3550000 & 0 & 0 & 0.992806 & 0 \tabularnewline
[3600000,3700000[ & 3650000 & 0 & 0 & 0.992806 & 0 \tabularnewline
[3700000,3800000[ & 3750000 & 0 & 0 & 0.992806 & 0 \tabularnewline
[3800000,3900000[ & 3850000 & 0 & 0 & 0.992806 & 0 \tabularnewline
[3900000,4e+06[ & 3950000 & 0 & 0 & 0.992806 & 0 \tabularnewline
[4e+06,4100000[ & 4050000 & 0 & 0 & 0.992806 & 0 \tabularnewline
[4100000,4200000[ & 4150000 & 0 & 0 & 0.992806 & 0 \tabularnewline
[4200000,4300000] & 4250000 & 1 & 0.007194 & 1 & 0 \tabularnewline
\hline
\end{tabular}
%Source: https://freestatistics.org/blog/index.php?pk=79887&T=1
[TABLE]
[ROW][C]Frequency Table (Histogram)[/C][/ROW]
[ROW][C]Bins[/C][C]Midpoint[/C][C]Abs. Frequency[/C][C]Rel. Frequency[/C][C]Cumul. Rel. Freq.[/C][C]Density[/C][/ROW]
[ROW][C][0,1e+05[[/C][C]50000[/C][C]26[/C][C]0.18705[/C][C]0.18705[/C][C]2e-06[/C][/ROW]
[ROW][C][1e+05,2e+05[[/C][C]150000[/C][C]25[/C][C]0.179856[/C][C]0.366906[/C][C]2e-06[/C][/ROW]
[ROW][C][2e+05,3e+05[[/C][C]250000[/C][C]50[/C][C]0.359712[/C][C]0.726619[/C][C]4e-06[/C][/ROW]
[ROW][C][3e+05,4e+05[[/C][C]350000[/C][C]13[/C][C]0.093525[/C][C]0.820144[/C][C]1e-06[/C][/ROW]
[ROW][C][4e+05,5e+05[[/C][C]450000[/C][C]12[/C][C]0.086331[/C][C]0.906475[/C][C]1e-06[/C][/ROW]
[ROW][C][5e+05,6e+05[[/C][C]550000[/C][C]2[/C][C]0.014388[/C][C]0.920863[/C][C]0[/C][/ROW]
[ROW][C][6e+05,7e+05[[/C][C]650000[/C][C]6[/C][C]0.043165[/C][C]0.964029[/C][C]0[/C][/ROW]
[ROW][C][7e+05,8e+05[[/C][C]750000[/C][C]0[/C][C]0[/C][C]0.964029[/C][C]0[/C][/ROW]
[ROW][C][8e+05,9e+05[[/C][C]850000[/C][C]0[/C][C]0[/C][C]0.964029[/C][C]0[/C][/ROW]
[ROW][C][9e+05,1e+06[[/C][C]950000[/C][C]1[/C][C]0.007194[/C][C]0.971223[/C][C]0[/C][/ROW]
[ROW][C][1e+06,1100000[[/C][C]1050000[/C][C]1[/C][C]0.007194[/C][C]0.978417[/C][C]0[/C][/ROW]
[ROW][C][1100000,1200000[[/C][C]1150000[/C][C]0[/C][C]0[/C][C]0.978417[/C][C]0[/C][/ROW]
[ROW][C][1200000,1300000[[/C][C]1250000[/C][C]0[/C][C]0[/C][C]0.978417[/C][C]0[/C][/ROW]
[ROW][C][1300000,1400000[[/C][C]1350000[/C][C]1[/C][C]0.007194[/C][C]0.985612[/C][C]0[/C][/ROW]
[ROW][C][1400000,1500000[[/C][C]1450000[/C][C]0[/C][C]0[/C][C]0.985612[/C][C]0[/C][/ROW]
[ROW][C][1500000,1600000[[/C][C]1550000[/C][C]0[/C][C]0[/C][C]0.985612[/C][C]0[/C][/ROW]
[ROW][C][1600000,1700000[[/C][C]1650000[/C][C]0[/C][C]0[/C][C]0.985612[/C][C]0[/C][/ROW]
[ROW][C][1700000,1800000[[/C][C]1750000[/C][C]0[/C][C]0[/C][C]0.985612[/C][C]0[/C][/ROW]
[ROW][C][1800000,1900000[[/C][C]1850000[/C][C]0[/C][C]0[/C][C]0.985612[/C][C]0[/C][/ROW]
[ROW][C][1900000,2e+06[[/C][C]1950000[/C][C]0[/C][C]0[/C][C]0.985612[/C][C]0[/C][/ROW]
[ROW][C][2e+06,2100000[[/C][C]2050000[/C][C]0[/C][C]0[/C][C]0.985612[/C][C]0[/C][/ROW]
[ROW][C][2100000,2200000[[/C][C]2150000[/C][C]0[/C][C]0[/C][C]0.985612[/C][C]0[/C][/ROW]
[ROW][C][2200000,2300000[[/C][C]2250000[/C][C]0[/C][C]0[/C][C]0.985612[/C][C]0[/C][/ROW]
[ROW][C][2300000,2400000[[/C][C]2350000[/C][C]0[/C][C]0[/C][C]0.985612[/C][C]0[/C][/ROW]
[ROW][C][2400000,2500000[[/C][C]2450000[/C][C]0[/C][C]0[/C][C]0.985612[/C][C]0[/C][/ROW]
[ROW][C][2500000,2600000[[/C][C]2550000[/C][C]0[/C][C]0[/C][C]0.985612[/C][C]0[/C][/ROW]
[ROW][C][2600000,2700000[[/C][C]2650000[/C][C]0[/C][C]0[/C][C]0.985612[/C][C]0[/C][/ROW]
[ROW][C][2700000,2800000[[/C][C]2750000[/C][C]1[/C][C]0.007194[/C][C]0.992806[/C][C]0[/C][/ROW]
[ROW][C][2800000,2900000[[/C][C]2850000[/C][C]0[/C][C]0[/C][C]0.992806[/C][C]0[/C][/ROW]
[ROW][C][2900000,3e+06[[/C][C]2950000[/C][C]0[/C][C]0[/C][C]0.992806[/C][C]0[/C][/ROW]
[ROW][C][3e+06,3100000[[/C][C]3050000[/C][C]0[/C][C]0[/C][C]0.992806[/C][C]0[/C][/ROW]
[ROW][C][3100000,3200000[[/C][C]3150000[/C][C]0[/C][C]0[/C][C]0.992806[/C][C]0[/C][/ROW]
[ROW][C][3200000,3300000[[/C][C]3250000[/C][C]0[/C][C]0[/C][C]0.992806[/C][C]0[/C][/ROW]
[ROW][C][3300000,3400000[[/C][C]3350000[/C][C]0[/C][C]0[/C][C]0.992806[/C][C]0[/C][/ROW]
[ROW][C][3400000,3500000[[/C][C]3450000[/C][C]0[/C][C]0[/C][C]0.992806[/C][C]0[/C][/ROW]
[ROW][C][3500000,3600000[[/C][C]3550000[/C][C]0[/C][C]0[/C][C]0.992806[/C][C]0[/C][/ROW]
[ROW][C][3600000,3700000[[/C][C]3650000[/C][C]0[/C][C]0[/C][C]0.992806[/C][C]0[/C][/ROW]
[ROW][C][3700000,3800000[[/C][C]3750000[/C][C]0[/C][C]0[/C][C]0.992806[/C][C]0[/C][/ROW]
[ROW][C][3800000,3900000[[/C][C]3850000[/C][C]0[/C][C]0[/C][C]0.992806[/C][C]0[/C][/ROW]
[ROW][C][3900000,4e+06[[/C][C]3950000[/C][C]0[/C][C]0[/C][C]0.992806[/C][C]0[/C][/ROW]
[ROW][C][4e+06,4100000[[/C][C]4050000[/C][C]0[/C][C]0[/C][C]0.992806[/C][C]0[/C][/ROW]
[ROW][C][4100000,4200000[[/C][C]4150000[/C][C]0[/C][C]0[/C][C]0.992806[/C][C]0[/C][/ROW]
[ROW][C][4200000,4300000][/C][C]4250000[/C][C]1[/C][C]0.007194[/C][C]1[/C][C]0[/C][/ROW]
[/TABLE]
Source: https://freestatistics.org/blog/index.php?pk=79887&T=1
Globally Unique Identifier (entire table): ba.freestatistics.org/blog/index.php?pk=79887&T=1
As an alternative you can also use a QR Code:
The GUIDs for individual cells are displayed in the table below:
| Frequency Table (Histogram) | | Bins | Midpoint | Abs. Frequency | Rel. Frequency | Cumul. Rel. Freq. | Density | | [0,1e+05[ | 50000 | 26 | 0.18705 | 0.18705 | 2e-06 | | [1e+05,2e+05[ | 150000 | 25 | 0.179856 | 0.366906 | 2e-06 | | [2e+05,3e+05[ | 250000 | 50 | 0.359712 | 0.726619 | 4e-06 | | [3e+05,4e+05[ | 350000 | 13 | 0.093525 | 0.820144 | 1e-06 | | [4e+05,5e+05[ | 450000 | 12 | 0.086331 | 0.906475 | 1e-06 | | [5e+05,6e+05[ | 550000 | 2 | 0.014388 | 0.920863 | 0 | | [6e+05,7e+05[ | 650000 | 6 | 0.043165 | 0.964029 | 0 | | [7e+05,8e+05[ | 750000 | 0 | 0 | 0.964029 | 0 | | [8e+05,9e+05[ | 850000 | 0 | 0 | 0.964029 | 0 | | [9e+05,1e+06[ | 950000 | 1 | 0.007194 | 0.971223 | 0 | | [1e+06,1100000[ | 1050000 | 1 | 0.007194 | 0.978417 | 0 | | [1100000,1200000[ | 1150000 | 0 | 0 | 0.978417 | 0 | | [1200000,1300000[ | 1250000 | 0 | 0 | 0.978417 | 0 | | [1300000,1400000[ | 1350000 | 1 | 0.007194 | 0.985612 | 0 | | [1400000,1500000[ | 1450000 | 0 | 0 | 0.985612 | 0 | | [1500000,1600000[ | 1550000 | 0 | 0 | 0.985612 | 0 | | [1600000,1700000[ | 1650000 | 0 | 0 | 0.985612 | 0 | | [1700000,1800000[ | 1750000 | 0 | 0 | 0.985612 | 0 | | [1800000,1900000[ | 1850000 | 0 | 0 | 0.985612 | 0 | | [1900000,2e+06[ | 1950000 | 0 | 0 | 0.985612 | 0 | | [2e+06,2100000[ | 2050000 | 0 | 0 | 0.985612 | 0 | | [2100000,2200000[ | 2150000 | 0 | 0 | 0.985612 | 0 | | [2200000,2300000[ | 2250000 | 0 | 0 | 0.985612 | 0 | | [2300000,2400000[ | 2350000 | 0 | 0 | 0.985612 | 0 | | [2400000,2500000[ | 2450000 | 0 | 0 | 0.985612 | 0 | | [2500000,2600000[ | 2550000 | 0 | 0 | 0.985612 | 0 | | [2600000,2700000[ | 2650000 | 0 | 0 | 0.985612 | 0 | | [2700000,2800000[ | 2750000 | 1 | 0.007194 | 0.992806 | 0 | | [2800000,2900000[ | 2850000 | 0 | 0 | 0.992806 | 0 | | [2900000,3e+06[ | 2950000 | 0 | 0 | 0.992806 | 0 | | [3e+06,3100000[ | 3050000 | 0 | 0 | 0.992806 | 0 | | [3100000,3200000[ | 3150000 | 0 | 0 | 0.992806 | 0 | | [3200000,3300000[ | 3250000 | 0 | 0 | 0.992806 | 0 | | [3300000,3400000[ | 3350000 | 0 | 0 | 0.992806 | 0 | | [3400000,3500000[ | 3450000 | 0 | 0 | 0.992806 | 0 | | [3500000,3600000[ | 3550000 | 0 | 0 | 0.992806 | 0 | | [3600000,3700000[ | 3650000 | 0 | 0 | 0.992806 | 0 | | [3700000,3800000[ | 3750000 | 0 | 0 | 0.992806 | 0 | | [3800000,3900000[ | 3850000 | 0 | 0 | 0.992806 | 0 | | [3900000,4e+06[ | 3950000 | 0 | 0 | 0.992806 | 0 | | [4e+06,4100000[ | 4050000 | 0 | 0 | 0.992806 | 0 | | [4100000,4200000[ | 4150000 | 0 | 0 | 0.992806 | 0 | | [4200000,4300000] | 4250000 | 1 | 0.007194 | 1 | 0 |
If you paste this QR Code into your document, anyone with a smartphone or tablet will be able to scan it and view this table in a browser.
If you paste this QR Code into your document, anyone with a smartphone or tablet will be able to scan it and view this table in a browser.
If you paste this QR Code into your document, anyone with a smartphone or tablet will be able to scan it and view this table in a browser.
If you paste this QR Code into your document, anyone with a smartphone or tablet will be able to scan it and view this table in a browser.
If you paste this QR Code into your document, anyone with a smartphone or tablet will be able to scan it and view this table in a browser.
|