Free Statistics

of Irreproducible Research!

Author's title

Author*The author of this computation has been verified*
R Software Modulerwasp_autocorrelation.wasp
Title produced by software(Partial) Autocorrelation Function
Date of computationSun, 28 Nov 2010 20:33:38 +0000
Cite this page as followsStatistical Computations at FreeStatistics.org, Office for Research Development and Education, URL https://freestatistics.org/blog/index.php?v=date/2010/Nov/28/t12909763246hkie8sg5rq38nj.htm/, Retrieved Mon, 29 Apr 2024 08:05:41 +0000
Statistical Computations at FreeStatistics.org, Office for Research Development and Education, URL https://freestatistics.org/blog/index.php?pk=102732, Retrieved Mon, 29 Apr 2024 08:05:41 +0000
QR Codes:

Original text written by user:
IsPrivate?No (this computation is public)
User-defined keywords
Estimated Impact189
Family? (F = Feedback message, R = changed R code, M = changed R Module, P = changed Parameters, D = changed Data)
F     [Univariate Data Series] [HPC Retail Sales] [2008-03-02 15:42:48] [74be16979710d4c4e7c6647856088456]
- RMPD  [Central Tendency] [Workshop 8, Robus...] [2010-11-28 19:41:12] [d946de7cca328fbcf207448a112523ab]
-         [Central Tendency] [WS 8 Robustness o...] [2010-11-28 20:01:42] [8081b8996d5947580de3eb171e82db4f]
- RMPD        [(Partial) Autocorrelation Function] [WS 8 Autocorrelat...] [2010-11-28 20:33:38] [4d0f7ea43b071af5c75b527ee1ef14c2] [Current]
Feedback Forum

Post a new message
Dataseries X:
8.915
9.452
9.112
8.472
8.230
8.384
8.625
8.221
8.649
8.625
10.443
10.357
8.586
8.892
8.329
8.101
7.922
8.120
7.838
7.735
8.406
8.209
9.451
10.041
9.411
10.405
8.467
8.464
8.102
7.627
7.513
7.510
8.291
8.064
9.383
9.706
8.579
9.474
8.318
8.213
8.059
9.111
7.708
7.680
8.014
8.007
8.718
9.486
9.113
9.025
8.476
7.952
7.759
7.835
7.600
7.651
8.319
8.812
8.630


Summary of computational transaction
Raw Inputview raw input (R code)
Raw Outputview raw output of R engine
Computing time1 seconds
R Server'Sir Ronald Aylmer Fisher' @ 193.190.124.24

\begin{tabular}{lllllllll}
\hline
Summary of computational transaction \tabularnewline
Raw Input & view raw input (R code)  \tabularnewline
Raw Output & view raw output of R engine  \tabularnewline
Computing time & 1 seconds \tabularnewline
R Server & 'Sir Ronald Aylmer Fisher' @ 193.190.124.24 \tabularnewline
\hline
\end{tabular}
%Source: https://freestatistics.org/blog/index.php?pk=102732&T=0

[TABLE]
[ROW][C]Summary of computational transaction[/C][/ROW]
[ROW][C]Raw Input[/C][C]view raw input (R code) [/C][/ROW]
[ROW][C]Raw Output[/C][C]view raw output of R engine [/C][/ROW]
[ROW][C]Computing time[/C][C]1 seconds[/C][/ROW]
[ROW][C]R Server[/C][C]'Sir Ronald Aylmer Fisher' @ 193.190.124.24[/C][/ROW]
[/TABLE]
Source: https://freestatistics.org/blog/index.php?pk=102732&T=0

Globally Unique Identifier (entire table): ba.freestatistics.org/blog/index.php?pk=102732&T=0

As an alternative you can also use a QR Code:  

The GUIDs for individual cells are displayed in the table below:

Summary of computational transaction
Raw Inputview raw input (R code)
Raw Outputview raw output of R engine
Computing time1 seconds
R Server'Sir Ronald Aylmer Fisher' @ 193.190.124.24


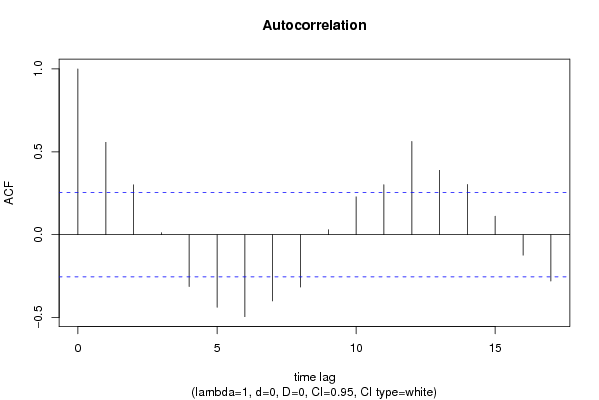
Autocorrelation Function
Time lag kACF(k)T-STATP-value
10.5572114.283.5e-05
20.3004912.30810.012258
30.0119750.0920.463513
4-0.313546-2.40840.009583
5-0.437905-3.36360.000678
6-0.494812-3.80070.000172
7-0.3998-3.07090.001612
8-0.316102-2.4280.009125
90.0300660.23090.409079
100.2280721.75190.042497
110.301522.3160.012025
120.561944.31633.1e-05
130.3879242.97970.002092
140.3030422.32770.011688
150.1109830.85250.198698
16-0.12354-0.94890.173263
17-0.280017-2.15090.017797

\begin{tabular}{lllllllll}
\hline
Autocorrelation Function \tabularnewline
Time lag k & ACF(k) & T-STAT & P-value \tabularnewline
1 & 0.557211 & 4.28 & 3.5e-05 \tabularnewline
2 & 0.300491 & 2.3081 & 0.012258 \tabularnewline
3 & 0.011975 & 0.092 & 0.463513 \tabularnewline
4 & -0.313546 & -2.4084 & 0.009583 \tabularnewline
5 & -0.437905 & -3.3636 & 0.000678 \tabularnewline
6 & -0.494812 & -3.8007 & 0.000172 \tabularnewline
7 & -0.3998 & -3.0709 & 0.001612 \tabularnewline
8 & -0.316102 & -2.428 & 0.009125 \tabularnewline
9 & 0.030066 & 0.2309 & 0.409079 \tabularnewline
10 & 0.228072 & 1.7519 & 0.042497 \tabularnewline
11 & 0.30152 & 2.316 & 0.012025 \tabularnewline
12 & 0.56194 & 4.3163 & 3.1e-05 \tabularnewline
13 & 0.387924 & 2.9797 & 0.002092 \tabularnewline
14 & 0.303042 & 2.3277 & 0.011688 \tabularnewline
15 & 0.110983 & 0.8525 & 0.198698 \tabularnewline
16 & -0.12354 & -0.9489 & 0.173263 \tabularnewline
17 & -0.280017 & -2.1509 & 0.017797 \tabularnewline
\hline
\end{tabular}
%Source: https://freestatistics.org/blog/index.php?pk=102732&T=1

[TABLE]
[ROW][C]Autocorrelation Function[/C][/ROW]
[ROW][C]Time lag k[/C][C]ACF(k)[/C][C]T-STAT[/C][C]P-value[/C][/ROW]
[ROW][C]1[/C][C]0.557211[/C][C]4.28[/C][C]3.5e-05[/C][/ROW]
[ROW][C]2[/C][C]0.300491[/C][C]2.3081[/C][C]0.012258[/C][/ROW]
[ROW][C]3[/C][C]0.011975[/C][C]0.092[/C][C]0.463513[/C][/ROW]
[ROW][C]4[/C][C]-0.313546[/C][C]-2.4084[/C][C]0.009583[/C][/ROW]
[ROW][C]5[/C][C]-0.437905[/C][C]-3.3636[/C][C]0.000678[/C][/ROW]
[ROW][C]6[/C][C]-0.494812[/C][C]-3.8007[/C][C]0.000172[/C][/ROW]
[ROW][C]7[/C][C]-0.3998[/C][C]-3.0709[/C][C]0.001612[/C][/ROW]
[ROW][C]8[/C][C]-0.316102[/C][C]-2.428[/C][C]0.009125[/C][/ROW]
[ROW][C]9[/C][C]0.030066[/C][C]0.2309[/C][C]0.409079[/C][/ROW]
[ROW][C]10[/C][C]0.228072[/C][C]1.7519[/C][C]0.042497[/C][/ROW]
[ROW][C]11[/C][C]0.30152[/C][C]2.316[/C][C]0.012025[/C][/ROW]
[ROW][C]12[/C][C]0.56194[/C][C]4.3163[/C][C]3.1e-05[/C][/ROW]
[ROW][C]13[/C][C]0.387924[/C][C]2.9797[/C][C]0.002092[/C][/ROW]
[ROW][C]14[/C][C]0.303042[/C][C]2.3277[/C][C]0.011688[/C][/ROW]
[ROW][C]15[/C][C]0.110983[/C][C]0.8525[/C][C]0.198698[/C][/ROW]
[ROW][C]16[/C][C]-0.12354[/C][C]-0.9489[/C][C]0.173263[/C][/ROW]
[ROW][C]17[/C][C]-0.280017[/C][C]-2.1509[/C][C]0.017797[/C][/ROW]
[/TABLE]
Source: https://freestatistics.org/blog/index.php?pk=102732&T=1

Globally Unique Identifier (entire table): ba.freestatistics.org/blog/index.php?pk=102732&T=1

As an alternative you can also use a QR Code:  

The GUIDs for individual cells are displayed in the table below:

Autocorrelation Function
Time lag kACF(k)T-STATP-value
10.5572114.283.5e-05
20.3004912.30810.012258
30.0119750.0920.463513
4-0.313546-2.40840.009583
5-0.437905-3.36360.000678
6-0.494812-3.80070.000172
7-0.3998-3.07090.001612
8-0.316102-2.4280.009125
90.0300660.23090.409079
100.2280721.75190.042497
110.301522.3160.012025
120.561944.31633.1e-05
130.3879242.97970.002092
140.3030422.32770.011688
150.1109830.85250.198698
16-0.12354-0.94890.173263
17-0.280017-2.15090.017797


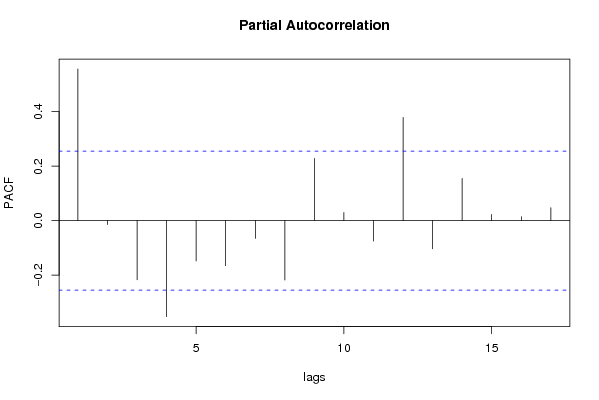
Partial Autocorrelation Function
Time lag kPACF(k)T-STATP-value
10.5572114.283.5e-05
2-0.014493-0.11130.45587
3-0.217318-1.66930.050183
4-0.352832-2.71020.004396
5-0.14806-1.13730.130012
6-0.165583-1.27190.104206
7-0.065274-0.50140.308986
8-0.218362-1.67730.049391
90.2283491.7540.042314
100.0294830.22650.410812
11-0.074828-0.57480.283817
120.3787852.90950.002549
13-0.103588-0.79570.214706
140.1548121.18910.119575
150.022480.17270.431751
160.0142890.10980.456486
170.047630.36580.357893

\begin{tabular}{lllllllll}
\hline
Partial Autocorrelation Function \tabularnewline
Time lag k & PACF(k) & T-STAT & P-value \tabularnewline
1 & 0.557211 & 4.28 & 3.5e-05 \tabularnewline
2 & -0.014493 & -0.1113 & 0.45587 \tabularnewline
3 & -0.217318 & -1.6693 & 0.050183 \tabularnewline
4 & -0.352832 & -2.7102 & 0.004396 \tabularnewline
5 & -0.14806 & -1.1373 & 0.130012 \tabularnewline
6 & -0.165583 & -1.2719 & 0.104206 \tabularnewline
7 & -0.065274 & -0.5014 & 0.308986 \tabularnewline
8 & -0.218362 & -1.6773 & 0.049391 \tabularnewline
9 & 0.228349 & 1.754 & 0.042314 \tabularnewline
10 & 0.029483 & 0.2265 & 0.410812 \tabularnewline
11 & -0.074828 & -0.5748 & 0.283817 \tabularnewline
12 & 0.378785 & 2.9095 & 0.002549 \tabularnewline
13 & -0.103588 & -0.7957 & 0.214706 \tabularnewline
14 & 0.154812 & 1.1891 & 0.119575 \tabularnewline
15 & 0.02248 & 0.1727 & 0.431751 \tabularnewline
16 & 0.014289 & 0.1098 & 0.456486 \tabularnewline
17 & 0.04763 & 0.3658 & 0.357893 \tabularnewline
\hline
\end{tabular}
%Source: https://freestatistics.org/blog/index.php?pk=102732&T=2

[TABLE]
[ROW][C]Partial Autocorrelation Function[/C][/ROW]
[ROW][C]Time lag k[/C][C]PACF(k)[/C][C]T-STAT[/C][C]P-value[/C][/ROW]
[ROW][C]1[/C][C]0.557211[/C][C]4.28[/C][C]3.5e-05[/C][/ROW]
[ROW][C]2[/C][C]-0.014493[/C][C]-0.1113[/C][C]0.45587[/C][/ROW]
[ROW][C]3[/C][C]-0.217318[/C][C]-1.6693[/C][C]0.050183[/C][/ROW]
[ROW][C]4[/C][C]-0.352832[/C][C]-2.7102[/C][C]0.004396[/C][/ROW]
[ROW][C]5[/C][C]-0.14806[/C][C]-1.1373[/C][C]0.130012[/C][/ROW]
[ROW][C]6[/C][C]-0.165583[/C][C]-1.2719[/C][C]0.104206[/C][/ROW]
[ROW][C]7[/C][C]-0.065274[/C][C]-0.5014[/C][C]0.308986[/C][/ROW]
[ROW][C]8[/C][C]-0.218362[/C][C]-1.6773[/C][C]0.049391[/C][/ROW]
[ROW][C]9[/C][C]0.228349[/C][C]1.754[/C][C]0.042314[/C][/ROW]
[ROW][C]10[/C][C]0.029483[/C][C]0.2265[/C][C]0.410812[/C][/ROW]
[ROW][C]11[/C][C]-0.074828[/C][C]-0.5748[/C][C]0.283817[/C][/ROW]
[ROW][C]12[/C][C]0.378785[/C][C]2.9095[/C][C]0.002549[/C][/ROW]
[ROW][C]13[/C][C]-0.103588[/C][C]-0.7957[/C][C]0.214706[/C][/ROW]
[ROW][C]14[/C][C]0.154812[/C][C]1.1891[/C][C]0.119575[/C][/ROW]
[ROW][C]15[/C][C]0.02248[/C][C]0.1727[/C][C]0.431751[/C][/ROW]
[ROW][C]16[/C][C]0.014289[/C][C]0.1098[/C][C]0.456486[/C][/ROW]
[ROW][C]17[/C][C]0.04763[/C][C]0.3658[/C][C]0.357893[/C][/ROW]
[/TABLE]
Source: https://freestatistics.org/blog/index.php?pk=102732&T=2

Globally Unique Identifier (entire table): ba.freestatistics.org/blog/index.php?pk=102732&T=2

As an alternative you can also use a QR Code:  

The GUIDs for individual cells are displayed in the table below:

Partial Autocorrelation Function
Time lag kPACF(k)T-STATP-value
10.5572114.283.5e-05
2-0.014493-0.11130.45587
3-0.217318-1.66930.050183
4-0.352832-2.71020.004396
5-0.14806-1.13730.130012
6-0.165583-1.27190.104206
7-0.065274-0.50140.308986
8-0.218362-1.67730.049391
90.2283491.7540.042314
100.0294830.22650.410812
11-0.074828-0.57480.283817
120.3787852.90950.002549
13-0.103588-0.79570.214706
140.1548121.18910.119575
150.022480.17270.431751
160.0142890.10980.456486
170.047630.36580.357893


Parameters (Session):
par1 = Default ; par2 = 1 ; par3 = 0 ; par4 = 0 ; par5 = 12 ; par6 = White Noise ; par7 = 0.95 ;
Parameters (R input):
par1 = Default ; par2 = 1 ; par3 = 0 ; par4 = 0 ; par5 = 12 ; par6 = White Noise ; par7 = 0.95 ;
R code (references can be found in the software module):
if (par1 == 'Default') {
par1 = 10*log10(length(x))
} else {
par1 <- as.numeric(par1)
}
par2 <- as.numeric(par2)
par3 <- as.numeric(par3)
par4 <- as.numeric(par4)
par5 <- as.numeric(par5)
if (par6 == 'White Noise') par6 <- 'white' else par6 <- 'ma'
par7 <- as.numeric(par7)
if (par2 == 0) {
x <- log(x)
} else {
x <- (x ^ par2 - 1) / par2
}
if (par3 > 0) x <- diff(x,lag=1,difference=par3)
if (par4 > 0) x <- diff(x,lag=par5,difference=par4)
bitmap(file='pic1.png')
racf <- acf(x, par1, main='Autocorrelation', xlab='time lag', ylab='ACF', ci.type=par6, ci=par7, sub=paste('(lambda=',par2,', d=',par3,', D=',par4,', CI=', par7, ', CI type=',par6,')',sep=''))
dev.off()
bitmap(file='pic2.png')
rpacf <- pacf(x,par1,main='Partial Autocorrelation',xlab='lags',ylab='PACF')
dev.off()
(myacf <- c(racf$acf))
(mypacf <- c(rpacf$acf))
lengthx <- length(x)
sqrtn <- sqrt(lengthx)
load(file='createtable')
a<-table.start()
a<-table.row.start(a)
a<-table.element(a,'Autocorrelation Function',4,TRUE)
a<-table.row.end(a)
a<-table.row.start(a)
a<-table.element(a,'Time lag k',header=TRUE)
a<-table.element(a,hyperlink('basics.htm','ACF(k)','click here for more information about the Autocorrelation Function'),header=TRUE)
a<-table.element(a,'T-STAT',header=TRUE)
a<-table.element(a,'P-value',header=TRUE)
a<-table.row.end(a)
for (i in 2:(par1+1)) {
a<-table.row.start(a)
a<-table.element(a,i-1,header=TRUE)
a<-table.element(a,round(myacf[i],6))
mytstat <- myacf[i]*sqrtn
a<-table.element(a,round(mytstat,4))
a<-table.element(a,round(1-pt(abs(mytstat),lengthx),6))
a<-table.row.end(a)
}
a<-table.end(a)
table.save(a,file='mytable.tab')
a<-table.start()
a<-table.row.start(a)
a<-table.element(a,'Partial Autocorrelation Function',4,TRUE)
a<-table.row.end(a)
a<-table.row.start(a)
a<-table.element(a,'Time lag k',header=TRUE)
a<-table.element(a,hyperlink('basics.htm','PACF(k)','click here for more information about the Partial Autocorrelation Function'),header=TRUE)
a<-table.element(a,'T-STAT',header=TRUE)
a<-table.element(a,'P-value',header=TRUE)
a<-table.row.end(a)
for (i in 1:par1) {
a<-table.row.start(a)
a<-table.element(a,i,header=TRUE)
a<-table.element(a,round(mypacf[i],6))
mytstat <- mypacf[i]*sqrtn
a<-table.element(a,round(mytstat,4))
a<-table.element(a,round(1-pt(abs(mytstat),lengthx),6))
a<-table.row.end(a)
}
a<-table.end(a)
table.save(a,file='mytable1.tab')