| *The author of this computation has been verified* | ||||||||||||||||||||||||||||||||||||||||||||||||||||||||||||||||||||||||||||
| R Software Module: /rwasp_histogram.wasp (opens new window with default values) | ||||||||||||||||||||||||||||||||||||||||||||||||||||||||||||||||||||||||||||
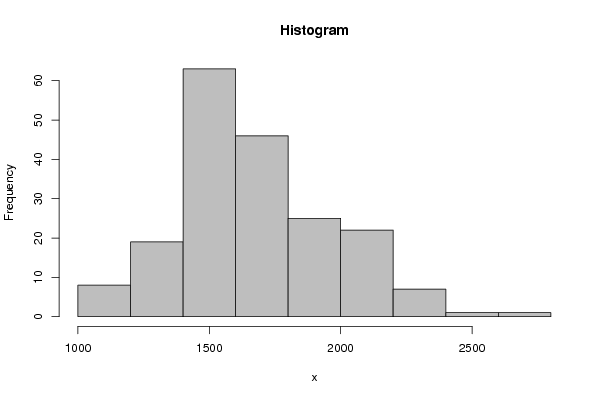
| Title produced by software: Histogram | ||||||||||||||||||||||||||||||||||||||||||||||||||||||||||||||||||||||||||||
| Date of computation: Thu, 25 Nov 2010 17:30:36 +0000 | ||||||||||||||||||||||||||||||||||||||||||||||||||||||||||||||||||||||||||||
| Cite this page as follows: | ||||||||||||||||||||||||||||||||||||||||||||||||||||||||||||||||||||||||||||
| Statistical Computations at FreeStatistics.org, Office for Research Development and Education, URL http://www.freestatistics.org/blog/date/2010/Nov/25/t1290706148r0o6tua2wl89t93.htm/, Retrieved Thu, 25 Nov 2010 18:29:08 +0100 | ||||||||||||||||||||||||||||||||||||||||||||||||||||||||||||||||||||||||||||
| BibTeX entries for LaTeX users: | ||||||||||||||||||||||||||||||||||||||||||||||||||||||||||||||||||||||||||||
@Manual{KEY,
    author = {{YOUR NAME}},
    publisher = {Office for Research Development and Education},
    title = {Statistical Computations at FreeStatistics.org, URL http://www.freestatistics.org/blog/date/2010/Nov/25/t1290706148r0o6tua2wl89t93.htm/},
    year = {2010},
}
@Manual{R,
    title = {R: A Language and Environment for Statistical Computing},
    author = {{R Development Core Team}},
    organization = {R Foundation for Statistical Computing},
    address = {Vienna, Austria},
    year = {2010},
    note = {{ISBN} 3-900051-07-0},
    url = {http://www.R-project.org},
}
| ||||||||||||||||||||||||||||||||||||||||||||||||||||||||||||||||||||||||||||
| Original text written by user: | ||||||||||||||||||||||||||||||||||||||||||||||||||||||||||||||||||||||||||||
| IsPrivate? | ||||||||||||||||||||||||||||||||||||||||||||||||||||||||||||||||||||||||||||
| No (this computation is public) | ||||||||||||||||||||||||||||||||||||||||||||||||||||||||||||||||||||||||||||
| User-defined keywords: | ||||||||||||||||||||||||||||||||||||||||||||||||||||||||||||||||||||||||||||
| Dataseries X: | ||||||||||||||||||||||||||||||||||||||||||||||||||||||||||||||||||||||||||||
| » Textbox « » Textfile « » CSV « | ||||||||||||||||||||||||||||||||||||||||||||||||||||||||||||||||||||||||||||
| 1687 1508 1507 1385 1632 1511 1559 1630 1579 1653 2152 2148 1752 1765 1717 1558 1575 1520 1805 1800 1719 2008 2242 2478 2030 1655 1693 1623 1805 1746 1795 1926 1619 1992 2233 2192 2080 1768 1835 1569 1976 1853 1965 1689 1778 1976 2397 2654 2097 1963 1677 1941 2003 1813 2012 1912 2084 2080 2118 2150 1608 1503 1548 1382 1731 1798 1779 1887 2004 2077 2092 2051 1577 1356 1652 1382 1519 1421 1442 1543 1656 1561 1905 2199 1473 1655 1407 1395 1530 1309 1526 1327 1627 1748 1958 2274 1648 1401 1411 1403 1394 1520 1528 1643 1515 1685 2000 2215 1956 1462 1563 1459 1446 1622 1657 1638 1643 1683 2050 2262 1813 1445 1762 1461 1556 1431 1427 1554 1645 1653 2016 2207 1665 1361 1506 1360 1453 1522 1460 1552 1548 1827 1737 1941 1474 1458 1542 1404 1522 1385 1641 1510 1681 1938 1868 1726 1456 1445 1456 1365 1487 1558 1488 1684 1594 1850 1998 2079 1494 1057 1218 etc... | ||||||||||||||||||||||||||||||||||||||||||||||||||||||||||||||||||||||||||||
| Output produced by software: | ||||||||||||||||||||||||||||||||||||||||||||||||||||||||||||||||||||||||||||
| ||||||||||||||||||||||||||||||||||||||||||||||||||||||||||||||||||||||||||||
| Charts produced by software: | ||||||||||||||||||||||||||||||||||||||||||||||||||||||||||||||||||||||||||||
| ||||||||||||||||||||||||||||||||||||||||||||||||||||||||||||||||||||||||||||
| Parameters (Session): | ||||||||||||||||||||||||||||||||||||||||||||||||||||||||||||||||||||||||||||
| par2 = grey ; par3 = FALSE ; par4 = Unknown ; | ||||||||||||||||||||||||||||||||||||||||||||||||||||||||||||||||||||||||||||
| Parameters (R input): | ||||||||||||||||||||||||||||||||||||||||||||||||||||||||||||||||||||||||||||
| par2 = grey ; par3 = FALSE ; par4 = Unknown ; | ||||||||||||||||||||||||||||||||||||||||||||||||||||||||||||||||||||||||||||
| R code (references can be found in the software module): | ||||||||||||||||||||||||||||||||||||||||||||||||||||||||||||||||||||||||||||
| par1 <- as.numeric(par1)
if (par3 == 'TRUE') par3 <- TRUE if (par3 == 'FALSE') par3 <- FALSE if (par4 == 'Unknown') par1 <- as.numeric(par1) if (par4 == 'Interval/Ratio') par1 <- as.numeric(par1) if (par4 == '3-point Likert') par1 <- c(1:3 - 0.5, 3.5) if (par4 == '4-point Likert') par1 <- c(1:4 - 0.5, 4.5) if (par4 == '5-point Likert') par1 <- c(1:5 - 0.5, 5.5) if (par4 == '6-point Likert') par1 <- c(1:6 - 0.5, 6.5) if (par4 == '7-point Likert') par1 <- c(1:7 - 0.5, 7.5) if (par4 == '8-point Likert') par1 <- c(1:8 - 0.5, 8.5) if (par4 == '9-point Likert') par1 <- c(1:9 - 0.5, 9.5) if (par4 == '10-point Likert') par1 <- c(1:10 - 0.5, 10.5) bitmap(file='test1.png') if(is.numeric(x[1])) { if (is.na(par1)) { myhist<-hist(x,col=par2,main=main,xlab=xlab,right=par3) } else { if (par1 < 0) par1 <- 3 if (par1 > 50) par1 <- 50 myhist<-hist(x,breaks=par1,col=par2,main=main,xlab=xlab,right=par3) } } else { plot(mytab <- table(x),col=par2,main='Frequency Plot',xlab=xlab,ylab='Absolute Frequency') } dev.off() if(is.numeric(x[1])) { myhist n <- length(x) load(file='createtable') a<-table.start() a<-table.row.start(a) a<-table.element(a,hyperlink('http://www.xycoon.com/histogram.htm','Frequency Table (Histogram)',''),6,TRUE) a<-table.row.end(a) a<-table.row.start(a) a<-table.element(a,'Bins',header=TRUE) a<-table.element(a,'Midpoint',header=TRUE) a<-table.element(a,'Abs. Frequency',header=TRUE) a<-table.element(a,'Rel. Frequency',header=TRUE) a<-table.element(a,'Cumul. Rel. Freq.',header=TRUE) a<-table.element(a,'Density',header=TRUE) a<-table.row.end(a) crf <- 0 if (par3 == FALSE) mybracket <- '[' else mybracket <- ']' mynumrows <- (length(myhist$breaks)-1) for (i in 1:mynumrows) { a<-table.row.start(a) if (i == 1) dum <- paste('[',myhist$breaks[i],sep='') else dum <- paste(mybracket,myhist$breaks[i],sep='') dum <- paste(dum,myhist$breaks[i+1],sep=',') if (i==mynumrows) dum <- paste(dum,']',sep='') else dum <- paste(dum,mybracket,sep='') a<-table.element(a,dum,header=TRUE) a<-table.element(a,myhist$mids[i]) a<-table.element(a,myhist$counts[i]) rf <- myhist$counts[i]/n crf <- crf + rf a<-table.element(a,round(rf,6)) a<-table.element(a,round(crf,6)) a<-table.element(a,round(myhist$density[i],6)) a<-table.row.end(a) } a<-table.end(a) table.save(a,file='mytable.tab') } else { mytab reltab <- mytab / sum(mytab) n <- length(mytab) load(file='createtable') a<-table.start() a<-table.row.start(a) a<-table.element(a,'Frequency Table (Categorical Data)',3,TRUE) a<-table.row.end(a) a<-table.row.start(a) a<-table.element(a,'Category',header=TRUE) a<-table.element(a,'Abs. Frequency',header=TRUE) a<-table.element(a,'Rel. Frequency',header=TRUE) a<-table.row.end(a) for (i in 1:n) { a<-table.row.start(a) a<-table.element(a,labels(mytab)$x[i],header=TRUE) a<-table.element(a,mytab[i]) a<-table.element(a,round(reltab[i],4)) a<-table.row.end(a) } a<-table.end(a) table.save(a,file='mytable1.tab') } | ||||||||||||||||||||||||||||||||||||||||||||||||||||||||||||||||||||||||||||
Copyright

This work is licensed under a
Creative Commons Attribution-Noncommercial-Share Alike 3.0 License.
Software written by Ed van Stee & Patrick Wessa
Disclaimer
Information provided on this web site is provided "AS IS" without warranty of any kind, either express or implied, including, without limitation, warranties of merchantability, fitness for a particular purpose, and noninfringement. We use reasonable efforts to include accurate and timely information and periodically update the information, and software without notice. However, we make no warranties or representations as to the accuracy or completeness of such information (or software), and we assume no liability or responsibility for errors or omissions in the content of this web site, or any software bugs in online applications. Your use of this web site is AT YOUR OWN RISK. Under no circumstances and under no legal theory shall we be liable to you or any other person for any direct, indirect, special, incidental, exemplary, or consequential damages arising from your access to, or use of, this web site.
Privacy Policy
We may request personal information to be submitted to our servers in order to be able to:
- personalize online software applications according to your needs
- enforce strict security rules with respect to the data that you upload (e.g. statistical data)
- manage user sessions of online applications
- alert you about important changes or upgrades in resources or applications
We NEVER allow other companies to directly offer registered users information about their products and services. Banner references and hyperlinks of third parties NEVER contain any personal data of the visitor.
We do NOT sell, nor transmit by any means, personal information, nor statistical data series uploaded by you to third parties.
We carefully protect your data from loss, misuse, alteration,
and destruction. However, at any time, and under any circumstance you
are solely responsible for managing your passwords, and keeping them
secret.
We store a unique ANONYMOUS USER ID in the form of a small 'Cookie' on your computer. This allows us to track your progress when using this website which is necessary to create state-dependent features. The cookie is used for NO OTHER PURPOSE. At any time you may opt to disallow cookies from this website - this will not affect other features of this website.
We examine cookies that are used by third-parties (banner and online ads) very closely: abuse from third-parties automatically results in termination of the advertising contract without refund. We have very good reason to believe that the cookies that are produced by third parties (banner ads) do NOT cause any privacy or security risk.
FreeStatistics.org is safe. There is no need to download any software to use the applications and services contained in this website. Hence, your system's security is not compromised by their use, and your personal data - other than data you submit in the account application form, and the user-agent information that is transmitted by your browser - is never transmitted to our servers.
As a general rule, we do not log on-line behavior of individuals (other than normal logging of webserver 'hits'). However, in cases of abuse, hacking, unauthorized access, Denial of Service attacks, illegal copying, hotlinking, non-compliance with international webstandards (such as robots.txt), or any other harmful behavior, our system engineers are empowered to log, track, identify, publish, and ban misbehaving individuals - even if this leads to ban entire blocks of IP addresses, or disclosing user's identity.