Free Statistics

of Irreproducible Research!

Author's title

Author*The author of this computation has been verified*
R Software Modulerwasp_edauni.wasp
Title produced by softwareUnivariate Explorative Data Analysis
Date of computationTue, 23 Nov 2010 18:35:16 +0000
Cite this page as followsStatistical Computations at FreeStatistics.org, Office for Research Development and Education, URL https://freestatistics.org/blog/index.php?v=date/2010/Nov/23/t12905372208j4tkb4n8krtsr2.htm/, Retrieved Sat, 20 Apr 2024 02:41:56 +0000
Statistical Computations at FreeStatistics.org, Office for Research Development and Education, URL https://freestatistics.org/blog/index.php?pk=99555, Retrieved Sat, 20 Apr 2024 02:41:56 +0000
QR Codes:

Original text written by user:
IsPrivate?No (this computation is public)
User-defined keywords
Estimated Impact181
Family? (F = Feedback message, R = changed R code, M = changed R Module, P = changed Parameters, D = changed Data)
-     [Univariate Explorative Data Analysis] [time effect in su...] [2010-11-17 08:55:33] [b98453cac15ba1066b407e146608df68]
-    D  [Univariate Explorative Data Analysis] [workshop 7 - tuto...] [2010-11-19 11:36:57] [956e8df26b41c50d9c6c2ec1b6a122a8]
-    D    [Univariate Explorative Data Analysis] [WS7 comp 2] [2010-11-23 09:21:46] [dc30d19c3bc2be07fe595ad36c2cf923]
F   P         [Univariate Explorative Data Analysis] [ws 7] [2010-11-23 18:35:16] [7131fefee4115a2a717140ef0bdd6369] [Current]
Feedback Forum
2010-11-28 12:16:03 [201022de16daa1dc0c172603d7d3cd57] [reply
Je hebt de X-waarden niet van hun juiste naam voorzien, dit maakt het voor mij quasi onmogelijk om te controleren of je het juist geïnterpreteerd hebt. Als ik er vanuit ga dat ze in de berekening in dezelfde volgorde staan als in de tabel die je hebt bijgevoegd dan kan ik zeggen dat voor X3t (verwachting van de ouders) en X4t (kritiek van de ouders) je H0 wel moet aanvaarden. Je verwacht dat de waarden kleiner gaan zijn dan 0 en dat is ook zo te zien aan de waarde die gegeven staat in de tabel parameter. Je zegt ook nog dat je voor de F-test een p-waarde hebt van 0 maar dit klopt niet, de p-waarde is gelijk aan 2,67. Je hebt ook de grafieken in deze berekening niet geïnterpreteerd. Op de Actuals and Interpolation plot kan je zien dat de verwachte waarden (de bolletjes) zeer sterk afwijken van de werkelijke waarden (de volle lijn), ook zijn de gegevens niet normaal verdeeld. Volgens de Lag Plot is een een zeer kleine autocorrelatie maar op de Residual Autocorrelation Function is dit dan weer niet te zien, we zitten hier met een randgeval. Maar aan de andere kant liggen de Residuals wel op een golvende lijn. Dit toont allemaal aan dat we hier te maken hebben met slecht model.
2010-11-28 12:17:02 [201022de16daa1dc0c172603d7d3cd57] [reply
Bovenstaande commentaar moet staan bij de eerste berekening van de WS.
2010-11-28 12:17:27 [201022de16daa1dc0c172603d7d3cd57] [reply
Je hebt de X-waarden niet van hun juiste naam voorzien, dit maakt het voor mij quasi onmogelijk om te controleren of je het juist geïnterpreteerd hebt. Als ik er vanuit ga dat ze in de berekening in dezelfde volgorde staan als in de tabel die je hebt bijgevoegd dan kan ik zeggen dat voor X3t (verwachting van de ouders) en X4t (kritiek van de ouders) je H0 wel moet aanvaarden. Je verwacht dat de waarden kleiner gaan zijn dan 0 en dat is ook zo te zien aan de waarde die gegeven staat in de tabel parameter. Je zegt ook nog dat je voor de F-test een p-waarde hebt van 0 maar dit klopt niet, de p-waarde is gelijk aan 2,67. Je hebt ook de grafieken in deze berekening niet geïnterpreteerd. Op de Actuals and Interpolation plot kan je zien dat de verwachte waarden (de bolletjes) zeer sterk afwijken van de werkelijke waarden (de volle lijn), ook zijn de gegevens niet normaal verdeeld. Volgens de Lag Plot is een een zeer kleine autocorrelatie maar op de Residual Autocorrelation Function is dit dan weer niet te zien, we zitten hier met een randgeval. Maar aan de andere kant liggen de Residuals wel op een golvende lijn. Dit toont allemaal aan dat we hier te maken hebben met slecht model.

Post a new message
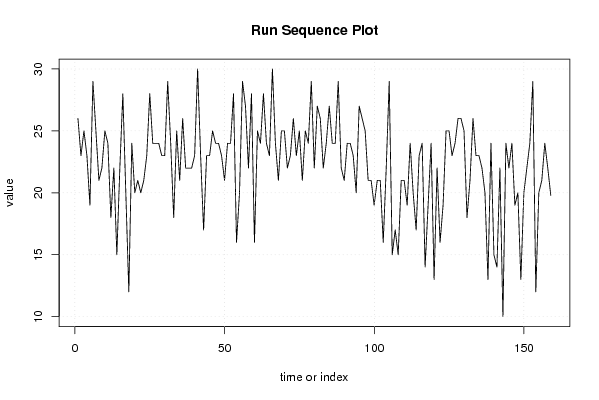
Dataseries X:
26
23
25
23
19
29
25
21
22
25
24
18
22
15
22
28
20
12
24
20
21
20
21
23
28
24
24
24
23
23
29
24
18
25
21
26
22
22
22
23
30
23
17
23
23
25
24
24
23
21
24
24
28
16
20
29
27
22
28
16
25
24
28
24
23
30
24
21
25
25
22
23
26
23
25
21
25
24
29
22
27
26
22
24
27
24
24
29
22
21
24
24
23
20
27
26
25
21
21
19
21
21
16
22
29
15
17
15
21
21
19
24
20
17
23
24
14
19
24
13
22
16
19
25
25
23
24
26
26
25
18
21
26
23
23
22
20
13
24
15
14
22
10
24
22
24
19
20
13
20
22
24
29
12
20
21
24
22
19.8


Summary of computational transaction
Raw Inputview raw input (R code)
Raw Outputview raw output of R engine
Computing time7 seconds
R Server'George Udny Yule' @ 72.249.76.132

\begin{tabular}{lllllllll}
\hline
Summary of computational transaction \tabularnewline
Raw Input & view raw input (R code)  \tabularnewline
Raw Output & view raw output of R engine  \tabularnewline
Computing time & 7 seconds \tabularnewline
R Server & 'George Udny Yule' @ 72.249.76.132 \tabularnewline
\hline
\end{tabular}
%Source: https://freestatistics.org/blog/index.php?pk=99555&T=0

[TABLE]
[ROW][C]Summary of computational transaction[/C][/ROW]
[ROW][C]Raw Input[/C][C]view raw input (R code) [/C][/ROW]
[ROW][C]Raw Output[/C][C]view raw output of R engine [/C][/ROW]
[ROW][C]Computing time[/C][C]7 seconds[/C][/ROW]
[ROW][C]R Server[/C][C]'George Udny Yule' @ 72.249.76.132[/C][/ROW]
[/TABLE]
Source: https://freestatistics.org/blog/index.php?pk=99555&T=0

Globally Unique Identifier (entire table): ba.freestatistics.org/blog/index.php?pk=99555&T=0

As an alternative you can also use a QR Code:  

The GUIDs for individual cells are displayed in the table below:

Summary of computational transaction
Raw Inputview raw input (R code)
Raw Outputview raw output of R engine
Computing time7 seconds
R Server'George Udny Yule' @ 72.249.76.132


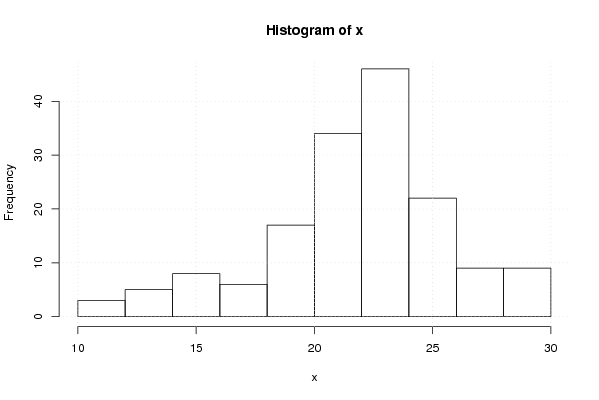
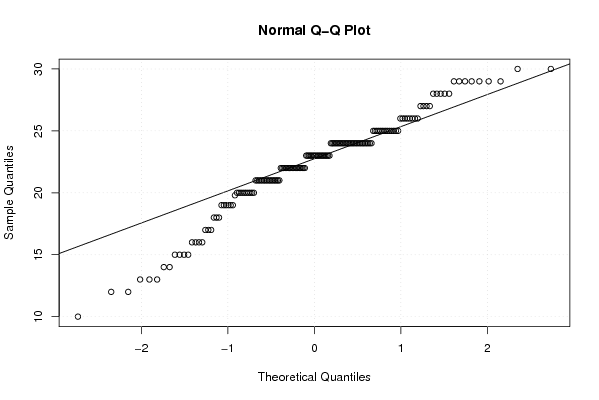
Descriptive Statistics
# observations159
minimum10
Q121
median23
mean22.3320754716981
Q324.5
maximum30

\begin{tabular}{lllllllll}
\hline
Descriptive Statistics \tabularnewline
# observations & 159 \tabularnewline
minimum & 10 \tabularnewline
Q1 & 21 \tabularnewline
median & 23 \tabularnewline
mean & 22.3320754716981 \tabularnewline
Q3 & 24.5 \tabularnewline
maximum & 30 \tabularnewline
\hline
\end{tabular}
%Source: https://freestatistics.org/blog/index.php?pk=99555&T=1

[TABLE]
[ROW][C]Descriptive Statistics[/C][/ROW]
[ROW][C]# observations[/C][C]159[/C][/ROW]
[ROW][C]minimum[/C][C]10[/C][/ROW]
[ROW][C]Q1[/C][C]21[/C][/ROW]
[ROW][C]median[/C][C]23[/C][/ROW]
[ROW][C]mean[/C][C]22.3320754716981[/C][/ROW]
[ROW][C]Q3[/C][C]24.5[/C][/ROW]
[ROW][C]maximum[/C][C]30[/C][/ROW]
[/TABLE]
Source: https://freestatistics.org/blog/index.php?pk=99555&T=1

Globally Unique Identifier (entire table): ba.freestatistics.org/blog/index.php?pk=99555&T=1

As an alternative you can also use a QR Code:  

The GUIDs for individual cells are displayed in the table below:

Descriptive Statistics
# observations159
minimum10
Q121
median23
mean22.3320754716981
Q324.5
maximum30


Parameters (Session):
par1 = 0 ; par2 = 0 ;
Parameters (R input):
par1 = 0 ; par2 = 0 ;
R code (references can be found in the software module):
par1 <- as.numeric(par1)
par2 <- as.numeric(par2)
x <- as.ts(x)
library(lattice)
bitmap(file='pic1.png')
plot(x,type='l',main='Run Sequence Plot',xlab='time or index',ylab='value')
grid()
dev.off()
bitmap(file='pic2.png')
hist(x)
grid()
dev.off()
bitmap(file='pic3.png')
if (par1 > 0)
{
densityplot(~x,col='black',main=paste('Density Plot bw = ',par1),bw=par1)
} else {
densityplot(~x,col='black',main='Density Plot')
}
dev.off()
bitmap(file='pic4.png')
qqnorm(x)
qqline(x)
grid()
dev.off()
if (par2 > 0)
{
bitmap(file='lagplot1.png')
dum <- cbind(lag(x,k=1),x)
dum
dum1 <- dum[2:length(x),]
dum1
z <- as.data.frame(dum1)
z
plot(z,main='Lag plot (k=1), lowess, and regression line')
lines(lowess(z))
abline(lm(z))
dev.off()
if (par2 > 1) {
bitmap(file='lagplotpar2.png')
dum <- cbind(lag(x,k=par2),x)
dum
dum1 <- dum[(par2+1):length(x),]
dum1
z <- as.data.frame(dum1)
z
mylagtitle <- 'Lag plot (k='
mylagtitle <- paste(mylagtitle,par2,sep='')
mylagtitle <- paste(mylagtitle,'), and lowess',sep='')
plot(z,main=mylagtitle)
lines(lowess(z))
dev.off()
}
bitmap(file='pic5.png')
acf(x,lag.max=par2,main='Autocorrelation Function')
grid()
dev.off()
}
summary(x)
load(file='createtable')
a<-table.start()
a<-table.row.start(a)
a<-table.element(a,'Descriptive Statistics',2,TRUE)
a<-table.row.end(a)
a<-table.row.start(a)
a<-table.element(a,'# observations',header=TRUE)
a<-table.element(a,length(x))
a<-table.row.end(a)
a<-table.row.start(a)
a<-table.element(a,'minimum',header=TRUE)
a<-table.element(a,min(x))
a<-table.row.end(a)
a<-table.row.start(a)
a<-table.element(a,'Q1',header=TRUE)
a<-table.element(a,quantile(x,0.25))
a<-table.row.end(a)
a<-table.row.start(a)
a<-table.element(a,'median',header=TRUE)
a<-table.element(a,median(x))
a<-table.row.end(a)
a<-table.row.start(a)
a<-table.element(a,'mean',header=TRUE)
a<-table.element(a,mean(x))
a<-table.row.end(a)
a<-table.row.start(a)
a<-table.element(a,'Q3',header=TRUE)
a<-table.element(a,quantile(x,0.75))
a<-table.row.end(a)
a<-table.row.start(a)
a<-table.element(a,'maximum',header=TRUE)
a<-table.element(a,max(x))
a<-table.row.end(a)
a<-table.end(a)
table.save(a,file='mytable.tab')