Free Statistics
of Irreproducible Research!
Description of Statistical Computation | |||||||||||||||||||||||||||||||||||||||||||||||||||||
|---|---|---|---|---|---|---|---|---|---|---|---|---|---|---|---|---|---|---|---|---|---|---|---|---|---|---|---|---|---|---|---|---|---|---|---|---|---|---|---|---|---|---|---|---|---|---|---|---|---|---|---|---|---|
| Author's title | |||||||||||||||||||||||||||||||||||||||||||||||||||||
| Author | *The author of this computation has been verified* | ||||||||||||||||||||||||||||||||||||||||||||||||||||
| R Software Module | rwasp_edauni.wasp | ||||||||||||||||||||||||||||||||||||||||||||||||||||
| Title produced by software | Univariate Explorative Data Analysis | ||||||||||||||||||||||||||||||||||||||||||||||||||||
| Date of computation | Mon, 22 Nov 2010 10:43:52 +0000 | ||||||||||||||||||||||||||||||||||||||||||||||||||||
| Cite this page as follows | Statistical Computations at FreeStatistics.org, Office for Research Development and Education, URL https://freestatistics.org/blog/index.php?v=date/2010/Nov/22/t1290422535184202phu50vacp.htm/, Retrieved Tue, 16 Sep 2025 02:29:35 +0000 | ||||||||||||||||||||||||||||||||||||||||||||||||||||
| Statistical Computations at FreeStatistics.org, Office for Research Development and Education, URL https://freestatistics.org/blog/index.php?pk=98440, Retrieved Tue, 16 Sep 2025 02:29:35 +0000 | |||||||||||||||||||||||||||||||||||||||||||||||||||||
| QR Codes: | |||||||||||||||||||||||||||||||||||||||||||||||||||||
|
| |||||||||||||||||||||||||||||||||||||||||||||||||||||
| Original text written by user: | |||||||||||||||||||||||||||||||||||||||||||||||||||||
| IsPrivate? | No (this computation is public) | ||||||||||||||||||||||||||||||||||||||||||||||||||||
| User-defined keywords | |||||||||||||||||||||||||||||||||||||||||||||||||||||
| Estimated Impact | 573 | ||||||||||||||||||||||||||||||||||||||||||||||||||||
Tree of Dependent Computations | |||||||||||||||||||||||||||||||||||||||||||||||||||||
| Family? (F = Feedback message, R = changed R code, M = changed R Module, P = changed Parameters, D = changed Data) | |||||||||||||||||||||||||||||||||||||||||||||||||||||
| - [Univariate Explorative Data Analysis] [time effect in su...] [2010-11-17 08:55:33] [b98453cac15ba1066b407e146608df68] - R D [Univariate Explorative Data Analysis] [WS7 Tutorial Popu...] [2010-11-22 10:43:52] [aa6b599ccd367bc74fed0d8f67004a46] [Current] - [Univariate Explorative Data Analysis] [WS7 Popularity - ...] [2010-11-23 10:09:29] [3fb95cad3bbcce10c72dbbcc5bec5662] - D [Univariate Explorative Data Analysis] [Mini tutorial - R...] [2010-12-02 14:04:27] [ed447cc2ebcc70947ad11d93fa385845] - R PD [Univariate Explorative Data Analysis] [Run seq plot] [2010-12-02 14:55:14] [e73e9643c012a54583c6a406017b2645] - P [Univariate Explorative Data Analysis] [run sequence plot] [2011-11-24 22:14:54] [1ed874da5cc4aa1cd1ced057f766d90b] - RMPD [Multiple Regression] [month - critism] [2010-12-02 15:26:48] [e73e9643c012a54583c6a406017b2645] - P [Multiple Regression] [month-critism] [2011-11-24 22:19:34] [1ed874da5cc4aa1cd1ced057f766d90b] - [Univariate Explorative Data Analysis] [WS 4: Run Sequenc...] [2010-12-02 17:30:51] [4f1a20f787b3465111b61213cdeef1a9] - D [Univariate Explorative Data Analysis] [WS 4: Run Sequenc...] [2010-12-07 17:08:05] [4f1a20f787b3465111b61213cdeef1a9] - D [Univariate Explorative Data Analysis] [WS 4: Run Sequenc...] [2010-12-07 20:08:54] [4f1a20f787b3465111b61213cdeef1a9] - D [Univariate Explorative Data Analysis] [WS 4: Run Sequenc...] [2010-12-07 21:00:08] [4f1a20f787b3465111b61213cdeef1a9] - R D [Univariate Explorative Data Analysis] [] [2010-12-02 18:53:36] [94f4aa1c01e87d8321fffb341ed4df07] - R [Univariate Explorative Data Analysis] [] [2011-11-25 00:50:01] [74be16979710d4c4e7c6647856088456] - R P [Univariate Explorative Data Analysis] [] [2011-11-27 17:08:27] [3931071255a6f7f4a767409781cc5f7d] - [Univariate Explorative Data Analysis] [] [2010-12-02 18:58:52] [f47feae0308dca73181bb669fbad1c56] - RM [Univariate Explorative Data Analysis] [] [2012-11-20 16:55:29] [74be16979710d4c4e7c6647856088456] - RM [Univariate Explorative Data Analysis] [Workshop 7 (2)] [2012-11-20 19:43:07] [318be0e97d03618d227a3f8f0242bca0] - RM [Univariate Explorative Data Analysis] [Workshop 7] [2012-11-20 19:49:36] [783d8509970888a6ec44a5a7a0d2a339] - D [Univariate Explorative Data Analysis] [run sequence plot] [2010-12-02 19:49:03] [9f0fea5f96e3630b8f903250153d0968] - D [Univariate Explorative Data Analysis] [Workshop 7 multip...] [2010-12-03 09:01:45] [82c18f3ebe9df70882495121eb816e07] - R PD [Univariate Explorative Data Analysis] [] [2010-12-03 12:38:37] [253127ae8da904b75450fbd69fe4eb21] - [Univariate Explorative Data Analysis] [minitutorial ws 4] [2010-12-03 15:20:46] [e4afca2801c0b93eac84a600ed82fb9c] - R PD [Univariate Explorative Data Analysis] [] [2010-12-03 16:08:11] [0852eab68d1303a703ef0070d6dbcb87] - D [Univariate Explorative Data Analysis] [Tutorial2] [2010-12-03 20:06:37] [a7c91bc614e4e21e8b9c8593f39a36f1] - D [Univariate Explorative Data Analysis] [] [2010-12-28 11:21:26] [11b6443b23f19c2dbda3ee0ee9d024b2] - RMPD [Multiple Regression] [] [2010-12-28 11:30:45] [11b6443b23f19c2dbda3ee0ee9d024b2] - RMPD [Multiple Regression] [] [2010-12-28 12:27:13] [11b6443b23f19c2dbda3ee0ee9d024b2] - R D [Univariate Explorative Data Analysis] [WS 7 Mini-tutoria...] [2011-11-20 15:19:52] [f5fdea4413921432bb019d1f20c4f2ec] - R D [Univariate Explorative Data Analysis] [ws7-2] [2011-11-22 16:55:47] [74be16979710d4c4e7c6647856088456] - D [Univariate Explorative Data Analysis] [paper2-2] [2011-12-21 18:45:26] [f7a862281046b7153543b12c78921b36] - RM [Univariate Explorative Data Analysis] [WS 7 -2 ] [2011-11-22 21:45:19] [74be16979710d4c4e7c6647856088456] - R D [Univariate Explorative Data Analysis] [Run sequence plot...] [2011-12-19 16:00:44] [74be16979710d4c4e7c6647856088456] - R [Univariate Explorative Data Analysis] [] [2012-11-20 03:55:27] [74be16979710d4c4e7c6647856088456] - R D [Univariate Explorative Data Analysis] [] [2012-11-20 17:36:04] [ed1fdf85d7cd4cf9cd22a44dec7a2ab7] - R [Univariate Explorative Data Analysis] [MLR II] [2012-12-16 13:22:28] [9f6ab6bc6461b94fa20254844eaa346d] | |||||||||||||||||||||||||||||||||||||||||||||||||||||
| Feedback Forum | |||||||||||||||||||||||||||||||||||||||||||||||||||||
Post a new message | |||||||||||||||||||||||||||||||||||||||||||||||||||||
Dataset | |||||||||||||||||||||||||||||||||||||||||||||||||||||
| Dataseries X: | |||||||||||||||||||||||||||||||||||||||||||||||||||||
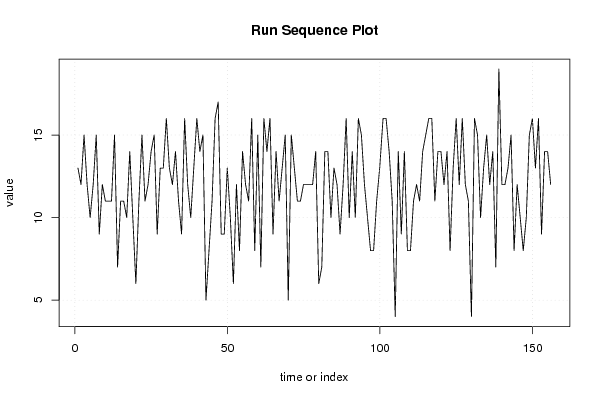
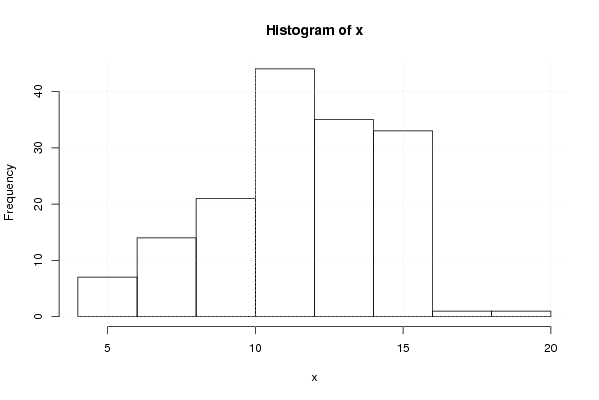
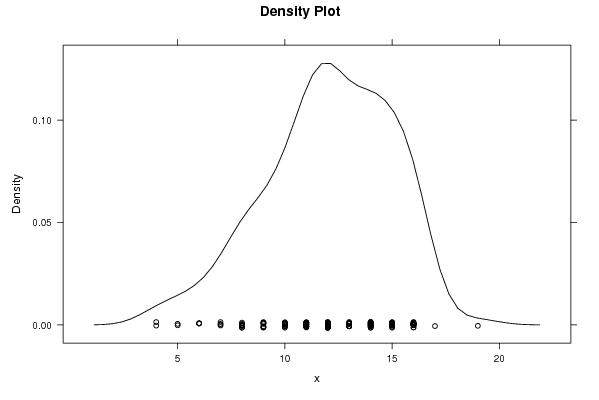
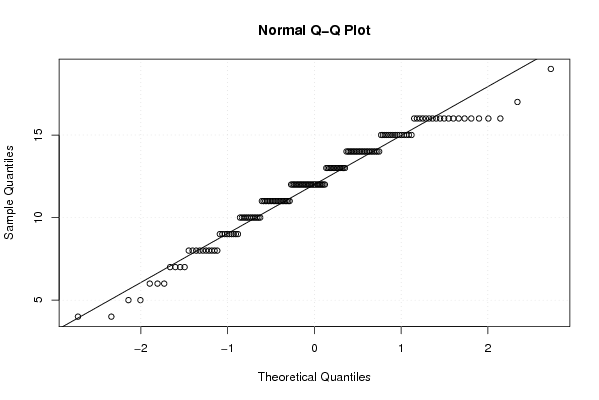
13 12 15 12 10 12 15 9 12 11 11 11 15 7 11 11 10 14 10 6 11 15 11 12 14 15 9 13 13 16 13 12 14 11 9 16 12 10 13 16 14 15 5 8 11 16 17 9 9 13 10 6 12 8 14 12 11 16 8 15 7 16 14 16 9 14 11 13 15 5 15 13 11 11 12 12 12 12 14 6 7 14 14 10 13 12 9 12 16 10 14 10 16 15 12 10 8 8 11 13 16 16 14 11 4 14 9 14 8 8 11 12 11 14 15 16 16 11 14 14 12 14 8 13 16 12 16 12 11 4 16 15 10 13 15 12 14 7 19 12 12 13 15 8 12 10 8 10 15 16 13 16 9 14 14 12 | |||||||||||||||||||||||||||||||||||||||||||||||||||||
Tables (Output of Computation) | |||||||||||||||||||||||||||||||||||||||||||||||||||||
| |||||||||||||||||||||||||||||||||||||||||||||||||||||
Figures (Output of Computation) | |||||||||||||||||||||||||||||||||||||||||||||||||||||
Input Parameters & R Code | |||||||||||||||||||||||||||||||||||||||||||||||||||||
| Parameters (Session): | |||||||||||||||||||||||||||||||||||||||||||||||||||||
| par1 = 0 ; par2 = 36 ; | |||||||||||||||||||||||||||||||||||||||||||||||||||||
| Parameters (R input): | |||||||||||||||||||||||||||||||||||||||||||||||||||||
| par1 = 0 ; par2 = 36 ; | |||||||||||||||||||||||||||||||||||||||||||||||||||||
| R code (references can be found in the software module): | |||||||||||||||||||||||||||||||||||||||||||||||||||||
par1 <- as.numeric(par1) | |||||||||||||||||||||||||||||||||||||||||||||||||||||