Free Statistics
of Irreproducible Research!
Description of Statistical Computation | |||||||||||||||||||||||||||||||||||||||||
|---|---|---|---|---|---|---|---|---|---|---|---|---|---|---|---|---|---|---|---|---|---|---|---|---|---|---|---|---|---|---|---|---|---|---|---|---|---|---|---|---|---|
| Author's title | |||||||||||||||||||||||||||||||||||||||||
| Author | *The author of this computation has been verified* | ||||||||||||||||||||||||||||||||||||||||
| R Software Module | rwasp_univariatedataseries.wasp | ||||||||||||||||||||||||||||||||||||||||
| Title produced by software | Univariate Data Series | ||||||||||||||||||||||||||||||||||||||||
| Date of computation | Tue, 16 Nov 2010 10:34:10 +0000 | ||||||||||||||||||||||||||||||||||||||||
| Cite this page as follows | Statistical Computations at FreeStatistics.org, Office for Research Development and Education, URL https://freestatistics.org/blog/index.php?v=date/2010/Nov/16/t1289903555yo2tl4k2uvt6p55.htm/, Retrieved Wed, 27 May 2026 01:38:27 +0000 | ||||||||||||||||||||||||||||||||||||||||
| Statistical Computations at FreeStatistics.org, Office for Research Development and Education, URL https://freestatistics.org/blog/index.php?pk=95355, Retrieved Wed, 27 May 2026 01:38:27 +0000 | |||||||||||||||||||||||||||||||||||||||||
| QR Codes: | |||||||||||||||||||||||||||||||||||||||||
|
| |||||||||||||||||||||||||||||||||||||||||
| Original text written by user: | |||||||||||||||||||||||||||||||||||||||||
| IsPrivate? | No (this computation is public) | ||||||||||||||||||||||||||||||||||||||||
| User-defined keywords | |||||||||||||||||||||||||||||||||||||||||
| Estimated Impact | 448 | ||||||||||||||||||||||||||||||||||||||||
Tree of Dependent Computations | |||||||||||||||||||||||||||||||||||||||||
| Family? (F = Feedback message, R = changed R code, M = changed R Module, P = changed Parameters, D = changed Data) | |||||||||||||||||||||||||||||||||||||||||
| - [Univariate Data Series] [Arabica Price in ...] [2008-01-05 23:14:31] [74be16979710d4c4e7c6647856088456] - RMPD [Univariate Data Series] [US Car sales] [2010-11-06 12:59:49] [97ad38b1c3b35a5feca8b85f7bc7b3ff] - RMPD [] [consumption expen...] [-0001-11-30 00:00:00] [9f32078fdcdc094ca748857d5ebdb3de] - RMPD [Univariate Data Series] [] [2010-11-16 10:34:10] [6ff6d3268c67efbfcd6d6506b34b66fb] [Current] | |||||||||||||||||||||||||||||||||||||||||
| Feedback Forum | |||||||||||||||||||||||||||||||||||||||||
Post a new message | |||||||||||||||||||||||||||||||||||||||||
Dataset | |||||||||||||||||||||||||||||||||||||||||
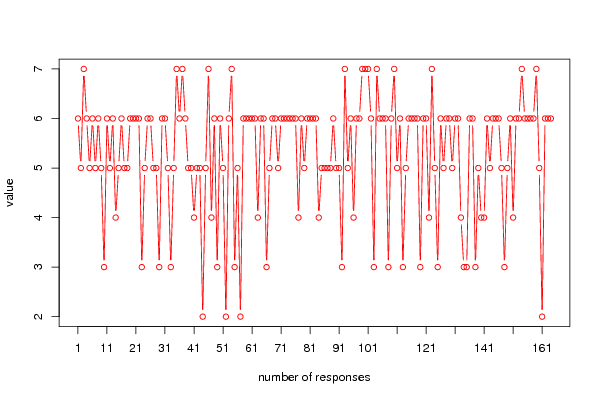
| Dataseries X: | |||||||||||||||||||||||||||||||||||||||||
6 5 7 6 5 6 5 6 5 3 6 5 6 4 5 6 5 5 6 6 6 6 3 5 6 6 5 5 3 6 6 5 3 5 7 6 7 6 5 5 4 5 5 2 5 7 4 6 3 6 5 2 6 7 3 5 2 6 6 6 6 6 4 6 6 3 5 6 6 5 6 6 6 6 6 6 4 6 5 6 6 6 6 4 5 5 5 5 6 5 5 3 7 5 6 4 6 6 7 7 7 6 3 7 6 6 6 3 6 7 5 6 3 5 6 6 6 6 3 6 6 4 7 5 3 6 5 6 6 5 6 6 4 3 3 6 6 3 5 4 4 6 5 6 6 6 5 3 5 6 4 6 6 7 6 6 6 6 7 5 2 6 6 6 | |||||||||||||||||||||||||||||||||||||||||
Tables (Output of Computation) | |||||||||||||||||||||||||||||||||||||||||
| |||||||||||||||||||||||||||||||||||||||||
Figures (Output of Computation) | |||||||||||||||||||||||||||||||||||||||||
Input Parameters & R Code | |||||||||||||||||||||||||||||||||||||||||
| Parameters (Session): | |||||||||||||||||||||||||||||||||||||||||
| par1 = When talking to others I keep eye contact ; par4 = No season ; | |||||||||||||||||||||||||||||||||||||||||
| Parameters (R input): | |||||||||||||||||||||||||||||||||||||||||
| par1 = When talking to others I keep eye contact ; par2 = ; par3 = ; par4 = No season ; | |||||||||||||||||||||||||||||||||||||||||
| R code (references can be found in the software module): | |||||||||||||||||||||||||||||||||||||||||
if (par4 != 'No season') { | |||||||||||||||||||||||||||||||||||||||||