Simple Linear Regression Mini Tutorial | ||||||||||||||||||||||||||||||
| *The author of this computation has been verified* | ||||||||||||||||||||||||||||||
| R Software Module: /rwasp_linear_regression.wasp (opens new window with default values) | ||||||||||||||||||||||||||||||
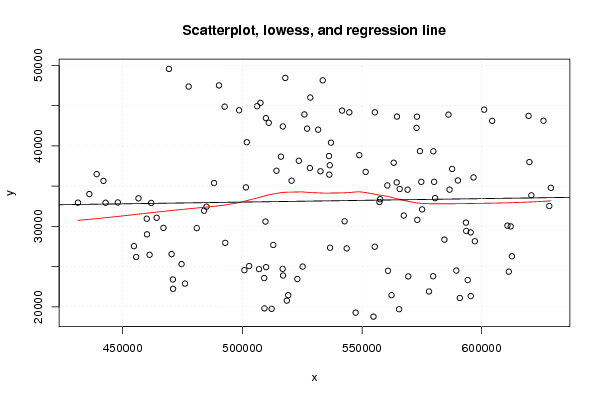
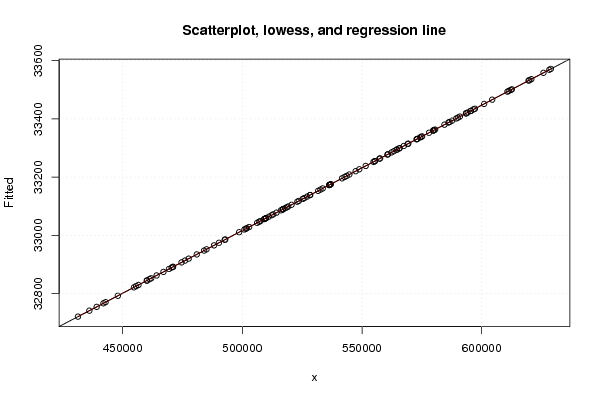
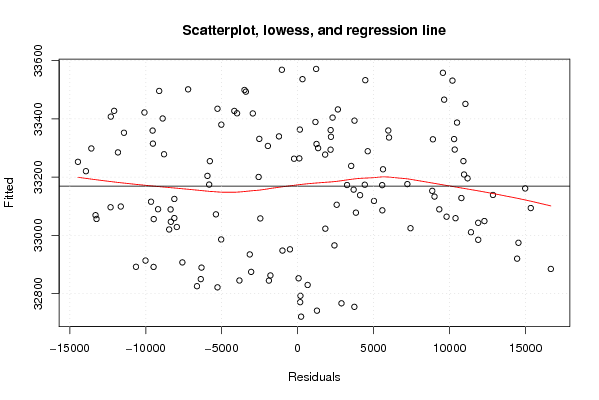
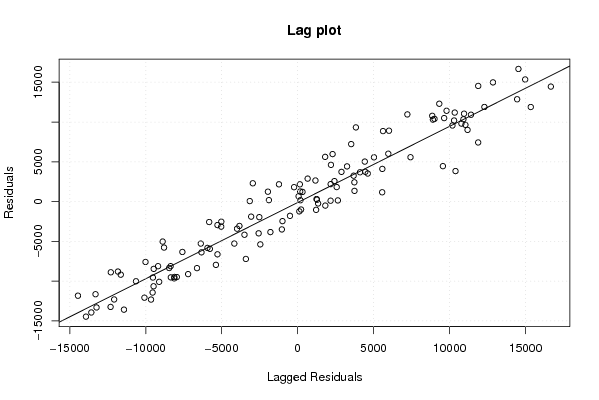
| Title produced by software: Linear Regression Graphical Model Validation | ||||||||||||||||||||||||||||||
| Date of computation: Fri, 12 Nov 2010 11:48:01 +0000 | ||||||||||||||||||||||||||||||
| Cite this page as follows: | ||||||||||||||||||||||||||||||
| Statistical Computations at FreeStatistics.org, Office for Research Development and Education, URL http://www.freestatistics.org/blog/date/2010/Nov/12/t1289562463nqz9i8mrhcb5dd2.htm/, Retrieved Fri, 12 Nov 2010 12:47:46 +0100 | ||||||||||||||||||||||||||||||
| BibTeX entries for LaTeX users: | ||||||||||||||||||||||||||||||
@Manual{KEY,
    author = {{YOUR NAME}},
    publisher = {Office for Research Development and Education},
    title = {Statistical Computations at FreeStatistics.org, URL http://www.freestatistics.org/blog/date/2010/Nov/12/t1289562463nqz9i8mrhcb5dd2.htm/},
    year = {2010},
}
@Manual{R,
    title = {R: A Language and Environment for Statistical Computing},
    author = {{R Development Core Team}},
    organization = {R Foundation for Statistical Computing},
    address = {Vienna, Austria},
    year = {2010},
    note = {{ISBN} 3-900051-07-0},
    url = {http://www.R-project.org},
}
| ||||||||||||||||||||||||||||||
| Original text written by user: | ||||||||||||||||||||||||||||||
| IsPrivate? | ||||||||||||||||||||||||||||||
| No (this computation is public) | ||||||||||||||||||||||||||||||
| User-defined keywords: | ||||||||||||||||||||||||||||||
| Dataseries X: | ||||||||||||||||||||||||||||||
| » Textbox « » Textfile « » CSV « | ||||||||||||||||||||||||||||||
| 586111 604378 600991 544686 537034 551531 563250 574761 580112 575093 557560 564478 580523 596594 586570 536214 523597 536535 536322 532638 528222 516141 501866 506174 517945 533590 528379 477580 469357 490243 492622 507561 516922 514258 509846 527070 541657 564591 555362 498662 511038 525919 531673 548854 560576 557274 565742 587625 619916 625809 619567 572942 572775 574205 579799 590072 593408 597141 595404 612117 628232 628884 620735 569028 567456 573100 584428 589379 590865 595454 594167 611324 612613 610763 593530 542722 536662 543599 555332 560854 562325 554788 547344 565464 577992 579714 569323 506971 500857 509127 509933 517009 519164 512238 509239 518585 522975 525192 516847 455626 454724 461251 470439 474605 476049 471067 470984 502831 512927 509673 484015 431328 436087 442867 447988 460070 467037 460170 464196 485025 501492 520564 488180 439148 441977 456608 461935 480961 etc... | ||||||||||||||||||||||||||||||
| Dataseries Y: | ||||||||||||||||||||||||||||||
| » Textbox « » Textfile « » CSV « | ||||||||||||||||||||||||||||||
| 43880 43110 44496 44164 40399 36763 37903 35532 35533 32110 33374 35462 33508 36080 34560 38737 38144 37594 36424 36843 37246 38661 40454 44928 48441 48140 45998 47369 49554 47510 44873 45344 42413 36912 43452 42142 44382 43636 44167 44423 42868 43908 42013 38846 35087 33026 34646 37135 37985 43121 43722 43630 42234 39351 39327 35704 30466 28155 29257 29998 32529 34787 33855 34556 31348 30805 28353 24514 21106 21346 23335 24379 26290 30084 29429 30632 27349 27264 27474 24482 21453 18788 19282 19713 21917 23812 23785 24696 24562 23580 24939 23899 21454 19761 19815 20780 23462 25005 24725 26198 27543 26471 26558 25317 22896 22248 23406 25073 27691 30599 31948 32946 34012 32936 32974 30951 29812 29010 31068 32447 34844 35676 35387 36488 35652 33488 32914 29781 27951 | ||||||||||||||||||||||||||||||
| Output produced by software: | ||||||||||||||||||||||||||||||
| ||||||||||||||||||||||||||||||
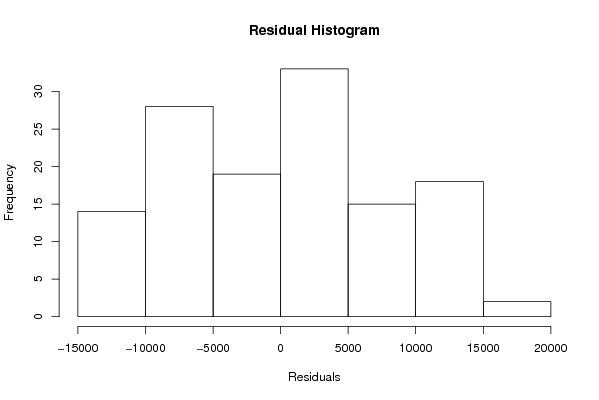
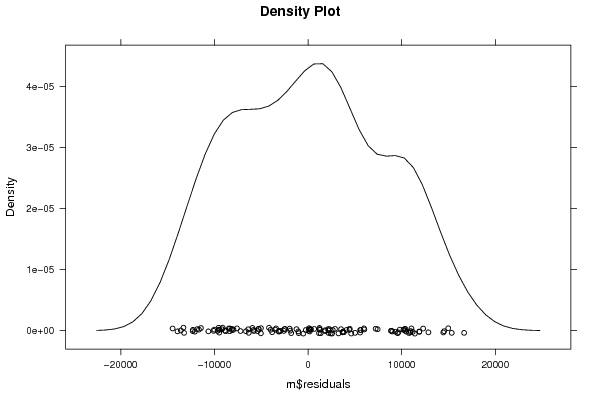
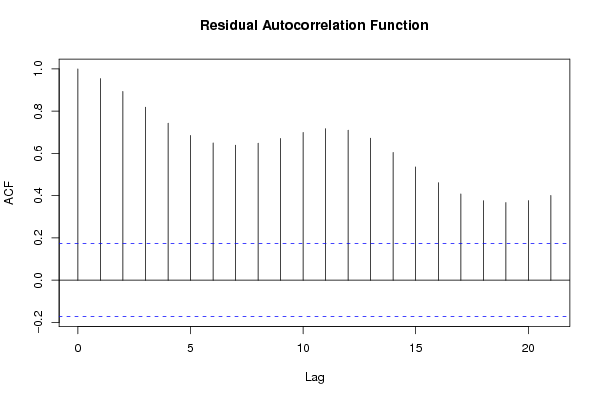
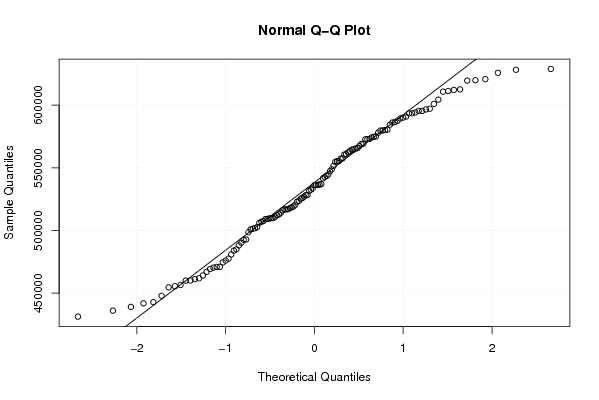
| Charts produced by software: | ||||||||||||||||||||||||||||||
| ||||||||||||||||||||||||||||||
| Parameters (Session): | ||||||||||||||||||||||||||||||
| par1 = 0 ; | ||||||||||||||||||||||||||||||
| Parameters (R input): | ||||||||||||||||||||||||||||||
| par1 = 0 ; | ||||||||||||||||||||||||||||||
| R code (references can be found in the software module): | ||||||||||||||||||||||||||||||
| par1 <- as.numeric(par1)
library(lattice) z <- as.data.frame(cbind(x,y)) m <- lm(y~x) summary(m) bitmap(file='test1.png') plot(z,main='Scatterplot, lowess, and regression line') lines(lowess(z),col='red') abline(m) grid() dev.off() bitmap(file='test2.png') m2 <- lm(m$fitted.values ~ x) summary(m2) z2 <- as.data.frame(cbind(x,m$fitted.values)) names(z2) <- list('x','Fitted') plot(z2,main='Scatterplot, lowess, and regression line') lines(lowess(z2),col='red') abline(m2) grid() dev.off() bitmap(file='test3.png') m3 <- lm(m$residuals ~ x) summary(m3) z3 <- as.data.frame(cbind(x,m$residuals)) names(z3) <- list('x','Residuals') plot(z3,main='Scatterplot, lowess, and regression line') lines(lowess(z3),col='red') abline(m3) grid() dev.off() bitmap(file='test4.png') m4 <- lm(m$fitted.values ~ m$residuals) summary(m4) z4 <- as.data.frame(cbind(m$residuals,m$fitted.values)) names(z4) <- list('Residuals','Fitted') plot(z4,main='Scatterplot, lowess, and regression line') lines(lowess(z4),col='red') abline(m4) grid() dev.off() bitmap(file='test5.png') myr <- as.ts(m$residuals) z5 <- as.data.frame(cbind(lag(myr,1),myr)) names(z5) <- list('Lagged Residuals','Residuals') plot(z5,main='Lag plot') m5 <- lm(z5) summary(m5) abline(m5) grid() dev.off() bitmap(file='test6.png') hist(m$residuals,main='Residual Histogram',xlab='Residuals') dev.off() bitmap(file='test7.png') if (par1 > 0) { densityplot(~m$residuals,col='black',main=paste('Density Plot bw = ',par1),bw=par1) } else { densityplot(~m$residuals,col='black',main='Density Plot') } dev.off() bitmap(file='test8.png') acf(m$residuals,main='Residual Autocorrelation Function') dev.off() bitmap(file='test9.png') qqnorm(x) qqline(x) grid() dev.off() load(file='createtable') a<-table.start() a<-table.row.start(a) a<-table.element(a,'Simple Linear Regression',5,TRUE) a<-table.row.end(a) a<-table.row.start(a) a<-table.element(a,'Statistics',1,TRUE) a<-table.element(a,'Estimate',1,TRUE) a<-table.element(a,'S.D.',1,TRUE) a<-table.element(a,'T-STAT (H0: coeff=0)',1,TRUE) a<-table.element(a,'P-value (two-sided)',1,TRUE) a<-table.row.end(a) a<-table.row.start(a) a<-table.element(a,'constant term',header=TRUE) a<-table.element(a,m$coefficients[[1]]) sd <- sqrt(vcov(m)[1,1]) a<-table.element(a,sd) tstat <- m$coefficients[[1]]/sd a<-table.element(a,tstat) pval <- 2*(1-pt(abs(tstat),length(x)-2)) a<-table.element(a,pval) a<-table.row.end(a) a<-table.row.start(a) a<-table.element(a,'slope',header=TRUE) a<-table.element(a,m$coefficients[[2]]) sd <- sqrt(vcov(m)[2,2]) a<-table.element(a,sd) tstat <- m$coefficients[[2]]/sd a<-table.element(a,tstat) pval <- 2*(1-pt(abs(tstat),length(x)-2)) a<-table.element(a,pval) a<-table.row.end(a) a<-table.end(a) table.save(a,file='mytable.tab') | ||||||||||||||||||||||||||||||

Copyright

This work is licensed under a
Creative Commons Attribution-Noncommercial-Share Alike 3.0 License.
Software written by Ed van Stee & Patrick Wessa
Disclaimer
Information provided on this web site is provided "AS IS" without warranty of any kind, either express or implied, including, without limitation, warranties of merchantability, fitness for a particular purpose, and noninfringement. We use reasonable efforts to include accurate and timely information and periodically update the information, and software without notice. However, we make no warranties or representations as to the accuracy or completeness of such information (or software), and we assume no liability or responsibility for errors or omissions in the content of this web site, or any software bugs in online applications. Your use of this web site is AT YOUR OWN RISK. Under no circumstances and under no legal theory shall we be liable to you or any other person for any direct, indirect, special, incidental, exemplary, or consequential damages arising from your access to, or use of, this web site.
Privacy Policy
We may request personal information to be submitted to our servers in order to be able to:
- personalize online software applications according to your needs
- enforce strict security rules with respect to the data that you upload (e.g. statistical data)
- manage user sessions of online applications
- alert you about important changes or upgrades in resources or applications
We NEVER allow other companies to directly offer registered users information about their products and services. Banner references and hyperlinks of third parties NEVER contain any personal data of the visitor.
We do NOT sell, nor transmit by any means, personal information, nor statistical data series uploaded by you to third parties.
We carefully protect your data from loss, misuse, alteration,
and destruction. However, at any time, and under any circumstance you
are solely responsible for managing your passwords, and keeping them
secret.
We store a unique ANONYMOUS USER ID in the form of a small 'Cookie' on your computer. This allows us to track your progress when using this website which is necessary to create state-dependent features. The cookie is used for NO OTHER PURPOSE. At any time you may opt to disallow cookies from this website - this will not affect other features of this website.
We examine cookies that are used by third-parties (banner and online ads) very closely: abuse from third-parties automatically results in termination of the advertising contract without refund. We have very good reason to believe that the cookies that are produced by third parties (banner ads) do NOT cause any privacy or security risk.
FreeStatistics.org is safe. There is no need to download any software to use the applications and services contained in this website. Hence, your system's security is not compromised by their use, and your personal data - other than data you submit in the account application form, and the user-agent information that is transmitted by your browser - is never transmitted to our servers.
As a general rule, we do not log on-line behavior of individuals (other than normal logging of webserver 'hits'). However, in cases of abuse, hacking, unauthorized access, Denial of Service attacks, illegal copying, hotlinking, non-compliance with international webstandards (such as robots.txt), or any other harmful behavior, our system engineers are empowered to log, track, identify, publish, and ban misbehaving individuals - even if this leads to ban entire blocks of IP addresses, or disclosing user's identity.