workshop 6 mini-tutorial | ||||||||||||||||||||||||||||||
| *The author of this computation has been verified* | ||||||||||||||||||||||||||||||
| R Software Module: /rwasp_linear_regression.wasp (opens new window with default values) | ||||||||||||||||||||||||||||||
| Title produced by software: Linear Regression Graphical Model Validation | ||||||||||||||||||||||||||||||
| Date of computation: Fri, 12 Nov 2010 09:53:46 +0000 | ||||||||||||||||||||||||||||||
| Cite this page as follows: | ||||||||||||||||||||||||||||||
| Statistical Computations at FreeStatistics.org, Office for Research Development and Education, URL http://www.freestatistics.org/blog/date/2010/Nov/12/t1289555744hhfienwyd8s8t12.htm/, Retrieved Fri, 12 Nov 2010 10:55:46 +0100 | ||||||||||||||||||||||||||||||
| BibTeX entries for LaTeX users: | ||||||||||||||||||||||||||||||
@Manual{KEY,
    author = {{YOUR NAME}},
    publisher = {Office for Research Development and Education},
    title = {Statistical Computations at FreeStatistics.org, URL http://www.freestatistics.org/blog/date/2010/Nov/12/t1289555744hhfienwyd8s8t12.htm/},
    year = {2010},
}
@Manual{R,
    title = {R: A Language and Environment for Statistical Computing},
    author = {{R Development Core Team}},
    organization = {R Foundation for Statistical Computing},
    address = {Vienna, Austria},
    year = {2010},
    note = {{ISBN} 3-900051-07-0},
    url = {http://www.R-project.org},
}
| ||||||||||||||||||||||||||||||
| Original text written by user: | ||||||||||||||||||||||||||||||
| IsPrivate? | ||||||||||||||||||||||||||||||
| No (this computation is public) | ||||||||||||||||||||||||||||||
| User-defined keywords: | ||||||||||||||||||||||||||||||
| Dataseries X: | ||||||||||||||||||||||||||||||
| » Textbox « » Textfile « » CSV « | ||||||||||||||||||||||||||||||
| 26,012 21,288 28,576 18,023 23,666 51,887 16,642 24,505 6,886 21,614 17,972 20,514 31,325 19,459 35,75 15,787 45,21 27,778 21,489 27,393 28,944 16,318 4,148 27,405 20,413 43,35 19,125 25,031 23,804 20,327 12,455 30,598 6,343 21,453 50,435 14,647 78,187 36,639 69,935 40,63 4,437 14,942 20,483 36,377 28,392 54,545 15,787 20,22 23,05 32,141 218,987 29,965 28,942 51,018 21,637 27,026 24,258 29,872 21,59 40,5 22,056 72,165 14,026 22,125 26,845 22,834 20,719 12,301 343,037 33,655 65,078 60,501 73,215 45,577 150,834 23,14 41,579 17,954 43,676 37,572 12,208 18,504 26,145 13,791 42,453 26,099 33,494 32,651 28,751 20,218 18,734 67,125 27,585 12,143 324,724 17,253 19,001 25,298 23,449 30,245 91,059 48,154 17,748 10,045 12,871 23,727 12,821 6,684 23,341 60,505 123,69 8,687 27,213 27,718 36,96 6,113 14,345 33,53 46,639 19,807 44,131 34,465 12,509 15,263 2,974 12,85 14,459 9,605 30,422 29,966 48 etc... | ||||||||||||||||||||||||||||||
| Dataseries Y: | ||||||||||||||||||||||||||||||
| » Textbox « » Textfile « » CSV « | ||||||||||||||||||||||||||||||
| 162,961 143,843 330,045 185,511 408,589 202,001 127,147 111,288 152,99 153,358 200,304 148,122 201,677 224,896 171,75 204,718 238,903 157,166 212,108 83,178 407,225 126,735 348,082 148,947 182,881 256,367 152,64 171,875 185,806 168,03 152,631 359,107 211,763 177,074 189,696 170,66 272,506 305,783 253,422 207,372 173,177 150,88 129,589 281,863 169,353 232,379 237,947 116,108 264,094 134,779 502,513 196,733 139,64 197,299 150,072 192,42 196,311 254,363 501,749 264,359 200,927 255,593 165,519 108,677 223,899 117,261 163,407 100,313 542,167 253,128 231,782 179,355 246,221 296,323 386,414 173,679 219,625 491,827 219,237 204,517 358,472 49,678 320,58 364,879 202,591 193,035 190,105 413,4 227,963 228,062 142,047 280,549 280,57 87,968 681,944 157,17 189,206 184,88 143,002 210,046 690,992 208,427 168,628 170,154 163,336 146,779 397,704 59,616 202,325 255,614 389,883 130,712 253,638 253,327 431,801 185,353 etc... | ||||||||||||||||||||||||||||||
| Output produced by software: | ||||||||||||||||||||||||||||||
| ||||||||||||||||||||||||||||||
| Charts produced by software: | ||||||||||||||||||||||||||||||
| ||||||||||||||||||||||||||||||
| Parameters (Session): | ||||||||||||||||||||||||||||||
| par1 = 0 ; | ||||||||||||||||||||||||||||||
| Parameters (R input): | ||||||||||||||||||||||||||||||
| par1 = 0 ; | ||||||||||||||||||||||||||||||
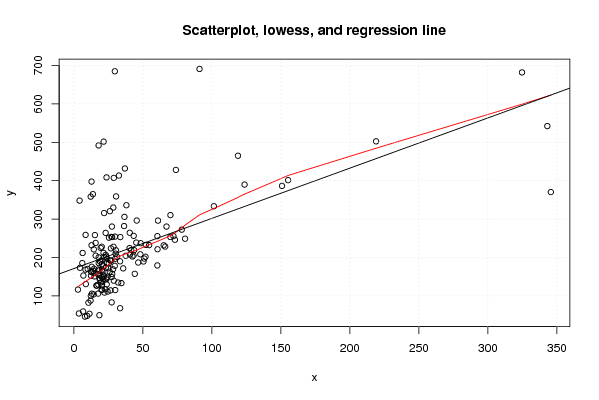
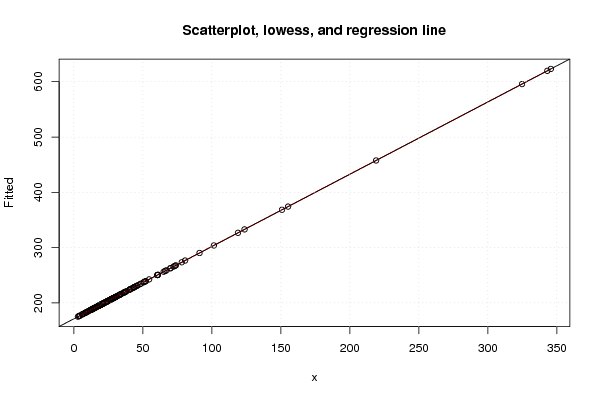
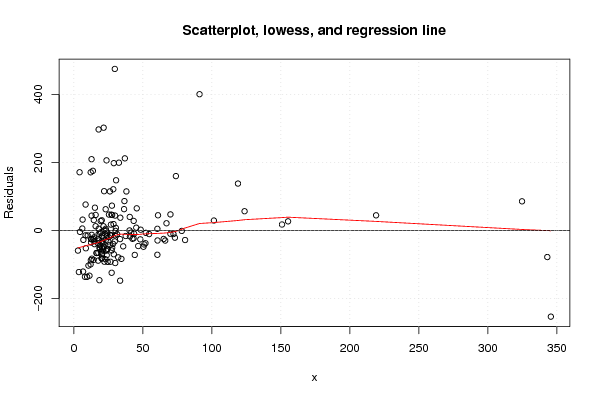
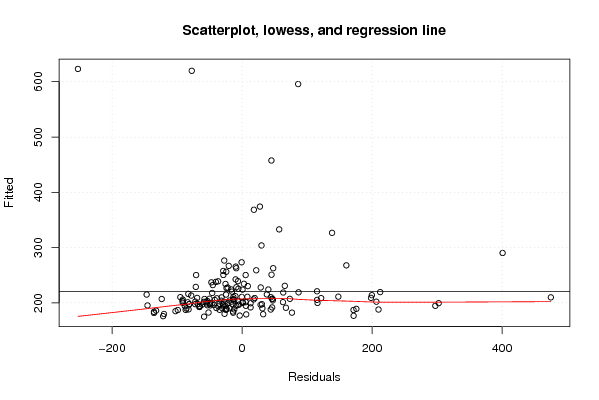
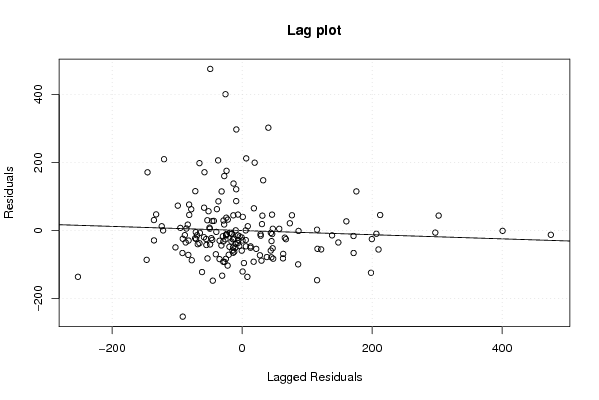
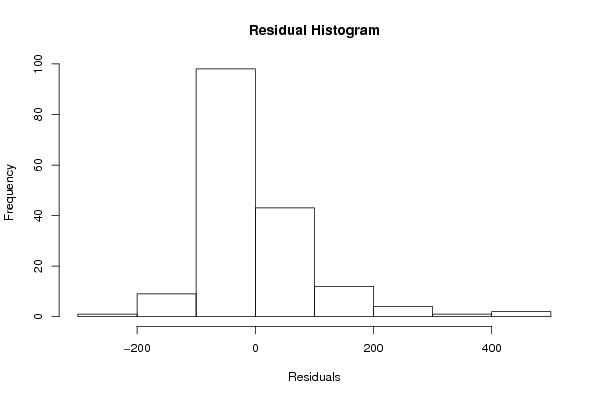
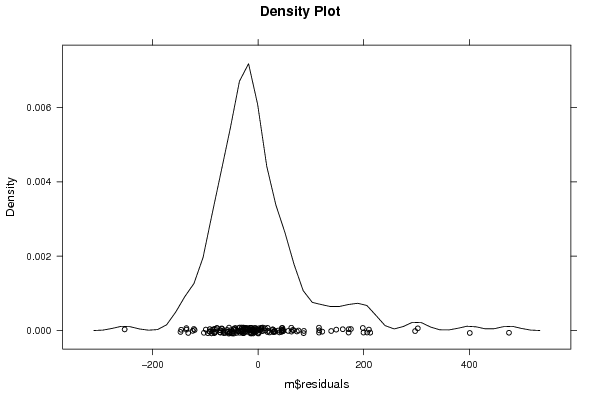
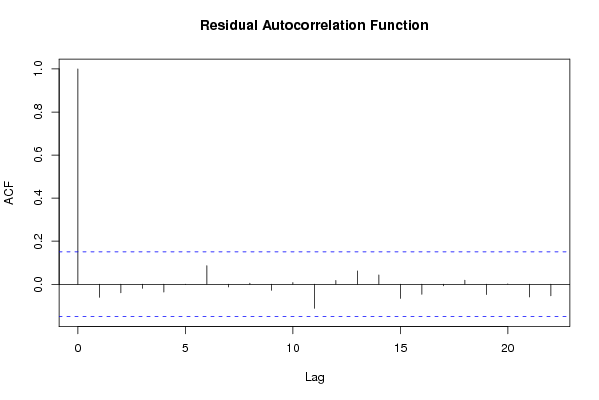
| R code (references can be found in the software module): | ||||||||||||||||||||||||||||||
| par1 <- as.numeric(par1)
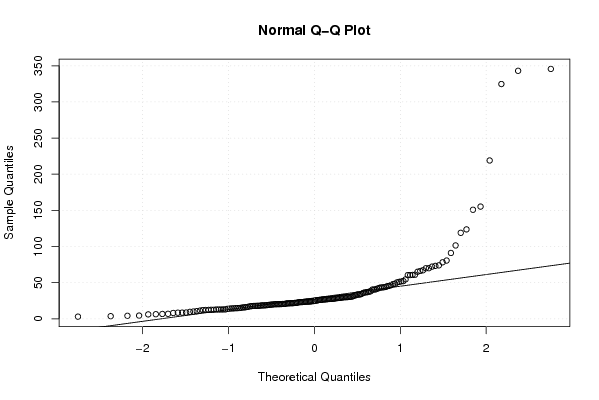
library(lattice) z <- as.data.frame(cbind(x,y)) m <- lm(y~x) summary(m) bitmap(file='test1.png') plot(z,main='Scatterplot, lowess, and regression line') lines(lowess(z),col='red') abline(m) grid() dev.off() bitmap(file='test2.png') m2 <- lm(m$fitted.values ~ x) summary(m2) z2 <- as.data.frame(cbind(x,m$fitted.values)) names(z2) <- list('x','Fitted') plot(z2,main='Scatterplot, lowess, and regression line') lines(lowess(z2),col='red') abline(m2) grid() dev.off() bitmap(file='test3.png') m3 <- lm(m$residuals ~ x) summary(m3) z3 <- as.data.frame(cbind(x,m$residuals)) names(z3) <- list('x','Residuals') plot(z3,main='Scatterplot, lowess, and regression line') lines(lowess(z3),col='red') abline(m3) grid() dev.off() bitmap(file='test4.png') m4 <- lm(m$fitted.values ~ m$residuals) summary(m4) z4 <- as.data.frame(cbind(m$residuals,m$fitted.values)) names(z4) <- list('Residuals','Fitted') plot(z4,main='Scatterplot, lowess, and regression line') lines(lowess(z4),col='red') abline(m4) grid() dev.off() bitmap(file='test5.png') myr <- as.ts(m$residuals) z5 <- as.data.frame(cbind(lag(myr,1),myr)) names(z5) <- list('Lagged Residuals','Residuals') plot(z5,main='Lag plot') m5 <- lm(z5) summary(m5) abline(m5) grid() dev.off() bitmap(file='test6.png') hist(m$residuals,main='Residual Histogram',xlab='Residuals') dev.off() bitmap(file='test7.png') if (par1 > 0) { densityplot(~m$residuals,col='black',main=paste('Density Plot bw = ',par1),bw=par1) } else { densityplot(~m$residuals,col='black',main='Density Plot') } dev.off() bitmap(file='test8.png') acf(m$residuals,main='Residual Autocorrelation Function') dev.off() bitmap(file='test9.png') qqnorm(x) qqline(x) grid() dev.off() load(file='createtable') a<-table.start() a<-table.row.start(a) a<-table.element(a,'Simple Linear Regression',5,TRUE) a<-table.row.end(a) a<-table.row.start(a) a<-table.element(a,'Statistics',1,TRUE) a<-table.element(a,'Estimate',1,TRUE) a<-table.element(a,'S.D.',1,TRUE) a<-table.element(a,'T-STAT (H0: coeff=0)',1,TRUE) a<-table.element(a,'P-value (two-sided)',1,TRUE) a<-table.row.end(a) a<-table.row.start(a) a<-table.element(a,'constant term',header=TRUE) a<-table.element(a,m$coefficients[[1]]) sd <- sqrt(vcov(m)[1,1]) a<-table.element(a,sd) tstat <- m$coefficients[[1]]/sd a<-table.element(a,tstat) pval <- 2*(1-pt(abs(tstat),length(x)-2)) a<-table.element(a,pval) a<-table.row.end(a) a<-table.row.start(a) a<-table.element(a,'slope',header=TRUE) a<-table.element(a,m$coefficients[[2]]) sd <- sqrt(vcov(m)[2,2]) a<-table.element(a,sd) tstat <- m$coefficients[[2]]/sd a<-table.element(a,tstat) pval <- 2*(1-pt(abs(tstat),length(x)-2)) a<-table.element(a,pval) a<-table.row.end(a) a<-table.end(a) table.save(a,file='mytable.tab') | ||||||||||||||||||||||||||||||
Copyright

This work is licensed under a
Creative Commons Attribution-Noncommercial-Share Alike 3.0 License.
Software written by Ed van Stee & Patrick Wessa
Disclaimer
Information provided on this web site is provided "AS IS" without warranty of any kind, either express or implied, including, without limitation, warranties of merchantability, fitness for a particular purpose, and noninfringement. We use reasonable efforts to include accurate and timely information and periodically update the information, and software without notice. However, we make no warranties or representations as to the accuracy or completeness of such information (or software), and we assume no liability or responsibility for errors or omissions in the content of this web site, or any software bugs in online applications. Your use of this web site is AT YOUR OWN RISK. Under no circumstances and under no legal theory shall we be liable to you or any other person for any direct, indirect, special, incidental, exemplary, or consequential damages arising from your access to, or use of, this web site.
Privacy Policy
We may request personal information to be submitted to our servers in order to be able to:
- personalize online software applications according to your needs
- enforce strict security rules with respect to the data that you upload (e.g. statistical data)
- manage user sessions of online applications
- alert you about important changes or upgrades in resources or applications
We NEVER allow other companies to directly offer registered users information about their products and services. Banner references and hyperlinks of third parties NEVER contain any personal data of the visitor.
We do NOT sell, nor transmit by any means, personal information, nor statistical data series uploaded by you to third parties.
We carefully protect your data from loss, misuse, alteration,
and destruction. However, at any time, and under any circumstance you
are solely responsible for managing your passwords, and keeping them
secret.
We store a unique ANONYMOUS USER ID in the form of a small 'Cookie' on your computer. This allows us to track your progress when using this website which is necessary to create state-dependent features. The cookie is used for NO OTHER PURPOSE. At any time you may opt to disallow cookies from this website - this will not affect other features of this website.
We examine cookies that are used by third-parties (banner and online ads) very closely: abuse from third-parties automatically results in termination of the advertising contract without refund. We have very good reason to believe that the cookies that are produced by third parties (banner ads) do NOT cause any privacy or security risk.
FreeStatistics.org is safe. There is no need to download any software to use the applications and services contained in this website. Hence, your system's security is not compromised by their use, and your personal data - other than data you submit in the account application form, and the user-agent information that is transmitted by your browser - is never transmitted to our servers.
As a general rule, we do not log on-line behavior of individuals (other than normal logging of webserver 'hits'). However, in cases of abuse, hacking, unauthorized access, Denial of Service attacks, illegal copying, hotlinking, non-compliance with international webstandards (such as robots.txt), or any other harmful behavior, our system engineers are empowered to log, track, identify, publish, and ban misbehaving individuals - even if this leads to ban entire blocks of IP addresses, or disclosing user's identity.