Free Statistics
of Irreproducible Research!
Description of Statistical Computation | |||||||||||||||||||||||||||||||||||||||||||||||||||||||||||||||||||||||||||||||||||||||||||||||||||||||||||||||||||||||||||||||||||||||||||||||||||||||||||||||||||||||||||||||
|---|---|---|---|---|---|---|---|---|---|---|---|---|---|---|---|---|---|---|---|---|---|---|---|---|---|---|---|---|---|---|---|---|---|---|---|---|---|---|---|---|---|---|---|---|---|---|---|---|---|---|---|---|---|---|---|---|---|---|---|---|---|---|---|---|---|---|---|---|---|---|---|---|---|---|---|---|---|---|---|---|---|---|---|---|---|---|---|---|---|---|---|---|---|---|---|---|---|---|---|---|---|---|---|---|---|---|---|---|---|---|---|---|---|---|---|---|---|---|---|---|---|---|---|---|---|---|---|---|---|---|---|---|---|---|---|---|---|---|---|---|---|---|---|---|---|---|---|---|---|---|---|---|---|---|---|---|---|---|---|---|---|---|---|---|---|---|---|---|---|---|---|---|---|---|---|
| Author's title | |||||||||||||||||||||||||||||||||||||||||||||||||||||||||||||||||||||||||||||||||||||||||||||||||||||||||||||||||||||||||||||||||||||||||||||||||||||||||||||||||||||||||||||||
| Author | *The author of this computation has been verified* | ||||||||||||||||||||||||||||||||||||||||||||||||||||||||||||||||||||||||||||||||||||||||||||||||||||||||||||||||||||||||||||||||||||||||||||||||||||||||||||||||||||||||||||||
| R Software Module | rwasp_One Factor ANOVA.wasp | ||||||||||||||||||||||||||||||||||||||||||||||||||||||||||||||||||||||||||||||||||||||||||||||||||||||||||||||||||||||||||||||||||||||||||||||||||||||||||||||||||||||||||||||
| Title produced by software | One-Way-Between-Groups ANOVA- Free Statistics Software (Calculator) | ||||||||||||||||||||||||||||||||||||||||||||||||||||||||||||||||||||||||||||||||||||||||||||||||||||||||||||||||||||||||||||||||||||||||||||||||||||||||||||||||||||||||||||||
| Date of computation | Mon, 01 Nov 2010 13:40:20 +0000 | ||||||||||||||||||||||||||||||||||||||||||||||||||||||||||||||||||||||||||||||||||||||||||||||||||||||||||||||||||||||||||||||||||||||||||||||||||||||||||||||||||||||||||||||
| Cite this page as follows | Statistical Computations at FreeStatistics.org, Office for Research Development and Education, URL https://freestatistics.org/blog/index.php?v=date/2010/Nov/01/t1288618741vt69jnewpqkgyxy.htm/, Retrieved Sun, 06 Jul 2025 03:50:17 +0000 | ||||||||||||||||||||||||||||||||||||||||||||||||||||||||||||||||||||||||||||||||||||||||||||||||||||||||||||||||||||||||||||||||||||||||||||||||||||||||||||||||||||||||||||||
| Statistical Computations at FreeStatistics.org, Office for Research Development and Education, URL https://freestatistics.org/blog/index.php?pk=90822, Retrieved Sun, 06 Jul 2025 03:50:17 +0000 | |||||||||||||||||||||||||||||||||||||||||||||||||||||||||||||||||||||||||||||||||||||||||||||||||||||||||||||||||||||||||||||||||||||||||||||||||||||||||||||||||||||||||||||||
| QR Codes: | |||||||||||||||||||||||||||||||||||||||||||||||||||||||||||||||||||||||||||||||||||||||||||||||||||||||||||||||||||||||||||||||||||||||||||||||||||||||||||||||||||||||||||||||
|
| |||||||||||||||||||||||||||||||||||||||||||||||||||||||||||||||||||||||||||||||||||||||||||||||||||||||||||||||||||||||||||||||||||||||||||||||||||||||||||||||||||||||||||||||
| Original text written by user: | |||||||||||||||||||||||||||||||||||||||||||||||||||||||||||||||||||||||||||||||||||||||||||||||||||||||||||||||||||||||||||||||||||||||||||||||||||||||||||||||||||||||||||||||
| IsPrivate? | This computation is/was private until 2010-11-03 | ||||||||||||||||||||||||||||||||||||||||||||||||||||||||||||||||||||||||||||||||||||||||||||||||||||||||||||||||||||||||||||||||||||||||||||||||||||||||||||||||||||||||||||||
| User-defined keywords | |||||||||||||||||||||||||||||||||||||||||||||||||||||||||||||||||||||||||||||||||||||||||||||||||||||||||||||||||||||||||||||||||||||||||||||||||||||||||||||||||||||||||||||||
| Estimated Impact | 502 | ||||||||||||||||||||||||||||||||||||||||||||||||||||||||||||||||||||||||||||||||||||||||||||||||||||||||||||||||||||||||||||||||||||||||||||||||||||||||||||||||||||||||||||||
Tree of Dependent Computations | |||||||||||||||||||||||||||||||||||||||||||||||||||||||||||||||||||||||||||||||||||||||||||||||||||||||||||||||||||||||||||||||||||||||||||||||||||||||||||||||||||||||||||||||
| Family? (F = Feedback message, R = changed R code, M = changed R Module, P = changed Parameters, D = changed Data) | |||||||||||||||||||||||||||||||||||||||||||||||||||||||||||||||||||||||||||||||||||||||||||||||||||||||||||||||||||||||||||||||||||||||||||||||||||||||||||||||||||||||||||||||
| - [One-Way-Between-Groups ANOVA- Free Statistics Software (Calculator)] [] [2010-11-01 13:40:20] [d76b387543b13b5e3afd8ff9e5fdc89f] [Current] - P [One-Way-Between-Groups ANOVA- Free Statistics Software (Calculator)] [Q6 - Long term] [2010-11-07 14:39:24] [1aa8d85d6b335d32b1f6be940e33a166] - P [One-Way-Between-Groups ANOVA- Free Statistics Software (Calculator)] [] [2010-11-17 15:35:41] [29e492448d11757ae0fad5ef6e7f8e86] F [One-Way-Between-Groups ANOVA- Free Statistics Software (Calculator)] [Workshop 2 Vraag 6b] [2010-11-18 12:16:49] [91de8b765895d6ee0c73f0d2e284be17] - R P [One-Way-Between-Groups ANOVA- Free Statistics Software (Calculator)] [] [2010-11-18 15:51:56] [69c775ce4d55db2aa75a88e773e8d700] - P [One-Way-Between-Groups ANOVA- Free Statistics Software (Calculator)] [vraag 6 deel 2 wo...] [2010-11-18 17:05:56] [82643889efeee0b265cd2ff213e5137b] - D [One-Way-Between-Groups ANOVA- Free Statistics Software (Calculator)] [Q6_LT] [2011-11-02 11:38:35] [2adcc8dcd741502b8a9375c7fd3d7ce3] - D [One-Way-Between-Groups ANOVA- Free Statistics Software (Calculator)] [Q6_LT2] [2011-11-02 11:42:39] [2adcc8dcd741502b8a9375c7fd3d7ce3] - P [One-Way-Between-Groups ANOVA- Free Statistics Software (Calculator)] [Workshop2 - Vraag 6] [2010-11-20 14:37:55] [91de8b765895d6ee0c73f0d2e284be17] - R P [One-Way-Between-Groups ANOVA- Free Statistics Software (Calculator)] [Question 6] [2011-10-23 09:56:46] [27e29806e0b1d1351a97bc4ee4116294] - RMP [One-Way-Between-Groups ANOVA- Free Statistics Software (Calculator)] [Question 6: long ...] [2011-10-26 10:18:30] [baac05fe722f73c103cc2d713fa5bd78] - P [One-Way-Between-Groups ANOVA- Free Statistics Software (Calculator)] [Question 6, Lange...] [2011-10-26 12:59:12] [9c3137400ced3280b419f1e434c29e1d] - P [One-Way-Between-Groups ANOVA- Free Statistics Software (Calculator)] [Question 6, Lange...] [2011-10-26 12:59:12] [9c3137400ced3280b419f1e434c29e1d] - R PD [One-Way-Between-Groups ANOVA- Free Statistics Software (Calculator)] [1-way ANOVA (lang...] [2011-10-28 00:04:57] [7f54ec67e5798cc59f49446b41e2f221] - R P [One-Way-Between-Groups ANOVA- Free Statistics Software (Calculator)] [Workshop 5 - Task...] [2011-10-30 18:26:10] [3deae35ae8526e36953f595ad65f3a1f] - R P [One-Way-Between-Groups ANOVA- Free Statistics Software (Calculator)] [C5 V6L] [2011-10-31 17:36:38] [74be16979710d4c4e7c6647856088456] - PD [One-Way-Between-Groups ANOVA- Free Statistics Software (Calculator)] [task 5.6.2] [2011-11-01 17:16:51] [d1ce18d003fa52f731d1c3ce8b58d5f9] - PD [One-Way-Between-Groups ANOVA- Free Statistics Software (Calculator)] [] [2011-11-01 18:24:09] [ee8c3a74bf3b349877806e9a50913c60] - P [One-Way-Between-Groups ANOVA- Free Statistics Software (Calculator)] [] [2011-11-02 13:23:56] [84fecfa8c8107ac4e0024d8b1730a531] - PD [One-Way-Between-Groups ANOVA- Free Statistics Software (Calculator)] [] [2011-11-02 13:46:12] [84fecfa8c8107ac4e0024d8b1730a531] - R P [One-Way-Between-Groups ANOVA- Free Statistics Software (Calculator)] [] [2011-11-02 13:48:04] [84fecfa8c8107ac4e0024d8b1730a531] - RMPD [Two-Way ANOVA] [] [2011-11-02 13:56:17] [84fecfa8c8107ac4e0024d8b1730a531] - P [One-Way-Between-Groups ANOVA- Free Statistics Software (Calculator)] [] [2011-11-02 13:54:02] [2d3d135c7070430a7cc2b1c9a86f42b1] - P [One-Way-Between-Groups ANOVA- Free Statistics Software (Calculator)] [long term] [2011-11-02 15:42:26] [ec2187f7727da5d5d939740b21b8b68a] - PD [One-Way-Between-Groups ANOVA- Free Statistics Software (Calculator)] [Workshop 5: Quest...] [2011-11-02 15:59:58] [a9a952c1cbc7081c25fad93a34aab827] - D [One-Way-Between-Groups ANOVA- Free Statistics Software (Calculator)] [Workshop 5: Quest...] [2011-11-02 16:08:57] [a9a952c1cbc7081c25fad93a34aab827] - RM [One-Way-Between-Groups ANOVA- Free Statistics Software (Calculator)] [] [2011-11-15 19:22:16] [74be16979710d4c4e7c6647856088456] - R [One-Way-Between-Groups ANOVA- Free Statistics Software (Calculator)] [] [2011-11-15 19:23:34] [74be16979710d4c4e7c6647856088456] - P [One-Way-Between-Groups ANOVA- Free Statistics Software (Calculator)] [] [2011-11-03 17:29:12] [86f7284edee3dbb8ea5c7e2dec87d892] - R P [One-Way-Between-Groups ANOVA- Free Statistics Software (Calculator)] [] [2011-11-03 17:31:25] [86f7284edee3dbb8ea5c7e2dec87d892] - PD [One-Way-Between-Groups ANOVA- Free Statistics Software (Calculator)] [WS5 - Q6 - Lange ...] [2011-11-08 15:26:49] [43a132f5d1d3e2c258a569e3803c6f06] - P [One-Way-Between-Groups ANOVA- Free Statistics Software (Calculator)] [] [2011-11-08 16:31:26] [aa6b3f8e5b050429abaad141c7204e84] - PD [One-Way-Between-Groups ANOVA- Free Statistics Software (Calculator)] [] [2011-11-08 16:42:14] [aa6b3f8e5b050429abaad141c7204e84] - PD [One-Way-Between-Groups ANOVA- Free Statistics Software (Calculator)] [] [2011-11-08 16:44:53] [aa6b3f8e5b050429abaad141c7204e84] - RMPD [Two-Way ANOVA] [] [2011-11-08 16:47:26] [aa6b3f8e5b050429abaad141c7204e84] - P [One-Way-Between-Groups ANOVA- Free Statistics Software (Calculator)] [] [2011-11-08 18:55:38] [19d77e37efa419fdc040c74a96874aff] - RMP [One-Way-Between-Groups ANOVA- Free Statistics Software (Calculator)] [WS5-Q6.2] [2011-11-08 20:17:48] [74be16979710d4c4e7c6647856088456] - PD [One-Way-Between-Groups ANOVA- Free Statistics Software (Calculator)] [One-way ANOVA (2)] [2011-12-10 14:48:18] [8e7c659e1b71a02d35eacc5210237549] - P [One-Way-Between-Groups ANOVA- Free Statistics Software (Calculator)] [] [2011-12-11 10:56:29] [80bca13c5f9401fbb753952fd2952f4a] - P [One-Way-Between-Groups ANOVA- Free Statistics Software (Calculator)] [One- Way Anova La...] [2011-12-14 10:26:04] [2c6fcdc40ef3b1a27716d75d6f478b32] - R P [One-Way-Between-Groups ANOVA- Free Statistics Software (Calculator)] [] [2011-12-15 19:27:03] [74be16979710d4c4e7c6647856088456] - P [One-Way-Between-Groups ANOVA- Free Statistics Software (Calculator)] [] [2011-12-16 08:30:12] [80bca13c5f9401fbb753952fd2952f4a] - P [One-Way-Between-Groups ANOVA- Free Statistics Software (Calculator)] [] [2011-12-16 09:08:06] [80bca13c5f9401fbb753952fd2952f4a] - R P [One-Way-Between-Groups ANOVA- Free Statistics Software (Calculator)] [Paper:1-way ANOVA...] [2011-12-16 09:21:37] [ab11d59973a0ec4be849e25906c4cdbf] - R P [One-Way-Between-Groups ANOVA- Free Statistics Software (Calculator)] [] [2011-12-16 10:22:00] [c53df38315e3cbde2dbe0de809195ef2] - R P [One-Way-Between-Groups ANOVA- Free Statistics Software (Calculator)] [paper: anova lang...] [2012-12-19 09:01:14] [e82bfd05792fd49409106058973f58a8] - P [One-Way-Between-Groups ANOVA- Free Statistics Software (Calculator)] [Paper: one-way a...] [2011-12-16 21:44:54] [59720598bc822822e6b5d0c431ef1d7f] - R P [One-Way-Between-Groups ANOVA- Free Statistics Software (Calculator)] [] [2011-12-17 10:29:42] [0f1ce50ec9632e206f4325c3ca8926e2] - P [One-Way-Between-Groups ANOVA- Free Statistics Software (Calculator)] [paper] [2011-12-17 13:14:05] [a9dc51245fb8ca00f931d89893d090c8] [Truncated] | |||||||||||||||||||||||||||||||||||||||||||||||||||||||||||||||||||||||||||||||||||||||||||||||||||||||||||||||||||||||||||||||||||||||||||||||||||||||||||||||||||||||||||||||
| Feedback Forum | |||||||||||||||||||||||||||||||||||||||||||||||||||||||||||||||||||||||||||||||||||||||||||||||||||||||||||||||||||||||||||||||||||||||||||||||||||||||||||||||||||||||||||||||
Post a new message | |||||||||||||||||||||||||||||||||||||||||||||||||||||||||||||||||||||||||||||||||||||||||||||||||||||||||||||||||||||||||||||||||||||||||||||||||||||||||||||||||||||||||||||||
Dataset | |||||||||||||||||||||||||||||||||||||||||||||||||||||||||||||||||||||||||||||||||||||||||||||||||||||||||||||||||||||||||||||||||||||||||||||||||||||||||||||||||||||||||||||||
| Dataseries X: | |||||||||||||||||||||||||||||||||||||||||||||||||||||||||||||||||||||||||||||||||||||||||||||||||||||||||||||||||||||||||||||||||||||||||||||||||||||||||||||||||||||||||||||||
1 1 4 0 2 'T' 0 3 -1 1 4 1 1 0 0 2 'T' 0 -1 -1 1 0 0 1 4 1 1.5 'T' 1 4 1 1.5 5 0 0 0 0 0 'T' 0 0 0 0 0 1 1 0 1 1 'T' 0 -1 0 0 0 1 1 0 1 2 'T' 0 -1 0 1 0 1 1 0 1 2 'T' 0 -1 0 1 0 0 1 0 1 1 'T' 1 0 1 1 1 0 1 4 1 2 'T' 1 4 1 2 5 1 1 1 0 2 'T' 0 0 -1 1 1 0 0 4 0 2 'T' 0 4 0 2 4 0 1 0 1 0 'T' 1 0 1 0 1 0 1 2 1 0 'T' 1 2 1 0 3 0 1 0 0 2 'T' 1 0 0 2 1 0 0 0 NA NA 'T' 0 0 NA NA 0 1 1 0 1 2 'T' 0 -1 0 1 0 1 1 1 0 2 'T' 0 0 -1 1 1 1 1 0 1 0.5 'T' 0 -1 0 -0.5 0 0 1 0 1 2 'T' 1 0 1 2 1 0 0 2 1 0 'T' 0 2 1 0 2 1 1 2 1 2 'T' 0 1 0 1 2 1 1 1 0 0 'T' 0 0 -1 -1 1 0 0 2 NA NA 'T' 0 2 NA NA 2 1 0 0 NA NA 'T' -1 -1 NA NA -1 1 1 3 1 2 'T' 0 2 0 1 3 1 0 0 1 0 'T' -1 -1 0 -1 -1 1 1 0 NA NA 'T' 0 -1 NA NA 0 0 0 0 NA NA 'T' 0 0 NA NA 0 0 0 1 0 2 'T' 0 1 0 2 1 1 1 0 1 1 'T' 0 -1 0 0 0 1 0 0 0 0.5 'T' -1 -1 -1 -0.5 -1 1 1 4 0 2 'T' 0 3 -1 1 4 0 0 0 1 0.5 'T' 0 0 1 0.5 0 0 0 1 NA NA 'T' 0 1 NA NA 1 0 0 0 1 0.5 'T' 0 0 1 0.5 0 1 1 0 NA NA 'T' 0 -1 NA NA 0 1 1 4 0 2 'T' 0 3 -1 1 4 0 1 1 1 0 'E' 1 1 1 0 2 0 1 0 1 1 'E' 1 0 1 1 1 1 1 4 1 2 'E' 0 3 0 1 4 1 1 0 1 1 'E' 0 -1 0 0 0 1 1 4 1 2 'E' 0 3 0 1 4 1 1 0 0 0 'E' 0 -1 -1 -1 0 1 1 0 1 0.5 'E' 0 -1 0 -0.5 0 0 0 0 1 0 'E' 0 0 1 0 0 0 1 4 1 2 'E' 1 4 1 2 5 0 1 0 0 0 'E' 1 0 0 0 1 1 1 0 0 1 'E' 0 -1 -1 0 0 1 1 4 1 2 'E' 0 3 0 1 4 0 0 4 0 0.5 'E' 0 4 0 0.5 4 0 1 0 1 2 'E' 1 0 1 2 1 1 1 1 1 2 'E' 0 0 0 1 1 0 1 0 1 2 'E' 1 0 1 2 1 0 0 4 NA NA 'E' 0 4 NA NA 4 0 1 0 0 0 'E' 1 0 0 0 1 0 1 2 1 0 'E' 1 2 1 0 3 0 1 0 1 0.5 'E' 1 0 1 0.5 1 0 1 4 NA NA 'E' 1 4 NA NA 5 0 0 4 0 2 'E' 0 4 0 2 4 0 0 0 NA NA 'E' 0 0 NA NA 0 0 1 0 1 0 'E' 1 0 1 0 1 1 1 4 1 2 'E' 0 3 0 1 4 1 1 0 1 1 'E' 0 -1 0 0 0 1 0 0 1 0 'E' -1 -1 0 -1 -1 0 0 2 1 2 'E' 0 2 1 2 2 0 1 0 0 1 'E' 1 0 0 1 1 0 1 0 1 2 'E' 1 0 1 2 1 0 0 0 0 0 'E' 0 0 0 0 0 1 1 4 1 1 'E' 0 3 0 0 4 1 1 4 1 2 'E' 0 3 0 1 4 0 1 2 0 0 'S' 1 2 0 0 3 0 1 0 0 0 'S' 1 0 0 0 1 0 1 0 0 0 'S' 1 0 0 0 1 0 1 4 0 0 'S' 1 4 0 0 5 1 1 0 1 2 'S' 0 -1 0 1 0 1 0 0 1 2 'S' -1 -1 0 1 -1 0 0 1 1 2 'S' 0 1 1 2 1 1 1 2 1 2 'S' 0 1 0 1 2 1 0 0 1 2 'S' -1 -1 0 1 -1 1 1 2 1 2 'S' 0 1 0 1 2 0 0 0 1 2 'S' 0 0 1 2 0 0 0 4 1 2 'S' 0 4 1 2 4 0 0 4 1 2 'S' 0 4 1 2 4 1 0 0 1 2 'S' -1 -1 0 1 -1 0 0 0 NA NA 'S' 0 0 NA NA 0 0 0 4 1 2 'S' 0 4 1 2 4 1 0 0 NA NA 'S' -1 -1 NA NA -1 1 1 4 1 2 'S' 0 3 0 1 4 0 0 2 1 2 'S' 0 2 1 2 2 0 0 2 NA NA 'S' 0 2 NA NA 2 1 1 0 0 0 'S' 0 -1 -1 -1 0 1 1 0 1 2 'S' 0 -1 0 1 0 1 1 4 NA NA 'S' 0 3 NA NA 4 0 1 0 1 2 'S' 1 0 1 2 1 1 1 0 1 2 'S' 0 -1 0 1 0 1 1 0 1 2 'S' 0 -1 0 1 0 1 1 4 1 2 'S' 0 3 0 1 4 1 1 4 1 2 'S' 0 3 0 1 4 0 0 0 NA NA 'S' 0 0 NA NA 0 0 0 0 0 0 'S' 0 0 0 0 0 1 1 2 0 0 'S' 0 1 -1 -1 2 0 0 1 1 2 'S' 0 1 1 2 1 0 0 0 0 0 'S' 0 0 0 0 0 0 0 2 1 2 'S' 0 2 1 2 2 0 1 1 0 0 'S' 1 1 0 0 2 | |||||||||||||||||||||||||||||||||||||||||||||||||||||||||||||||||||||||||||||||||||||||||||||||||||||||||||||||||||||||||||||||||||||||||||||||||||||||||||||||||||||||||||||||
Tables (Output of Computation) | |||||||||||||||||||||||||||||||||||||||||||||||||||||||||||||||||||||||||||||||||||||||||||||||||||||||||||||||||||||||||||||||||||||||||||||||||||||||||||||||||||||||||||||||
| |||||||||||||||||||||||||||||||||||||||||||||||||||||||||||||||||||||||||||||||||||||||||||||||||||||||||||||||||||||||||||||||||||||||||||||||||||||||||||||||||||||||||||||||
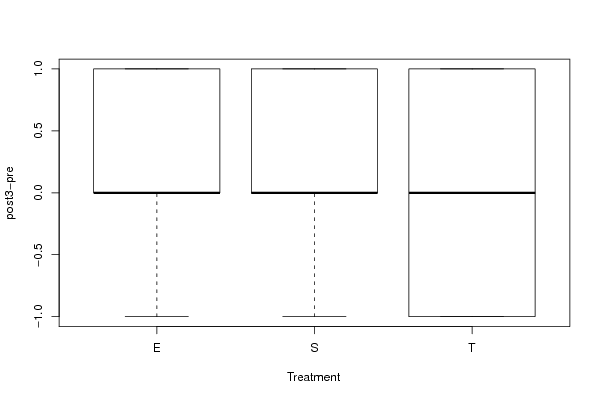
Figures (Output of Computation) | |||||||||||||||||||||||||||||||||||||||||||||||||||||||||||||||||||||||||||||||||||||||||||||||||||||||||||||||||||||||||||||||||||||||||||||||||||||||||||||||||||||||||||||||
Input Parameters & R Code | |||||||||||||||||||||||||||||||||||||||||||||||||||||||||||||||||||||||||||||||||||||||||||||||||||||||||||||||||||||||||||||||||||||||||||||||||||||||||||||||||||||||||||||||
| Parameters (Session): | |||||||||||||||||||||||||||||||||||||||||||||||||||||||||||||||||||||||||||||||||||||||||||||||||||||||||||||||||||||||||||||||||||||||||||||||||||||||||||||||||||||||||||||||
| par1 = 1 ; par2 = 2 ; par3 = TRUE ; | |||||||||||||||||||||||||||||||||||||||||||||||||||||||||||||||||||||||||||||||||||||||||||||||||||||||||||||||||||||||||||||||||||||||||||||||||||||||||||||||||||||||||||||||
| Parameters (R input): | |||||||||||||||||||||||||||||||||||||||||||||||||||||||||||||||||||||||||||||||||||||||||||||||||||||||||||||||||||||||||||||||||||||||||||||||||||||||||||||||||||||||||||||||
| par1 = 9 ; par2 = 6 ; par3 = TRUE ; | |||||||||||||||||||||||||||||||||||||||||||||||||||||||||||||||||||||||||||||||||||||||||||||||||||||||||||||||||||||||||||||||||||||||||||||||||||||||||||||||||||||||||||||||
| R code (references can be found in the software module): | |||||||||||||||||||||||||||||||||||||||||||||||||||||||||||||||||||||||||||||||||||||||||||||||||||||||||||||||||||||||||||||||||||||||||||||||||||||||||||||||||||||||||||||||
cat1 <- as.numeric(par1) # | |||||||||||||||||||||||||||||||||||||||||||||||||||||||||||||||||||||||||||||||||||||||||||||||||||||||||||||||||||||||||||||||||||||||||||||||||||||||||||||||||||||||||||||||