Free Statistics
of Irreproducible Research!
Description of Statistical Computation | |||||||||||||||||||||||||||||||||||||||||||||||||||||||||||||||||||||||||||||||||||||||||||||||||||||||||||||||||||||||||||||||||||||||||||||||||||||||||||||||||||||||||
|---|---|---|---|---|---|---|---|---|---|---|---|---|---|---|---|---|---|---|---|---|---|---|---|---|---|---|---|---|---|---|---|---|---|---|---|---|---|---|---|---|---|---|---|---|---|---|---|---|---|---|---|---|---|---|---|---|---|---|---|---|---|---|---|---|---|---|---|---|---|---|---|---|---|---|---|---|---|---|---|---|---|---|---|---|---|---|---|---|---|---|---|---|---|---|---|---|---|---|---|---|---|---|---|---|---|---|---|---|---|---|---|---|---|---|---|---|---|---|---|---|---|---|---|---|---|---|---|---|---|---|---|---|---|---|---|---|---|---|---|---|---|---|---|---|---|---|---|---|---|---|---|---|---|---|---|---|---|---|---|---|---|---|---|---|---|---|---|---|---|
| Author's title | |||||||||||||||||||||||||||||||||||||||||||||||||||||||||||||||||||||||||||||||||||||||||||||||||||||||||||||||||||||||||||||||||||||||||||||||||||||||||||||||||||||||||
| Author | *The author of this computation has been verified* | ||||||||||||||||||||||||||||||||||||||||||||||||||||||||||||||||||||||||||||||||||||||||||||||||||||||||||||||||||||||||||||||||||||||||||||||||||||||||||||||||||||||||
| R Software Module | rwasp_twosampletests_mean.wasp | ||||||||||||||||||||||||||||||||||||||||||||||||||||||||||||||||||||||||||||||||||||||||||||||||||||||||||||||||||||||||||||||||||||||||||||||||||||||||||||||||||||||||
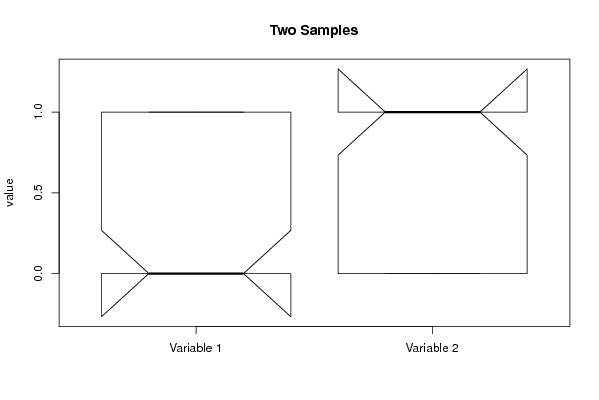
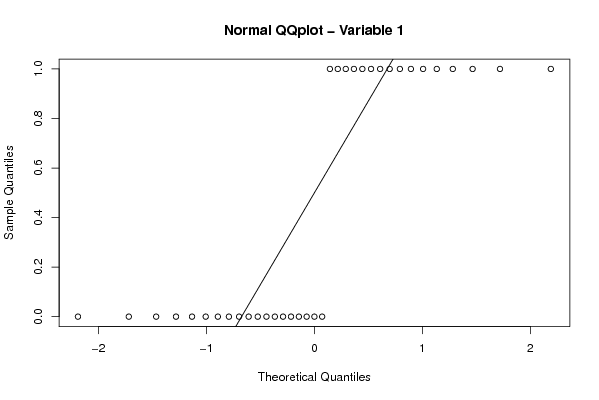
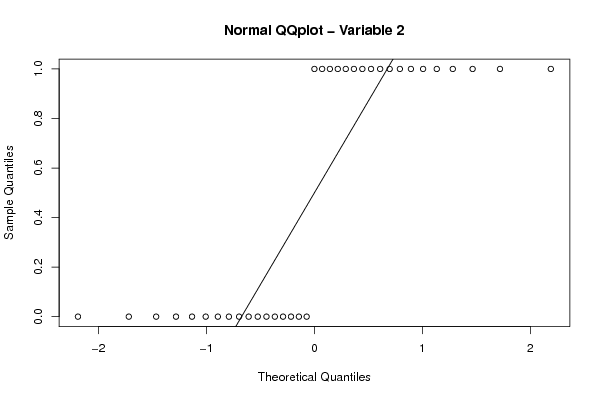
| Title produced by software | Paired and Unpaired Two Samples Tests about the Mean | ||||||||||||||||||||||||||||||||||||||||||||||||||||||||||||||||||||||||||||||||||||||||||||||||||||||||||||||||||||||||||||||||||||||||||||||||||||||||||||||||||||||||
| Date of computation | Mon, 01 Nov 2010 13:17:22 +0000 | ||||||||||||||||||||||||||||||||||||||||||||||||||||||||||||||||||||||||||||||||||||||||||||||||||||||||||||||||||||||||||||||||||||||||||||||||||||||||||||||||||||||||
| Cite this page as follows | Statistical Computations at FreeStatistics.org, Office for Research Development and Education, URL https://freestatistics.org/blog/index.php?v=date/2010/Nov/01/t1288617370zvifw46r6k797gx.htm/, Retrieved Sat, 08 Nov 2025 19:04:01 +0000 | ||||||||||||||||||||||||||||||||||||||||||||||||||||||||||||||||||||||||||||||||||||||||||||||||||||||||||||||||||||||||||||||||||||||||||||||||||||||||||||||||||||||||
| Statistical Computations at FreeStatistics.org, Office for Research Development and Education, URL https://freestatistics.org/blog/index.php?pk=90787, Retrieved Sat, 08 Nov 2025 19:04:01 +0000 | |||||||||||||||||||||||||||||||||||||||||||||||||||||||||||||||||||||||||||||||||||||||||||||||||||||||||||||||||||||||||||||||||||||||||||||||||||||||||||||||||||||||||
| QR Codes: | |||||||||||||||||||||||||||||||||||||||||||||||||||||||||||||||||||||||||||||||||||||||||||||||||||||||||||||||||||||||||||||||||||||||||||||||||||||||||||||||||||||||||
|
| |||||||||||||||||||||||||||||||||||||||||||||||||||||||||||||||||||||||||||||||||||||||||||||||||||||||||||||||||||||||||||||||||||||||||||||||||||||||||||||||||||||||||
| Original text written by user: | |||||||||||||||||||||||||||||||||||||||||||||||||||||||||||||||||||||||||||||||||||||||||||||||||||||||||||||||||||||||||||||||||||||||||||||||||||||||||||||||||||||||||
| IsPrivate? | This computation is/was private until 2010-11-03 | ||||||||||||||||||||||||||||||||||||||||||||||||||||||||||||||||||||||||||||||||||||||||||||||||||||||||||||||||||||||||||||||||||||||||||||||||||||||||||||||||||||||||
| User-defined keywords | |||||||||||||||||||||||||||||||||||||||||||||||||||||||||||||||||||||||||||||||||||||||||||||||||||||||||||||||||||||||||||||||||||||||||||||||||||||||||||||||||||||||||
| Estimated Impact | 941 | ||||||||||||||||||||||||||||||||||||||||||||||||||||||||||||||||||||||||||||||||||||||||||||||||||||||||||||||||||||||||||||||||||||||||||||||||||||||||||||||||||||||||
Tree of Dependent Computations | |||||||||||||||||||||||||||||||||||||||||||||||||||||||||||||||||||||||||||||||||||||||||||||||||||||||||||||||||||||||||||||||||||||||||||||||||||||||||||||||||||||||||
| Family? (F = Feedback message, R = changed R code, M = changed R Module, P = changed Parameters, D = changed Data) | |||||||||||||||||||||||||||||||||||||||||||||||||||||||||||||||||||||||||||||||||||||||||||||||||||||||||||||||||||||||||||||||||||||||||||||||||||||||||||||||||||||||||
| - [Paired and Unpaired Two Samples Tests about the Mean] [] [2010-11-01 13:17:22] [d76b387543b13b5e3afd8ff9e5fdc89f] [Current] - R P [Paired and Unpaired Two Samples Tests about the Mean] [] [2010-11-08 08:07:07] [22937c5b58c14f6c22964f32d64ff823] - P [Paired and Unpaired Two Samples Tests about the Mean] [Workshop 2 - Vraag 3] [2010-11-22 22:02:00] [91de8b765895d6ee0c73f0d2e284be17] - R P [Paired and Unpaired Two Samples Tests about the Mean] [Two Sample t-test...] [2011-10-27 22:15:42] [7f54ec67e5798cc59f49446b41e2f221] - R P [Paired and Unpaired Two Samples Tests about the Mean] [C5 V3] [2011-10-31 16:55:27] [74be16979710d4c4e7c6647856088456] - R P [Paired and Unpaired Two Samples Tests about the Mean] [C5 V3b] [2011-10-31 17:14:24] [74be16979710d4c4e7c6647856088456] - P [Paired and Unpaired Two Samples Tests about the Mean] [Two Sample S trea...] [2011-11-04 14:30:47] [19d77e37efa419fdc040c74a96874aff] - P [Paired and Unpaired Two Samples Tests about the Mean] [Question 3 - WS5] [2011-11-07 20:29:49] [dea2223cade331092cb80c89f49545fe] - RMP [Paired and Unpaired Two Samples Tests about the Mean] [] [2011-11-17 21:33:53] [298b545ca29b1a60cbb481c5dea313ae] - R P [Paired and Unpaired Two Samples Tests about the Mean] [] [2011-11-19 16:34:46] [b4c8fd31b0af00c33711722ddf8d2c4c] - P [Paired and Unpaired Two Samples Tests about the Mean] [PAPER] [2011-12-10 12:08:52] [27e29806e0b1d1351a97bc4ee4116294] - P [Paired and Unpaired Two Samples Tests about the Mean] [] [2011-12-16 08:50:33] [80bca13c5f9401fbb753952fd2952f4a] - PD [Paired and Unpaired Two Samples Tests about the Mean] [] [2011-12-17 10:19:13] [a9dc51245fb8ca00f931d89893d090c8] - RMP [Paired and Unpaired Two Samples Tests about the Mean] [] [2011-12-17 17:38:24] [880b2848ba77f3f5ee007f117bbf00fe] - RMP [Paired and Unpaired Two Samples Tests about the Mean] [two sample t-test: S] [2011-12-18 10:19:53] [baac05fe722f73c103cc2d713fa5bd78] - R P [Paired and Unpaired Two Samples Tests about the Mean] [paper testen hypo...] [2011-12-18 14:00:35] [d5821fed422662f85834b1edae505ce2] - R P [Paired and Unpaired Two Samples Tests about the Mean] [Two Sample T-Test...] [2011-12-19 15:47:59] [b8fde34a99ee6a7d49500940cae4da2a] - [Paired and Unpaired Two Samples Tests about the Mean] [] [2012-12-17 13:28:46] [1337bb1ecd4655261bf98bac1776aa01] - [Paired and Unpaired Two Samples Tests about the Mean] [] [2012-12-17 13:30:28] [1337bb1ecd4655261bf98bac1776aa01] - R P [Paired and Unpaired Two Samples Tests about the Mean] [Two sample T-test...] [2011-12-19 15:48:06] [d95291bc5e09a8bed20558da95617a33] - P [Paired and Unpaired Two Samples Tests about the Mean] [] [2011-12-19 17:47:11] [30b3e197115d238a51c18bcedc33a6a5] - RMP [Paired and Unpaired Two Samples Tests about the Mean] [] [2011-12-19 19:56:14] [2d3d135c7070430a7cc2b1c9a86f42b1] - RMP [Paired and Unpaired Two Samples Tests about the Mean] [T_kt] [2011-12-20 01:45:28] [7e17e0c557325a60eb6c8af681a1c273] - R P [Paired and Unpaired Two Samples Tests about the Mean] [S behandeling] [2011-12-20 09:25:46] [c035d973aa8488be257660c2dc4ec375] - R P [Paired and Unpaired Two Samples Tests about the Mean] [S behandeling] [2011-12-20 09:27:35] [c035d973aa8488be257660c2dc4ec375] - R P [Paired and Unpaired Two Samples Tests about the Mean] [Derde hypothese ] [2011-12-21 13:49:57] [07b2c5c51166cb60d3a449987e886a27] - RMP [Paired and Unpaired Two Samples Tests about the Mean] [S] [2011-12-22 15:00:37] [98f3ba974ec9d6d754dcc83206539a91] - RMP [Paired and Unpaired Two Samples Tests about the Mean] [S_kt] [2011-12-22 23:19:13] [7e17e0c557325a60eb6c8af681a1c273] - RMP [Paired and Unpaired Two Samples Tests about the Mean] [] [2012-10-14 16:39:39] [74be16979710d4c4e7c6647856088456] - RMP [Paired and Unpaired Two Samples Tests about the Mean] [] [2012-10-15 10:03:19] [f810c1d88ae49fd60019f9e52bf9eae3] - RMP [Paired and Unpaired Two Samples Tests about the Mean] [sample test] [2012-10-15 16:03:23] [60d1ad8da4696c30bdea6b2c1b52db5e] - RMP [Paired and Unpaired Two Samples Tests about the Mean] [ws5q3] [2012-10-15 19:42:28] [fa543719fe3f8358943b948de15add90] - P [Paired and Unpaired Two Samples Tests about the Mean] [WS5 Q3] [2012-10-29 15:22:34] [9dd9c05d056fdee415816a8bd25f68fd] - P [Paired and Unpaired Two Samples Tests about the Mean] [Workshop 5 Task 3] [2012-10-30 11:18:10] [c5937bf2e8e0a7b2aa466d1286878951] - RMP [Paired and Unpaired Two Samples Tests about the Mean] [workshop 5 -Q3] [2012-10-30 15:04:54] [74be16979710d4c4e7c6647856088456] - R P [Paired and Unpaired Two Samples Tests about the Mean] [ws5 q3 1] [2012-10-30 15:06:28] [74be16979710d4c4e7c6647856088456] - R P [Paired and Unpaired Two Samples Tests about the Mean] [] [2012-11-24 12:59:00] [142938da2fef436f3122377f660295cc] - R P [Paired and Unpaired Two Samples Tests about the Mean] [] [2012-11-27 18:52:19] [717eeab792c979f6e7c3b92a165ad49e] - PD [Paired and Unpaired Two Samples Tests about the Mean] [paper deel 2 unpa...] [2012-12-12 17:58:52] [48f852fd41a4fa7d41d1802199989991] - RMP [Paired and Unpaired Two Samples Tests about the Mean] [Paper Deel 2 Pair...] [2012-12-14 14:15:13] [2972d443360a042d7188069add54b356] - R P [Paired and Unpaired Two Samples Tests about the Mean] [Anova, meerv regr...] [2012-12-17 11:07:31] [dbdfdab7c884aa7a69290945f2923e51] - P [Paired and Unpaired Two Samples Tests about the Mean] [Paper_2.6] [2012-12-19 18:48:04] [be6dd99035eed41c2358246baf91f928] - R P [Paired and Unpaired Two Samples Tests about the Mean] [Deel 2: hypothese...] [2012-12-20 22:55:42] [5e6119a0aa181aac6bb71d6b937f8665] - RMP [Paired and Unpaired Two Samples Tests about the Mean] [gepaarde two samp...] [2012-12-21 22:26:49] [d47233a2cd9f9635ad611b5f9ecd3f2f] - R P [Paired and Unpaired Two Samples Tests about the Mean] [] [2012-12-23 05:37:15] [7ba0816b78c58edd3dfdcc950c417269] - RMP [Paired and Unpaired Two Samples Tests about the Mean] [Workshop 5 - Ques...] [2013-11-05 11:48:30] [74be16979710d4c4e7c6647856088456] - R P [Paired and Unpaired Two Samples Tests about the Mean] [Workshop 5 - Exp1 Q3] [2013-11-05 13:39:09] [508ad00fbaced7ad8e80ddb3167ea0fd] - RMP [Paired and Unpaired Two Samples Tests about the Mean] [] [2014-10-21 07:53:37] [32b17a345b130fdf5cc88718ed94a974] - M [Paired and Unpaired Two Samples Tests about the Mean] [Ws 5 Question 3] [2014-10-29 09:22:19] [be945163e51ed825733188af308451be] [Truncated] | |||||||||||||||||||||||||||||||||||||||||||||||||||||||||||||||||||||||||||||||||||||||||||||||||||||||||||||||||||||||||||||||||||||||||||||||||||||||||||||||||||||||||
| Feedback Forum | |||||||||||||||||||||||||||||||||||||||||||||||||||||||||||||||||||||||||||||||||||||||||||||||||||||||||||||||||||||||||||||||||||||||||||||||||||||||||||||||||||||||||
Post a new message | |||||||||||||||||||||||||||||||||||||||||||||||||||||||||||||||||||||||||||||||||||||||||||||||||||||||||||||||||||||||||||||||||||||||||||||||||||||||||||||||||||||||||
Dataset | |||||||||||||||||||||||||||||||||||||||||||||||||||||||||||||||||||||||||||||||||||||||||||||||||||||||||||||||||||||||||||||||||||||||||||||||||||||||||||||||||||||||||
| Dataseries X: | |||||||||||||||||||||||||||||||||||||||||||||||||||||||||||||||||||||||||||||||||||||||||||||||||||||||||||||||||||||||||||||||||||||||||||||||||||||||||||||||||||||||||
0 1 0 1 0 1 0 1 1 1 1 0 0 0 1 1 1 0 1 1 0 0 0 0 0 0 1 0 0 0 0 0 1 0 1 1 0 0 0 0 1 1 1 1 1 1 0 1 1 1 1 1 1 1 1 1 0 0 0 0 1 1 0 0 0 0 0 0 0 1 | |||||||||||||||||||||||||||||||||||||||||||||||||||||||||||||||||||||||||||||||||||||||||||||||||||||||||||||||||||||||||||||||||||||||||||||||||||||||||||||||||||||||||
Tables (Output of Computation) | |||||||||||||||||||||||||||||||||||||||||||||||||||||||||||||||||||||||||||||||||||||||||||||||||||||||||||||||||||||||||||||||||||||||||||||||||||||||||||||||||||||||||
| |||||||||||||||||||||||||||||||||||||||||||||||||||||||||||||||||||||||||||||||||||||||||||||||||||||||||||||||||||||||||||||||||||||||||||||||||||||||||||||||||||||||||
Figures (Output of Computation) | |||||||||||||||||||||||||||||||||||||||||||||||||||||||||||||||||||||||||||||||||||||||||||||||||||||||||||||||||||||||||||||||||||||||||||||||||||||||||||||||||||||||||
Input Parameters & R Code | |||||||||||||||||||||||||||||||||||||||||||||||||||||||||||||||||||||||||||||||||||||||||||||||||||||||||||||||||||||||||||||||||||||||||||||||||||||||||||||||||||||||||
| Parameters (Session): | |||||||||||||||||||||||||||||||||||||||||||||||||||||||||||||||||||||||||||||||||||||||||||||||||||||||||||||||||||||||||||||||||||||||||||||||||||||||||||||||||||||||||
| par1 = 1 ; par2 = 2 ; par3 = TRUE ; | |||||||||||||||||||||||||||||||||||||||||||||||||||||||||||||||||||||||||||||||||||||||||||||||||||||||||||||||||||||||||||||||||||||||||||||||||||||||||||||||||||||||||
| Parameters (R input): | |||||||||||||||||||||||||||||||||||||||||||||||||||||||||||||||||||||||||||||||||||||||||||||||||||||||||||||||||||||||||||||||||||||||||||||||||||||||||||||||||||||||||
| par1 = 1 ; par2 = 2 ; par3 = 0.95 ; par4 = two.sided ; par5 = paired ; par6 = 0.0 ; | |||||||||||||||||||||||||||||||||||||||||||||||||||||||||||||||||||||||||||||||||||||||||||||||||||||||||||||||||||||||||||||||||||||||||||||||||||||||||||||||||||||||||
| R code (references can be found in the software module): | |||||||||||||||||||||||||||||||||||||||||||||||||||||||||||||||||||||||||||||||||||||||||||||||||||||||||||||||||||||||||||||||||||||||||||||||||||||||||||||||||||||||||
par1 <- as.numeric(par1) #column number of first sample | |||||||||||||||||||||||||||||||||||||||||||||||||||||||||||||||||||||||||||||||||||||||||||||||||||||||||||||||||||||||||||||||||||||||||||||||||||||||||||||||||||||||||