Free Statistics
of Irreproducible Research!
Description of Statistical Computation | |||||||||||||||||||||||||||||||||||||||||||||||||||||||||||||||||||||||||||||||||||||||||||||||||||||||||||||||||||||||||||||||||||||||||||||||||||||||||||||||||||||||||
|---|---|---|---|---|---|---|---|---|---|---|---|---|---|---|---|---|---|---|---|---|---|---|---|---|---|---|---|---|---|---|---|---|---|---|---|---|---|---|---|---|---|---|---|---|---|---|---|---|---|---|---|---|---|---|---|---|---|---|---|---|---|---|---|---|---|---|---|---|---|---|---|---|---|---|---|---|---|---|---|---|---|---|---|---|---|---|---|---|---|---|---|---|---|---|---|---|---|---|---|---|---|---|---|---|---|---|---|---|---|---|---|---|---|---|---|---|---|---|---|---|---|---|---|---|---|---|---|---|---|---|---|---|---|---|---|---|---|---|---|---|---|---|---|---|---|---|---|---|---|---|---|---|---|---|---|---|---|---|---|---|---|---|---|---|---|---|---|---|---|
| Author's title | |||||||||||||||||||||||||||||||||||||||||||||||||||||||||||||||||||||||||||||||||||||||||||||||||||||||||||||||||||||||||||||||||||||||||||||||||||||||||||||||||||||||||
| Author | *The author of this computation has been verified* | ||||||||||||||||||||||||||||||||||||||||||||||||||||||||||||||||||||||||||||||||||||||||||||||||||||||||||||||||||||||||||||||||||||||||||||||||||||||||||||||||||||||||
| R Software Module | rwasp_twosampletests_mean.wasp | ||||||||||||||||||||||||||||||||||||||||||||||||||||||||||||||||||||||||||||||||||||||||||||||||||||||||||||||||||||||||||||||||||||||||||||||||||||||||||||||||||||||||
| Title produced by software | Paired and Unpaired Two Samples Tests about the Mean | ||||||||||||||||||||||||||||||||||||||||||||||||||||||||||||||||||||||||||||||||||||||||||||||||||||||||||||||||||||||||||||||||||||||||||||||||||||||||||||||||||||||||
| Date of computation | Mon, 01 Nov 2010 13:07:12 +0000 | ||||||||||||||||||||||||||||||||||||||||||||||||||||||||||||||||||||||||||||||||||||||||||||||||||||||||||||||||||||||||||||||||||||||||||||||||||||||||||||||||||||||||
| Cite this page as follows | Statistical Computations at FreeStatistics.org, Office for Research Development and Education, URL https://freestatistics.org/blog/index.php?v=date/2010/Nov/01/t1288616900dyflx4ebar1wbv4.htm/, Retrieved Tue, 26 May 2026 08:36:20 +0000 | ||||||||||||||||||||||||||||||||||||||||||||||||||||||||||||||||||||||||||||||||||||||||||||||||||||||||||||||||||||||||||||||||||||||||||||||||||||||||||||||||||||||||
| Statistical Computations at FreeStatistics.org, Office for Research Development and Education, URL https://freestatistics.org/blog/index.php?pk=90781, Retrieved Tue, 26 May 2026 08:36:20 +0000 | |||||||||||||||||||||||||||||||||||||||||||||||||||||||||||||||||||||||||||||||||||||||||||||||||||||||||||||||||||||||||||||||||||||||||||||||||||||||||||||||||||||||||
| QR Codes: | |||||||||||||||||||||||||||||||||||||||||||||||||||||||||||||||||||||||||||||||||||||||||||||||||||||||||||||||||||||||||||||||||||||||||||||||||||||||||||||||||||||||||
|
| |||||||||||||||||||||||||||||||||||||||||||||||||||||||||||||||||||||||||||||||||||||||||||||||||||||||||||||||||||||||||||||||||||||||||||||||||||||||||||||||||||||||||
| Original text written by user: | |||||||||||||||||||||||||||||||||||||||||||||||||||||||||||||||||||||||||||||||||||||||||||||||||||||||||||||||||||||||||||||||||||||||||||||||||||||||||||||||||||||||||
| IsPrivate? | This computation is/was private until 2010-11-03 | ||||||||||||||||||||||||||||||||||||||||||||||||||||||||||||||||||||||||||||||||||||||||||||||||||||||||||||||||||||||||||||||||||||||||||||||||||||||||||||||||||||||||
| User-defined keywords | |||||||||||||||||||||||||||||||||||||||||||||||||||||||||||||||||||||||||||||||||||||||||||||||||||||||||||||||||||||||||||||||||||||||||||||||||||||||||||||||||||||||||
| Estimated Impact | 1543 | ||||||||||||||||||||||||||||||||||||||||||||||||||||||||||||||||||||||||||||||||||||||||||||||||||||||||||||||||||||||||||||||||||||||||||||||||||||||||||||||||||||||||
Tree of Dependent Computations | |||||||||||||||||||||||||||||||||||||||||||||||||||||||||||||||||||||||||||||||||||||||||||||||||||||||||||||||||||||||||||||||||||||||||||||||||||||||||||||||||||||||||
| Family? (F = Feedback message, R = changed R code, M = changed R Module, P = changed Parameters, D = changed Data) | |||||||||||||||||||||||||||||||||||||||||||||||||||||||||||||||||||||||||||||||||||||||||||||||||||||||||||||||||||||||||||||||||||||||||||||||||||||||||||||||||||||||||
| - [Paired and Unpaired Two Samples Tests about the Mean] [] [2010-11-01 13:07:12] [d76b387543b13b5e3afd8ff9e5fdc89f] [Current] - P [Paired and Unpaired Two Samples Tests about the Mean] [ws5 q1 review] [2010-11-04 10:37:32] [c1a9f1d6a1a56eda57b5ddd6daa7a288] - R P [Paired and Unpaired Two Samples Tests about the Mean] [] [2010-11-08 07:47:00] [22937c5b58c14f6c22964f32d64ff823] - R [Paired and Unpaired Two Samples Tests about the Mean] [Question 1] [2011-10-26 09:09:06] [baac05fe722f73c103cc2d713fa5bd78] - PD [Paired and Unpaired Two Samples Tests about the Mean] [Paper - paired tw...] [2010-11-12 21:58:58] [6ff9fb24bdca608d2f4f1f9db3f6445e] - PD [Paired and Unpaired Two Samples Tests about the Mean] [computation18] [2010-11-16 11:54:47] [dc30d19c3bc2be07fe595ad36c2cf923] - R P [Paired and Unpaired Two Samples Tests about the Mean] [] [2010-11-18 14:42:55] [69c775ce4d55db2aa75a88e773e8d700] - R PD [Paired and Unpaired Two Samples Tests about the Mean] [] [2010-11-18 14:51:38] [69c775ce4d55db2aa75a88e773e8d700] - R PD [Paired and Unpaired Two Samples Tests about the Mean] [] [2010-11-18 15:00:20] [69c775ce4d55db2aa75a88e773e8d700] - R PD [Paired and Unpaired Two Samples Tests about the Mean] [Treatment F post ...] [2010-11-21 20:19:57] [97ad38b1c3b35a5feca8b85f7bc7b3ff] - D [Paired and Unpaired Two Samples Tests about the Mean] [treatment E post ...] [2010-11-21 20:24:17] [97ad38b1c3b35a5feca8b85f7bc7b3ff] - D [Paired and Unpaired Two Samples Tests about the Mean] [Treatment H post ...] [2010-11-21 20:26:45] [97ad38b1c3b35a5feca8b85f7bc7b3ff] - P [Paired and Unpaired Two Samples Tests about the Mean] [Workshop 2 - Vraag 1] [2010-11-22 21:57:44] [91de8b765895d6ee0c73f0d2e284be17] - P [Paired and Unpaired Two Samples Tests about the Mean] [Workshop 2 - Vraag 1] [2010-11-24 10:19:20] [91de8b765895d6ee0c73f0d2e284be17] - PD [Paired and Unpaired Two Samples Tests about the Mean] [Two Sample T-test...] [2010-12-07 10:17:26] [26379b86c25fbf0febe6a7a428e65173] - D [Paired and Unpaired Two Samples Tests about the Mean] [Paired Two Sampe ...] [2010-12-10 13:57:39] [26379b86c25fbf0febe6a7a428e65173] - PD [Paired and Unpaired Two Samples Tests about the Mean] [T-tests mannen en...] [2010-12-07 16:03:09] [95e8426e0df851c9330605aa1e892ab5] - PD [Paired and Unpaired Two Samples Tests about the Mean] [Paired Two Sample...] [2010-12-10 11:58:52] [26379b86c25fbf0febe6a7a428e65173] - PD [Paired and Unpaired Two Samples Tests about the Mean] [two sample tests] [2010-12-11 15:19:50] [39c51da0be01189e8a44eb69e891b7a1] - PD [Paired and Unpaired Two Samples Tests about the Mean] [Treatment CSWE] [2010-12-11 15:42:10] [39c51da0be01189e8a44eb69e891b7a1] - PD [Paired and Unpaired Two Samples Tests about the Mean] [Treatment C] [2010-12-11 15:50:15] [39c51da0be01189e8a44eb69e891b7a1] - PD [Paired and Unpaired Two Samples Tests about the Mean] [Treatment C] [2010-12-11 15:50:15] [39c51da0be01189e8a44eb69e891b7a1] - PD [Paired and Unpaired Two Samples Tests about the Mean] [Treatment C] [2010-12-11 15:50:15] [39c51da0be01189e8a44eb69e891b7a1] - P [Paired and Unpaired Two Samples Tests about the Mean] [Question 1] [2011-10-25 09:23:36] [07b2c5c51166cb60d3a449987e886a27] - R P [Paired and Unpaired Two Samples Tests about the Mean] [Two Sample t-test...] [2011-10-27 21:16:47] [7f54ec67e5798cc59f49446b41e2f221] - R P [Paired and Unpaired Two Samples Tests about the Mean] [Two Sample t-test...] [2011-10-27 21:25:30] [7f54ec67e5798cc59f49446b41e2f221] - P [Paired and Unpaired Two Samples Tests about the Mean] [] [2011-10-28 07:25:58] [86f7284edee3dbb8ea5c7e2dec87d892] - R P [Paired and Unpaired Two Samples Tests about the Mean] [] [2011-10-28 07:32:03] [86f7284edee3dbb8ea5c7e2dec87d892] - D [Paired and Unpaired Two Samples Tests about the Mean] [] [2011-10-28 07:53:37] [86f7284edee3dbb8ea5c7e2dec87d892] - R P [Paired and Unpaired Two Samples Tests about the Mean] [] [2011-10-28 07:54:27] [86f7284edee3dbb8ea5c7e2dec87d892] - R P [Paired and Unpaired Two Samples Tests about the Mean] [] [2011-10-28 07:54:27] [86f7284edee3dbb8ea5c7e2dec87d892] - PD [Paired and Unpaired Two Samples Tests about the Mean] [Dries Jansen - Pr...] [2011-10-28 09:16:48] [74b1e5a3104ff0b2404b2865a63336ad] - RM [Paired and Unpaired Two Samples Tests about the Mean] [] [2011-11-08 19:19:07] [74be16979710d4c4e7c6647856088456] - RM [Paired and Unpaired Two Samples Tests about the Mean] [Pre (E) - Post1(E)] [2011-11-08 19:19:54] [74be16979710d4c4e7c6647856088456] - RM [Paired and Unpaired Two Samples Tests about the Mean] [Pre (E) - Post1(E)] [2011-11-08 19:22:13] [74be16979710d4c4e7c6647856088456] - RM [Paired and Unpaired Two Samples Tests about the Mean] [Pre (E) - Post1(E)] [2011-11-08 19:22:51] [74be16979710d4c4e7c6647856088456] - P [Paired and Unpaired Two Samples Tests about the Mean] [workshop 5 task 1] [2011-10-30 13:25:17] [a9dc51245fb8ca00f931d89893d090c8] - R P [Paired and Unpaired Two Samples Tests about the Mean] [C5 V1a] [2011-10-31 16:29:34] [74be16979710d4c4e7c6647856088456] - R P [Paired and Unpaired Two Samples Tests about the Mean] [C5 V1b] [2011-10-31 16:39:06] [74be16979710d4c4e7c6647856088456] - RMP [Paired and Unpaired Two Samples Tests about the Mean] [C4 V1c] [2011-10-31 17:10:14] [74be16979710d4c4e7c6647856088456] - P [Paired and Unpaired Two Samples Tests about the Mean] [task 5.1] [2011-11-01 16:02:39] [d1ce18d003fa52f731d1c3ce8b58d5f9] - P [Paired and Unpaired Two Samples Tests about the Mean] [task 5.1] [2011-11-01 16:04:23] [d1ce18d003fa52f731d1c3ce8b58d5f9] - PD [Paired and Unpaired Two Samples Tests about the Mean] [] [2011-11-01 16:05:20] [ee8c3a74bf3b349877806e9a50913c60] - PD [Paired and Unpaired Two Samples Tests about the Mean] [task 5.2] [2011-11-01 16:15:16] [d1ce18d003fa52f731d1c3ce8b58d5f9] - PD [Paired and Unpaired Two Samples Tests about the Mean] [task 5.3] [2011-11-01 16:20:37] [d1ce18d003fa52f731d1c3ce8b58d5f9] - PD [Paired and Unpaired Two Samples Tests about the Mean] [task 5.5.1] [2011-11-01 16:38:40] [d1ce18d003fa52f731d1c3ce8b58d5f9] - PD [Paired and Unpaired Two Samples Tests about the Mean] [task 5.5.2] [2011-11-01 16:41:11] [d1ce18d003fa52f731d1c3ce8b58d5f9] - PD [Paired and Unpaired Two Samples Tests about the Mean] [task 5.5.3] [2011-11-01 16:43:02] [d1ce18d003fa52f731d1c3ce8b58d5f9] - P [Paired and Unpaired Two Samples Tests about the Mean] [] [2011-11-02 12:30:16] [ec2187f7727da5d5d939740b21b8b68a] [Truncated] | |||||||||||||||||||||||||||||||||||||||||||||||||||||||||||||||||||||||||||||||||||||||||||||||||||||||||||||||||||||||||||||||||||||||||||||||||||||||||||||||||||||||||
| Feedback Forum | |||||||||||||||||||||||||||||||||||||||||||||||||||||||||||||||||||||||||||||||||||||||||||||||||||||||||||||||||||||||||||||||||||||||||||||||||||||||||||||||||||||||||
Post a new message | |||||||||||||||||||||||||||||||||||||||||||||||||||||||||||||||||||||||||||||||||||||||||||||||||||||||||||||||||||||||||||||||||||||||||||||||||||||||||||||||||||||||||
Dataset | |||||||||||||||||||||||||||||||||||||||||||||||||||||||||||||||||||||||||||||||||||||||||||||||||||||||||||||||||||||||||||||||||||||||||||||||||||||||||||||||||||||||||
| Dataseries X: | |||||||||||||||||||||||||||||||||||||||||||||||||||||||||||||||||||||||||||||||||||||||||||||||||||||||||||||||||||||||||||||||||||||||||||||||||||||||||||||||||||||||||
0 1 0 1 1 1 1 1 1 1 1 1 1 1 0 0 0 1 0 1 1 1 1 1 0 0 0 1 1 1 0 1 0 0 0 1 0 1 0 1 0 1 0 0 0 0 0 1 1 1 1 1 1 0 0 0 0 1 0 1 0 0 1 1 1 1 | |||||||||||||||||||||||||||||||||||||||||||||||||||||||||||||||||||||||||||||||||||||||||||||||||||||||||||||||||||||||||||||||||||||||||||||||||||||||||||||||||||||||||
Tables (Output of Computation) | |||||||||||||||||||||||||||||||||||||||||||||||||||||||||||||||||||||||||||||||||||||||||||||||||||||||||||||||||||||||||||||||||||||||||||||||||||||||||||||||||||||||||
| |||||||||||||||||||||||||||||||||||||||||||||||||||||||||||||||||||||||||||||||||||||||||||||||||||||||||||||||||||||||||||||||||||||||||||||||||||||||||||||||||||||||||
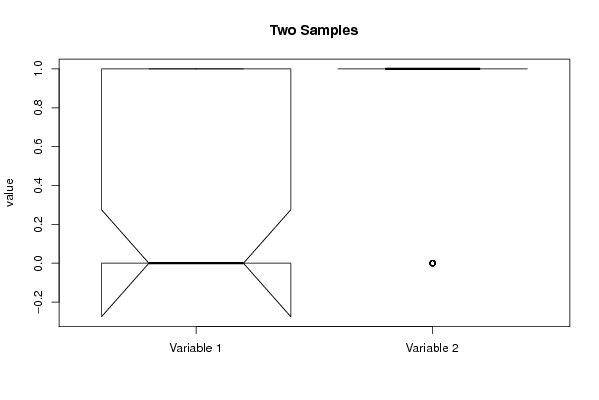
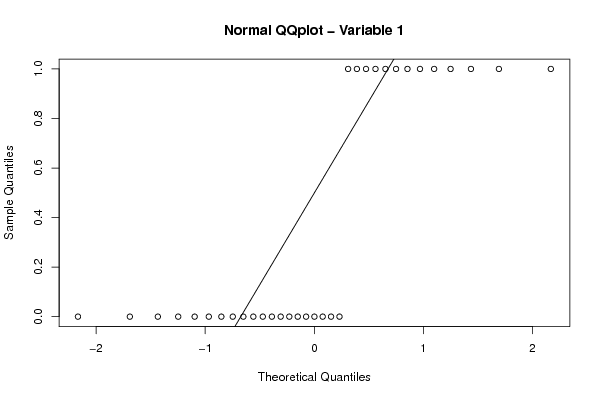
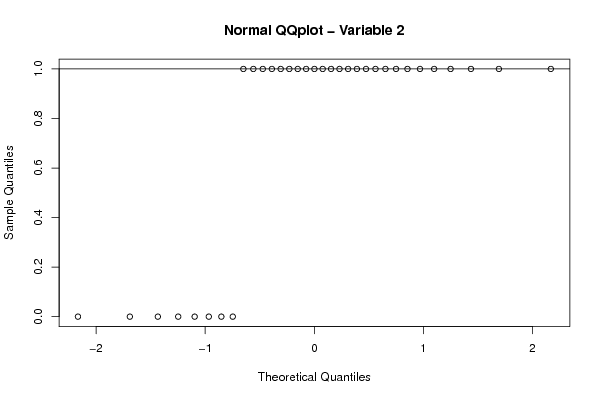
Figures (Output of Computation) | |||||||||||||||||||||||||||||||||||||||||||||||||||||||||||||||||||||||||||||||||||||||||||||||||||||||||||||||||||||||||||||||||||||||||||||||||||||||||||||||||||||||||
Input Parameters & R Code | |||||||||||||||||||||||||||||||||||||||||||||||||||||||||||||||||||||||||||||||||||||||||||||||||||||||||||||||||||||||||||||||||||||||||||||||||||||||||||||||||||||||||
| Parameters (Session): | |||||||||||||||||||||||||||||||||||||||||||||||||||||||||||||||||||||||||||||||||||||||||||||||||||||||||||||||||||||||||||||||||||||||||||||||||||||||||||||||||||||||||
| par1 = 1 ; par2 = 2 ; par3 = TRUE ; | |||||||||||||||||||||||||||||||||||||||||||||||||||||||||||||||||||||||||||||||||||||||||||||||||||||||||||||||||||||||||||||||||||||||||||||||||||||||||||||||||||||||||
| Parameters (R input): | |||||||||||||||||||||||||||||||||||||||||||||||||||||||||||||||||||||||||||||||||||||||||||||||||||||||||||||||||||||||||||||||||||||||||||||||||||||||||||||||||||||||||
| par1 = 1 ; par2 = 2 ; par3 = 0.95 ; par4 = two.sided ; par5 = paired ; par6 = 0.0 ; | |||||||||||||||||||||||||||||||||||||||||||||||||||||||||||||||||||||||||||||||||||||||||||||||||||||||||||||||||||||||||||||||||||||||||||||||||||||||||||||||||||||||||
| R code (references can be found in the software module): | |||||||||||||||||||||||||||||||||||||||||||||||||||||||||||||||||||||||||||||||||||||||||||||||||||||||||||||||||||||||||||||||||||||||||||||||||||||||||||||||||||||||||
par1 <- as.numeric(par1) #column number of first sample | |||||||||||||||||||||||||||||||||||||||||||||||||||||||||||||||||||||||||||||||||||||||||||||||||||||||||||||||||||||||||||||||||||||||||||||||||||||||||||||||||||||||||