Free Statistics

of Irreproducible Research!

Author's title

Author*Unverified author*
R Software Modulerwasp_autocorrelation.wasp
Title produced by software(Partial) Autocorrelation Function
Date of computationThu, 27 May 2010 13:20:39 +0000
Cite this page as followsStatistical Computations at FreeStatistics.org, Office for Research Development and Education, URL https://freestatistics.org/blog/index.php?v=date/2010/May/27/t1274966498xpxz6mswrhujg0w.htm/, Retrieved Sat, 27 Apr 2024 16:41:28 +0000
Statistical Computations at FreeStatistics.org, Office for Research Development and Education, URL https://freestatistics.org/blog/index.php?pk=76604, Retrieved Sat, 27 Apr 2024 16:41:28 +0000
QR Codes:

Original text written by user:
IsPrivate?No (this computation is public)
User-defined keywords
Estimated Impact180
Family? (F = Feedback message, R = changed R code, M = changed R Module, P = changed Parameters, D = changed Data)
-     [(Partial) Autocorrelation Function] [Autocorrelatie wi...] [2010-05-03 16:01:50] [05bbf10299dcd1da03eee55b39d86f8c]
-    D  [(Partial) Autocorrelation Function] [Autocorrelatie wi...] [2010-05-27 13:19:13] [05bbf10299dcd1da03eee55b39d86f8c]
-           [(Partial) Autocorrelation Function] [Autocorrelatie wi...] [2010-05-27 13:20:39] [d4eb12efc488666eba544481d350541e] [Current]
Feedback Forum

Post a new message
Dataseries X:
1.1591
1.1203
1.0886
1.0701
1.0630
1.0377
1.0370
1.0605
1.0497
1.0706
1.0328
1.0110
1.0131
0.9834
0.9643
0.9449
0.9059
0.9505
0.9386
0.9045
0.8695
0.8525
0.8552
0.8983
0.9376
0.9205
0.9083
0.8925
0.8753
0.8530
0.8615
0.9014
0.9114
0.9050
0.8883
0.8912
0.8832
0.8707
0.8766
0.8860
0.9170
0.9561
0.9935
0.9781
0.9806
0.9812
1.0013
1.0194
1.0622
1.0785
1.0797
1.0862
1.1556
1.1674
1.1365
1.1155
1.1267
1.1714
1.1710
1.2298
1.2638
1.2640
1.2261
1.1989
1.2000
1.2146
1.2266
1.2191
1.2224
1.2507
1.2997
1.3406
1.3123
1.3013
1.3185
1.2943
1.2697
1.2155
1.2041
1.2295
1.2234
1.2022
1.1789
1.1861
1.2126
1.1940
1.2028
1.2273
1.2767
1.2661
1.2681
1.2810
1.2722
1.2617
1.2888
1.3205
1.2993
1.3080
1.3246
1.3513
1.3518
1.3421
1.3726
1.3626
1.3910
1.4233
1.4683
1.4559
1.4728
1.4759
1.5520
1.5754
1.5554
1.5562
1.5759
1.4955
1.4342
1.3266
1.2744
1.3511
1.3244
1.2797
1.3050
1.3199
1.3646
1.4014
1.4092
1.4266
1.4575
1.4821
1.4908
1.4579


Summary of computational transaction
Raw Inputview raw input (R code)
Raw Outputview raw output of R engine
Computing time2 seconds
R Server'George Udny Yule' @ 72.249.76.132

\begin{tabular}{lllllllll}
\hline
Summary of computational transaction \tabularnewline
Raw Input & view raw input (R code)  \tabularnewline
Raw Output & view raw output of R engine  \tabularnewline
Computing time & 2 seconds \tabularnewline
R Server & 'George Udny Yule' @ 72.249.76.132 \tabularnewline
\hline
\end{tabular}
%Source: https://freestatistics.org/blog/index.php?pk=76604&T=0

[TABLE]
[ROW][C]Summary of computational transaction[/C][/ROW]
[ROW][C]Raw Input[/C][C]view raw input (R code) [/C][/ROW]
[ROW][C]Raw Output[/C][C]view raw output of R engine [/C][/ROW]
[ROW][C]Computing time[/C][C]2 seconds[/C][/ROW]
[ROW][C]R Server[/C][C]'George Udny Yule' @ 72.249.76.132[/C][/ROW]
[/TABLE]
Source: https://freestatistics.org/blog/index.php?pk=76604&T=0

Globally Unique Identifier (entire table): ba.freestatistics.org/blog/index.php?pk=76604&T=0

As an alternative you can also use a QR Code:  

The GUIDs for individual cells are displayed in the table below:

Summary of computational transaction
Raw Inputview raw input (R code)
Raw Outputview raw output of R engine
Computing time2 seconds
R Server'George Udny Yule' @ 72.249.76.132


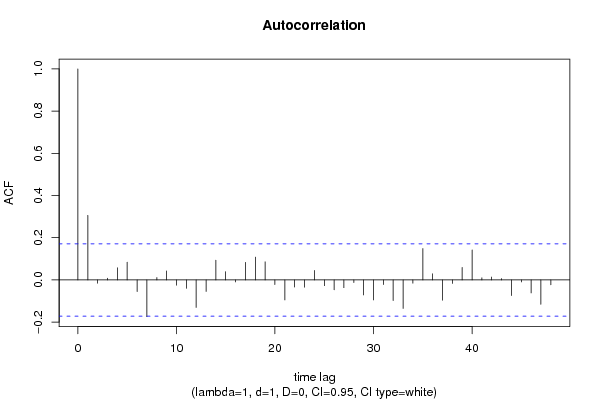
Autocorrelation Function
Time lag kACF(k)T-STATP-value
10.3058333.50040.000318
2-0.015411-0.17640.430133
30.0080710.09240.463268
40.0569840.65220.257704
50.0841350.9630.168668
6-0.055647-0.63690.262646
7-0.174327-1.99530.024044
80.0109670.12550.450152
90.0422390.48350.314791
10-0.024925-0.28530.38794
11-0.04009-0.45890.323551
12-0.130756-1.49660.068455
13-0.054915-0.62850.265375
140.0934261.06930.143449
150.0391290.44790.3275
16-0.009768-0.11180.455579
170.0829990.950.17194
180.1079131.23510.109497
190.0856320.98010.16442
20-0.022343-0.25570.39928
21-0.095062-1.0880.139288
22-0.0339-0.3880.349322
23-0.034704-0.39720.345931
240.0449680.51470.303819
25-0.027539-0.31520.376556
26-0.046845-0.53620.296375
27-0.037005-0.42350.336295
28-0.012811-0.14660.441823
29-0.071352-0.81670.207802
30-0.094937-1.08660.139604
31-0.022336-0.25560.399313
32-0.098207-1.1240.131528
33-0.135155-1.54690.062148
34-0.015604-0.17860.429267
350.1482541.69680.046051
360.0289220.3310.370576
37-0.096556-1.10510.135562
38-0.017077-0.19550.422669
390.05910.67640.249979
400.1419411.62460.053327
410.0099160.11350.454905
420.0134230.15360.439069
430.0062620.07170.471484
44-0.074527-0.8530.197607
45-0.009951-0.11390.454747
46-0.061666-0.70580.240782
47-0.115822-1.32560.093633
48-0.023614-0.27030.393686

\begin{tabular}{lllllllll}
\hline
Autocorrelation Function \tabularnewline
Time lag k & ACF(k) & T-STAT & P-value \tabularnewline
1 & 0.305833 & 3.5004 & 0.000318 \tabularnewline
2 & -0.015411 & -0.1764 & 0.430133 \tabularnewline
3 & 0.008071 & 0.0924 & 0.463268 \tabularnewline
4 & 0.056984 & 0.6522 & 0.257704 \tabularnewline
5 & 0.084135 & 0.963 & 0.168668 \tabularnewline
6 & -0.055647 & -0.6369 & 0.262646 \tabularnewline
7 & -0.174327 & -1.9953 & 0.024044 \tabularnewline
8 & 0.010967 & 0.1255 & 0.450152 \tabularnewline
9 & 0.042239 & 0.4835 & 0.314791 \tabularnewline
10 & -0.024925 & -0.2853 & 0.38794 \tabularnewline
11 & -0.04009 & -0.4589 & 0.323551 \tabularnewline
12 & -0.130756 & -1.4966 & 0.068455 \tabularnewline
13 & -0.054915 & -0.6285 & 0.265375 \tabularnewline
14 & 0.093426 & 1.0693 & 0.143449 \tabularnewline
15 & 0.039129 & 0.4479 & 0.3275 \tabularnewline
16 & -0.009768 & -0.1118 & 0.455579 \tabularnewline
17 & 0.082999 & 0.95 & 0.17194 \tabularnewline
18 & 0.107913 & 1.2351 & 0.109497 \tabularnewline
19 & 0.085632 & 0.9801 & 0.16442 \tabularnewline
20 & -0.022343 & -0.2557 & 0.39928 \tabularnewline
21 & -0.095062 & -1.088 & 0.139288 \tabularnewline
22 & -0.0339 & -0.388 & 0.349322 \tabularnewline
23 & -0.034704 & -0.3972 & 0.345931 \tabularnewline
24 & 0.044968 & 0.5147 & 0.303819 \tabularnewline
25 & -0.027539 & -0.3152 & 0.376556 \tabularnewline
26 & -0.046845 & -0.5362 & 0.296375 \tabularnewline
27 & -0.037005 & -0.4235 & 0.336295 \tabularnewline
28 & -0.012811 & -0.1466 & 0.441823 \tabularnewline
29 & -0.071352 & -0.8167 & 0.207802 \tabularnewline
30 & -0.094937 & -1.0866 & 0.139604 \tabularnewline
31 & -0.022336 & -0.2556 & 0.399313 \tabularnewline
32 & -0.098207 & -1.124 & 0.131528 \tabularnewline
33 & -0.135155 & -1.5469 & 0.062148 \tabularnewline
34 & -0.015604 & -0.1786 & 0.429267 \tabularnewline
35 & 0.148254 & 1.6968 & 0.046051 \tabularnewline
36 & 0.028922 & 0.331 & 0.370576 \tabularnewline
37 & -0.096556 & -1.1051 & 0.135562 \tabularnewline
38 & -0.017077 & -0.1955 & 0.422669 \tabularnewline
39 & 0.0591 & 0.6764 & 0.249979 \tabularnewline
40 & 0.141941 & 1.6246 & 0.053327 \tabularnewline
41 & 0.009916 & 0.1135 & 0.454905 \tabularnewline
42 & 0.013423 & 0.1536 & 0.439069 \tabularnewline
43 & 0.006262 & 0.0717 & 0.471484 \tabularnewline
44 & -0.074527 & -0.853 & 0.197607 \tabularnewline
45 & -0.009951 & -0.1139 & 0.454747 \tabularnewline
46 & -0.061666 & -0.7058 & 0.240782 \tabularnewline
47 & -0.115822 & -1.3256 & 0.093633 \tabularnewline
48 & -0.023614 & -0.2703 & 0.393686 \tabularnewline
\hline
\end{tabular}
%Source: https://freestatistics.org/blog/index.php?pk=76604&T=1

[TABLE]
[ROW][C]Autocorrelation Function[/C][/ROW]
[ROW][C]Time lag k[/C][C]ACF(k)[/C][C]T-STAT[/C][C]P-value[/C][/ROW]
[ROW][C]1[/C][C]0.305833[/C][C]3.5004[/C][C]0.000318[/C][/ROW]
[ROW][C]2[/C][C]-0.015411[/C][C]-0.1764[/C][C]0.430133[/C][/ROW]
[ROW][C]3[/C][C]0.008071[/C][C]0.0924[/C][C]0.463268[/C][/ROW]
[ROW][C]4[/C][C]0.056984[/C][C]0.6522[/C][C]0.257704[/C][/ROW]
[ROW][C]5[/C][C]0.084135[/C][C]0.963[/C][C]0.168668[/C][/ROW]
[ROW][C]6[/C][C]-0.055647[/C][C]-0.6369[/C][C]0.262646[/C][/ROW]
[ROW][C]7[/C][C]-0.174327[/C][C]-1.9953[/C][C]0.024044[/C][/ROW]
[ROW][C]8[/C][C]0.010967[/C][C]0.1255[/C][C]0.450152[/C][/ROW]
[ROW][C]9[/C][C]0.042239[/C][C]0.4835[/C][C]0.314791[/C][/ROW]
[ROW][C]10[/C][C]-0.024925[/C][C]-0.2853[/C][C]0.38794[/C][/ROW]
[ROW][C]11[/C][C]-0.04009[/C][C]-0.4589[/C][C]0.323551[/C][/ROW]
[ROW][C]12[/C][C]-0.130756[/C][C]-1.4966[/C][C]0.068455[/C][/ROW]
[ROW][C]13[/C][C]-0.054915[/C][C]-0.6285[/C][C]0.265375[/C][/ROW]
[ROW][C]14[/C][C]0.093426[/C][C]1.0693[/C][C]0.143449[/C][/ROW]
[ROW][C]15[/C][C]0.039129[/C][C]0.4479[/C][C]0.3275[/C][/ROW]
[ROW][C]16[/C][C]-0.009768[/C][C]-0.1118[/C][C]0.455579[/C][/ROW]
[ROW][C]17[/C][C]0.082999[/C][C]0.95[/C][C]0.17194[/C][/ROW]
[ROW][C]18[/C][C]0.107913[/C][C]1.2351[/C][C]0.109497[/C][/ROW]
[ROW][C]19[/C][C]0.085632[/C][C]0.9801[/C][C]0.16442[/C][/ROW]
[ROW][C]20[/C][C]-0.022343[/C][C]-0.2557[/C][C]0.39928[/C][/ROW]
[ROW][C]21[/C][C]-0.095062[/C][C]-1.088[/C][C]0.139288[/C][/ROW]
[ROW][C]22[/C][C]-0.0339[/C][C]-0.388[/C][C]0.349322[/C][/ROW]
[ROW][C]23[/C][C]-0.034704[/C][C]-0.3972[/C][C]0.345931[/C][/ROW]
[ROW][C]24[/C][C]0.044968[/C][C]0.5147[/C][C]0.303819[/C][/ROW]
[ROW][C]25[/C][C]-0.027539[/C][C]-0.3152[/C][C]0.376556[/C][/ROW]
[ROW][C]26[/C][C]-0.046845[/C][C]-0.5362[/C][C]0.296375[/C][/ROW]
[ROW][C]27[/C][C]-0.037005[/C][C]-0.4235[/C][C]0.336295[/C][/ROW]
[ROW][C]28[/C][C]-0.012811[/C][C]-0.1466[/C][C]0.441823[/C][/ROW]
[ROW][C]29[/C][C]-0.071352[/C][C]-0.8167[/C][C]0.207802[/C][/ROW]
[ROW][C]30[/C][C]-0.094937[/C][C]-1.0866[/C][C]0.139604[/C][/ROW]
[ROW][C]31[/C][C]-0.022336[/C][C]-0.2556[/C][C]0.399313[/C][/ROW]
[ROW][C]32[/C][C]-0.098207[/C][C]-1.124[/C][C]0.131528[/C][/ROW]
[ROW][C]33[/C][C]-0.135155[/C][C]-1.5469[/C][C]0.062148[/C][/ROW]
[ROW][C]34[/C][C]-0.015604[/C][C]-0.1786[/C][C]0.429267[/C][/ROW]
[ROW][C]35[/C][C]0.148254[/C][C]1.6968[/C][C]0.046051[/C][/ROW]
[ROW][C]36[/C][C]0.028922[/C][C]0.331[/C][C]0.370576[/C][/ROW]
[ROW][C]37[/C][C]-0.096556[/C][C]-1.1051[/C][C]0.135562[/C][/ROW]
[ROW][C]38[/C][C]-0.017077[/C][C]-0.1955[/C][C]0.422669[/C][/ROW]
[ROW][C]39[/C][C]0.0591[/C][C]0.6764[/C][C]0.249979[/C][/ROW]
[ROW][C]40[/C][C]0.141941[/C][C]1.6246[/C][C]0.053327[/C][/ROW]
[ROW][C]41[/C][C]0.009916[/C][C]0.1135[/C][C]0.454905[/C][/ROW]
[ROW][C]42[/C][C]0.013423[/C][C]0.1536[/C][C]0.439069[/C][/ROW]
[ROW][C]43[/C][C]0.006262[/C][C]0.0717[/C][C]0.471484[/C][/ROW]
[ROW][C]44[/C][C]-0.074527[/C][C]-0.853[/C][C]0.197607[/C][/ROW]
[ROW][C]45[/C][C]-0.009951[/C][C]-0.1139[/C][C]0.454747[/C][/ROW]
[ROW][C]46[/C][C]-0.061666[/C][C]-0.7058[/C][C]0.240782[/C][/ROW]
[ROW][C]47[/C][C]-0.115822[/C][C]-1.3256[/C][C]0.093633[/C][/ROW]
[ROW][C]48[/C][C]-0.023614[/C][C]-0.2703[/C][C]0.393686[/C][/ROW]
[/TABLE]
Source: https://freestatistics.org/blog/index.php?pk=76604&T=1

Globally Unique Identifier (entire table): ba.freestatistics.org/blog/index.php?pk=76604&T=1

As an alternative you can also use a QR Code:  

The GUIDs for individual cells are displayed in the table below:

Autocorrelation Function
Time lag kACF(k)T-STATP-value
10.3058333.50040.000318
2-0.015411-0.17640.430133
30.0080710.09240.463268
40.0569840.65220.257704
50.0841350.9630.168668
6-0.055647-0.63690.262646
7-0.174327-1.99530.024044
80.0109670.12550.450152
90.0422390.48350.314791
10-0.024925-0.28530.38794
11-0.04009-0.45890.323551
12-0.130756-1.49660.068455
13-0.054915-0.62850.265375
140.0934261.06930.143449
150.0391290.44790.3275
16-0.009768-0.11180.455579
170.0829990.950.17194
180.1079131.23510.109497
190.0856320.98010.16442
20-0.022343-0.25570.39928
21-0.095062-1.0880.139288
22-0.0339-0.3880.349322
23-0.034704-0.39720.345931
240.0449680.51470.303819
25-0.027539-0.31520.376556
26-0.046845-0.53620.296375
27-0.037005-0.42350.336295
28-0.012811-0.14660.441823
29-0.071352-0.81670.207802
30-0.094937-1.08660.139604
31-0.022336-0.25560.399313
32-0.098207-1.1240.131528
33-0.135155-1.54690.062148
34-0.015604-0.17860.429267
350.1482541.69680.046051
360.0289220.3310.370576
37-0.096556-1.10510.135562
38-0.017077-0.19550.422669
390.05910.67640.249979
400.1419411.62460.053327
410.0099160.11350.454905
420.0134230.15360.439069
430.0062620.07170.471484
44-0.074527-0.8530.197607
45-0.009951-0.11390.454747
46-0.061666-0.70580.240782
47-0.115822-1.32560.093633
48-0.023614-0.27030.393686


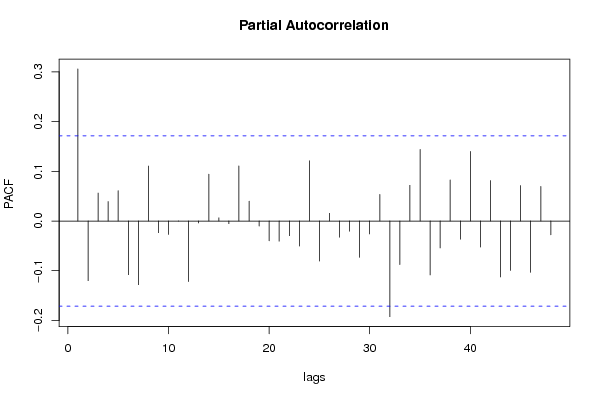
Partial Autocorrelation Function
Time lag kPACF(k)T-STATP-value
10.3058333.50040.000318
2-0.120186-1.37560.085648
30.0560880.6420.261011
40.0391470.44810.327428
50.060860.69660.243652
6-0.107931-1.23530.109459
7-0.128089-1.4660.072516
80.1105621.26540.10398
9-0.023544-0.26950.393995
10-0.027101-0.31020.378456
11-0.000213-0.00240.499028
12-0.12171-1.3930.082984
13-0.003986-0.04560.481842
140.0941141.07720.141688
150.0063280.07240.471187
16-0.00553-0.06330.474812
170.1107491.26760.103598
180.0397750.45520.324843
19-0.010078-0.11540.454171
20-0.039798-0.45550.32475
21-0.040505-0.46360.321853
22-0.029524-0.33790.367982
23-0.050445-0.57740.28234
240.1209561.38440.084294
25-0.080585-0.92230.179024
260.0154880.17730.429784
27-0.032459-0.37150.355431
28-0.020565-0.23540.40714
29-0.073014-0.83570.202429
30-0.026155-0.29940.382572
310.0533590.61070.271223
32-0.192401-2.20210.014703
33-0.087522-1.00170.159159
340.0718090.82190.206315
350.1438581.64650.051026
36-0.108462-1.24140.108337
37-0.054276-0.62120.267768
380.0824970.94420.173399
39-0.036636-0.41930.337834
400.1399371.60160.055821
41-0.052374-0.59940.274955
420.0812280.92970.177119
43-0.112507-1.28770.100059
44-0.099461-1.13840.128518
450.071350.81660.207809
46-0.103243-1.18170.119739
470.0695920.79650.213587
48-0.027841-0.31870.37525

\begin{tabular}{lllllllll}
\hline
Partial Autocorrelation Function \tabularnewline
Time lag k & PACF(k) & T-STAT & P-value \tabularnewline
1 & 0.305833 & 3.5004 & 0.000318 \tabularnewline
2 & -0.120186 & -1.3756 & 0.085648 \tabularnewline
3 & 0.056088 & 0.642 & 0.261011 \tabularnewline
4 & 0.039147 & 0.4481 & 0.327428 \tabularnewline
5 & 0.06086 & 0.6966 & 0.243652 \tabularnewline
6 & -0.107931 & -1.2353 & 0.109459 \tabularnewline
7 & -0.128089 & -1.466 & 0.072516 \tabularnewline
8 & 0.110562 & 1.2654 & 0.10398 \tabularnewline
9 & -0.023544 & -0.2695 & 0.393995 \tabularnewline
10 & -0.027101 & -0.3102 & 0.378456 \tabularnewline
11 & -0.000213 & -0.0024 & 0.499028 \tabularnewline
12 & -0.12171 & -1.393 & 0.082984 \tabularnewline
13 & -0.003986 & -0.0456 & 0.481842 \tabularnewline
14 & 0.094114 & 1.0772 & 0.141688 \tabularnewline
15 & 0.006328 & 0.0724 & 0.471187 \tabularnewline
16 & -0.00553 & -0.0633 & 0.474812 \tabularnewline
17 & 0.110749 & 1.2676 & 0.103598 \tabularnewline
18 & 0.039775 & 0.4552 & 0.324843 \tabularnewline
19 & -0.010078 & -0.1154 & 0.454171 \tabularnewline
20 & -0.039798 & -0.4555 & 0.32475 \tabularnewline
21 & -0.040505 & -0.4636 & 0.321853 \tabularnewline
22 & -0.029524 & -0.3379 & 0.367982 \tabularnewline
23 & -0.050445 & -0.5774 & 0.28234 \tabularnewline
24 & 0.120956 & 1.3844 & 0.084294 \tabularnewline
25 & -0.080585 & -0.9223 & 0.179024 \tabularnewline
26 & 0.015488 & 0.1773 & 0.429784 \tabularnewline
27 & -0.032459 & -0.3715 & 0.355431 \tabularnewline
28 & -0.020565 & -0.2354 & 0.40714 \tabularnewline
29 & -0.073014 & -0.8357 & 0.202429 \tabularnewline
30 & -0.026155 & -0.2994 & 0.382572 \tabularnewline
31 & 0.053359 & 0.6107 & 0.271223 \tabularnewline
32 & -0.192401 & -2.2021 & 0.014703 \tabularnewline
33 & -0.087522 & -1.0017 & 0.159159 \tabularnewline
34 & 0.071809 & 0.8219 & 0.206315 \tabularnewline
35 & 0.143858 & 1.6465 & 0.051026 \tabularnewline
36 & -0.108462 & -1.2414 & 0.108337 \tabularnewline
37 & -0.054276 & -0.6212 & 0.267768 \tabularnewline
38 & 0.082497 & 0.9442 & 0.173399 \tabularnewline
39 & -0.036636 & -0.4193 & 0.337834 \tabularnewline
40 & 0.139937 & 1.6016 & 0.055821 \tabularnewline
41 & -0.052374 & -0.5994 & 0.274955 \tabularnewline
42 & 0.081228 & 0.9297 & 0.177119 \tabularnewline
43 & -0.112507 & -1.2877 & 0.100059 \tabularnewline
44 & -0.099461 & -1.1384 & 0.128518 \tabularnewline
45 & 0.07135 & 0.8166 & 0.207809 \tabularnewline
46 & -0.103243 & -1.1817 & 0.119739 \tabularnewline
47 & 0.069592 & 0.7965 & 0.213587 \tabularnewline
48 & -0.027841 & -0.3187 & 0.37525 \tabularnewline
\hline
\end{tabular}
%Source: https://freestatistics.org/blog/index.php?pk=76604&T=2

[TABLE]
[ROW][C]Partial Autocorrelation Function[/C][/ROW]
[ROW][C]Time lag k[/C][C]PACF(k)[/C][C]T-STAT[/C][C]P-value[/C][/ROW]
[ROW][C]1[/C][C]0.305833[/C][C]3.5004[/C][C]0.000318[/C][/ROW]
[ROW][C]2[/C][C]-0.120186[/C][C]-1.3756[/C][C]0.085648[/C][/ROW]
[ROW][C]3[/C][C]0.056088[/C][C]0.642[/C][C]0.261011[/C][/ROW]
[ROW][C]4[/C][C]0.039147[/C][C]0.4481[/C][C]0.327428[/C][/ROW]
[ROW][C]5[/C][C]0.06086[/C][C]0.6966[/C][C]0.243652[/C][/ROW]
[ROW][C]6[/C][C]-0.107931[/C][C]-1.2353[/C][C]0.109459[/C][/ROW]
[ROW][C]7[/C][C]-0.128089[/C][C]-1.466[/C][C]0.072516[/C][/ROW]
[ROW][C]8[/C][C]0.110562[/C][C]1.2654[/C][C]0.10398[/C][/ROW]
[ROW][C]9[/C][C]-0.023544[/C][C]-0.2695[/C][C]0.393995[/C][/ROW]
[ROW][C]10[/C][C]-0.027101[/C][C]-0.3102[/C][C]0.378456[/C][/ROW]
[ROW][C]11[/C][C]-0.000213[/C][C]-0.0024[/C][C]0.499028[/C][/ROW]
[ROW][C]12[/C][C]-0.12171[/C][C]-1.393[/C][C]0.082984[/C][/ROW]
[ROW][C]13[/C][C]-0.003986[/C][C]-0.0456[/C][C]0.481842[/C][/ROW]
[ROW][C]14[/C][C]0.094114[/C][C]1.0772[/C][C]0.141688[/C][/ROW]
[ROW][C]15[/C][C]0.006328[/C][C]0.0724[/C][C]0.471187[/C][/ROW]
[ROW][C]16[/C][C]-0.00553[/C][C]-0.0633[/C][C]0.474812[/C][/ROW]
[ROW][C]17[/C][C]0.110749[/C][C]1.2676[/C][C]0.103598[/C][/ROW]
[ROW][C]18[/C][C]0.039775[/C][C]0.4552[/C][C]0.324843[/C][/ROW]
[ROW][C]19[/C][C]-0.010078[/C][C]-0.1154[/C][C]0.454171[/C][/ROW]
[ROW][C]20[/C][C]-0.039798[/C][C]-0.4555[/C][C]0.32475[/C][/ROW]
[ROW][C]21[/C][C]-0.040505[/C][C]-0.4636[/C][C]0.321853[/C][/ROW]
[ROW][C]22[/C][C]-0.029524[/C][C]-0.3379[/C][C]0.367982[/C][/ROW]
[ROW][C]23[/C][C]-0.050445[/C][C]-0.5774[/C][C]0.28234[/C][/ROW]
[ROW][C]24[/C][C]0.120956[/C][C]1.3844[/C][C]0.084294[/C][/ROW]
[ROW][C]25[/C][C]-0.080585[/C][C]-0.9223[/C][C]0.179024[/C][/ROW]
[ROW][C]26[/C][C]0.015488[/C][C]0.1773[/C][C]0.429784[/C][/ROW]
[ROW][C]27[/C][C]-0.032459[/C][C]-0.3715[/C][C]0.355431[/C][/ROW]
[ROW][C]28[/C][C]-0.020565[/C][C]-0.2354[/C][C]0.40714[/C][/ROW]
[ROW][C]29[/C][C]-0.073014[/C][C]-0.8357[/C][C]0.202429[/C][/ROW]
[ROW][C]30[/C][C]-0.026155[/C][C]-0.2994[/C][C]0.382572[/C][/ROW]
[ROW][C]31[/C][C]0.053359[/C][C]0.6107[/C][C]0.271223[/C][/ROW]
[ROW][C]32[/C][C]-0.192401[/C][C]-2.2021[/C][C]0.014703[/C][/ROW]
[ROW][C]33[/C][C]-0.087522[/C][C]-1.0017[/C][C]0.159159[/C][/ROW]
[ROW][C]34[/C][C]0.071809[/C][C]0.8219[/C][C]0.206315[/C][/ROW]
[ROW][C]35[/C][C]0.143858[/C][C]1.6465[/C][C]0.051026[/C][/ROW]
[ROW][C]36[/C][C]-0.108462[/C][C]-1.2414[/C][C]0.108337[/C][/ROW]
[ROW][C]37[/C][C]-0.054276[/C][C]-0.6212[/C][C]0.267768[/C][/ROW]
[ROW][C]38[/C][C]0.082497[/C][C]0.9442[/C][C]0.173399[/C][/ROW]
[ROW][C]39[/C][C]-0.036636[/C][C]-0.4193[/C][C]0.337834[/C][/ROW]
[ROW][C]40[/C][C]0.139937[/C][C]1.6016[/C][C]0.055821[/C][/ROW]
[ROW][C]41[/C][C]-0.052374[/C][C]-0.5994[/C][C]0.274955[/C][/ROW]
[ROW][C]42[/C][C]0.081228[/C][C]0.9297[/C][C]0.177119[/C][/ROW]
[ROW][C]43[/C][C]-0.112507[/C][C]-1.2877[/C][C]0.100059[/C][/ROW]
[ROW][C]44[/C][C]-0.099461[/C][C]-1.1384[/C][C]0.128518[/C][/ROW]
[ROW][C]45[/C][C]0.07135[/C][C]0.8166[/C][C]0.207809[/C][/ROW]
[ROW][C]46[/C][C]-0.103243[/C][C]-1.1817[/C][C]0.119739[/C][/ROW]
[ROW][C]47[/C][C]0.069592[/C][C]0.7965[/C][C]0.213587[/C][/ROW]
[ROW][C]48[/C][C]-0.027841[/C][C]-0.3187[/C][C]0.37525[/C][/ROW]
[/TABLE]
Source: https://freestatistics.org/blog/index.php?pk=76604&T=2

Globally Unique Identifier (entire table): ba.freestatistics.org/blog/index.php?pk=76604&T=2

As an alternative you can also use a QR Code:  

The GUIDs for individual cells are displayed in the table below:

Partial Autocorrelation Function
Time lag kPACF(k)T-STATP-value
10.3058333.50040.000318
2-0.120186-1.37560.085648
30.0560880.6420.261011
40.0391470.44810.327428
50.060860.69660.243652
6-0.107931-1.23530.109459
7-0.128089-1.4660.072516
80.1105621.26540.10398
9-0.023544-0.26950.393995
10-0.027101-0.31020.378456
11-0.000213-0.00240.499028
12-0.12171-1.3930.082984
13-0.003986-0.04560.481842
140.0941141.07720.141688
150.0063280.07240.471187
16-0.00553-0.06330.474812
170.1107491.26760.103598
180.0397750.45520.324843
19-0.010078-0.11540.454171
20-0.039798-0.45550.32475
21-0.040505-0.46360.321853
22-0.029524-0.33790.367982
23-0.050445-0.57740.28234
240.1209561.38440.084294
25-0.080585-0.92230.179024
260.0154880.17730.429784
27-0.032459-0.37150.355431
28-0.020565-0.23540.40714
29-0.073014-0.83570.202429
30-0.026155-0.29940.382572
310.0533590.61070.271223
32-0.192401-2.20210.014703
33-0.087522-1.00170.159159
340.0718090.82190.206315
350.1438581.64650.051026
36-0.108462-1.24140.108337
37-0.054276-0.62120.267768
380.0824970.94420.173399
39-0.036636-0.41930.337834
400.1399371.60160.055821
41-0.052374-0.59940.274955
420.0812280.92970.177119
43-0.112507-1.28770.100059
44-0.099461-1.13840.128518
450.071350.81660.207809
46-0.103243-1.18170.119739
470.0695920.79650.213587
48-0.027841-0.31870.37525


Parameters (Session):
par1 = Default ; par2 = 1 ; par3 = 1 ; par4 = 0 ; par5 = 12 ; par6 = White Noise ; par7 = 0.95 ;
Parameters (R input):
par1 = 48 ; par2 = 1 ; par3 = 1 ; par4 = 0 ; par5 = 12 ; par6 = White Noise ; par7 = 0.95 ;
R code (references can be found in the software module):
if (par1 == 'Default') {
par1 = 10*log10(length(x))
} else {
par1 <- as.numeric(par1)
}
par2 <- as.numeric(par2)
par3 <- as.numeric(par3)
par4 <- as.numeric(par4)
par5 <- as.numeric(par5)
if (par6 == 'White Noise') par6 <- 'white' else par6 <- 'ma'
par7 <- as.numeric(par7)
if (par2 == 0) {
x <- log(x)
} else {
x <- (x ^ par2 - 1) / par2
}
if (par3 > 0) x <- diff(x,lag=1,difference=par3)
if (par4 > 0) x <- diff(x,lag=par5,difference=par4)
bitmap(file='pic1.png')
racf <- acf(x, par1, main='Autocorrelation', xlab='time lag', ylab='ACF', ci.type=par6, ci=par7, sub=paste('(lambda=',par2,', d=',par3,', D=',par4,', CI=', par7, ', CI type=',par6,')',sep=''))
dev.off()
bitmap(file='pic2.png')
rpacf <- pacf(x,par1,main='Partial Autocorrelation',xlab='lags',ylab='PACF')
dev.off()
(myacf <- c(racf$acf))
(mypacf <- c(rpacf$acf))
lengthx <- length(x)
sqrtn <- sqrt(lengthx)
load(file='createtable')
a<-table.start()
a<-table.row.start(a)
a<-table.element(a,'Autocorrelation Function',4,TRUE)
a<-table.row.end(a)
a<-table.row.start(a)
a<-table.element(a,'Time lag k',header=TRUE)
a<-table.element(a,hyperlink('basics.htm','ACF(k)','click here for more information about the Autocorrelation Function'),header=TRUE)
a<-table.element(a,'T-STAT',header=TRUE)
a<-table.element(a,'P-value',header=TRUE)
a<-table.row.end(a)
for (i in 2:(par1+1)) {
a<-table.row.start(a)
a<-table.element(a,i-1,header=TRUE)
a<-table.element(a,round(myacf[i],6))
mytstat <- myacf[i]*sqrtn
a<-table.element(a,round(mytstat,4))
a<-table.element(a,round(1-pt(abs(mytstat),lengthx),6))
a<-table.row.end(a)
}
a<-table.end(a)
table.save(a,file='mytable.tab')
a<-table.start()
a<-table.row.start(a)
a<-table.element(a,'Partial Autocorrelation Function',4,TRUE)
a<-table.row.end(a)
a<-table.row.start(a)
a<-table.element(a,'Time lag k',header=TRUE)
a<-table.element(a,hyperlink('basics.htm','PACF(k)','click here for more information about the Partial Autocorrelation Function'),header=TRUE)
a<-table.element(a,'T-STAT',header=TRUE)
a<-table.element(a,'P-value',header=TRUE)
a<-table.row.end(a)
for (i in 1:par1) {
a<-table.row.start(a)
a<-table.element(a,i,header=TRUE)
a<-table.element(a,round(mypacf[i],6))
mytstat <- mypacf[i]*sqrtn
a<-table.element(a,round(mytstat,4))
a<-table.element(a,round(1-pt(abs(mytstat),lengthx),6))
a<-table.row.end(a)
}
a<-table.end(a)
table.save(a,file='mytable1.tab')