B58A,regression tree,steven,coomans,thesis,per2maand | ||||||||||||||||||||||||||||||||||||||||||||||||||||||||||
| *Unverified author* | ||||||||||||||||||||||||||||||||||||||||||||||||||||||||||
| R Software Module: /rwasp_regression_trees.wasp (opens new window with default values) | ||||||||||||||||||||||||||||||||||||||||||||||||||||||||||
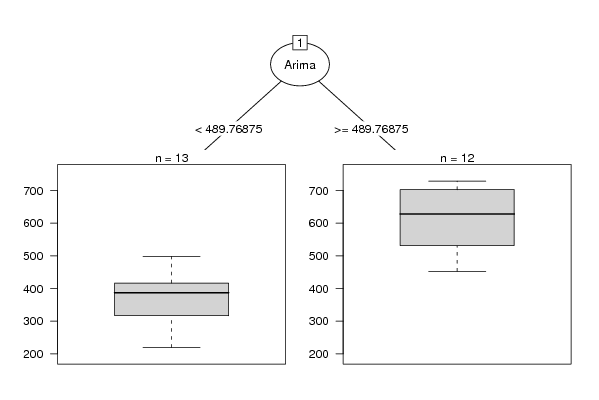
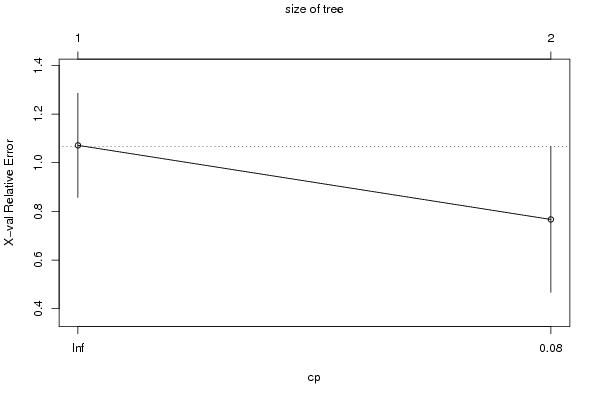
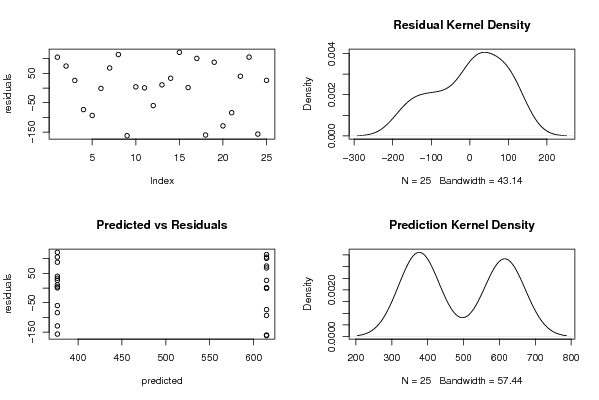
| Title produced by software: Recursive Partitioning (Regression Trees) | ||||||||||||||||||||||||||||||||||||||||||||||||||||||||||
| Date of computation: Wed, 26 May 2010 11:32:17 +0000 | ||||||||||||||||||||||||||||||||||||||||||||||||||||||||||
| Cite this page as follows: | ||||||||||||||||||||||||||||||||||||||||||||||||||||||||||
| Statistical Computations at FreeStatistics.org, Office for Research Development and Education, URL http://www.freestatistics.org/blog/date/2010/May/26/t1274873576z02l7vg9o9r2z0l.htm/, Retrieved Wed, 26 May 2010 13:32:56 +0200 | ||||||||||||||||||||||||||||||||||||||||||||||||||||||||||
| BibTeX entries for LaTeX users: | ||||||||||||||||||||||||||||||||||||||||||||||||||||||||||
@Manual{KEY,
    author = {{YOUR NAME}},
    publisher = {Office for Research Development and Education},
    title = {Statistical Computations at FreeStatistics.org, URL http://www.freestatistics.org/blog/date/2010/May/26/t1274873576z02l7vg9o9r2z0l.htm/},
    year = {2010},
}
@Manual{R,
    title = {R: A Language and Environment for Statistical Computing},
    author = {{R Development Core Team}},
    organization = {R Foundation for Statistical Computing},
    address = {Vienna, Austria},
    year = {2010},
    note = {{ISBN} 3-900051-07-0},
    url = {http://www.R-project.org},
}
| ||||||||||||||||||||||||||||||||||||||||||||||||||||||||||
| Original text written by user: | ||||||||||||||||||||||||||||||||||||||||||||||||||||||||||
| IsPrivate? | ||||||||||||||||||||||||||||||||||||||||||||||||||||||||||
| No (this computation is public) | ||||||||||||||||||||||||||||||||||||||||||||||||||||||||||
| User-defined keywords: | ||||||||||||||||||||||||||||||||||||||||||||||||||||||||||
| B58A,regression tree,steven,coomans,thesis,per2maand | ||||||||||||||||||||||||||||||||||||||||||||||||||||||||||
| Dataseries X: | ||||||||||||||||||||||||||||||||||||||||||||||||||||||||||
| » Textbox « » Textfile « » CSV « | ||||||||||||||||||||||||||||||||||||||||||||||||||||||||||
| 719.625 NA 712.710818344606 718.905375359812 619,5 689.5125 719.625 718.479353436485 719.62500000013 659,125 640.5 716.61375 694.312167950503 689.5125 675,65 541.3875 709.002375 649.416416773587 640.5 555,5 521.3875 692.2408875 559.287370647071 541.3875 582,75 613.325 675.15554875 527.667325831681 521.3875 466,75 683 668.972493875 599.131936389492 613.325 562,8 728.6375 670.3752444875 669.103466230299 683 289,65 452.5375 676.20147003875 718.772997648195 728.6375 592 380.425 653.835073034875 496.65143830366 452.5375 461,25 377.125 626.494065731387 399.683160440186 380.425 429,15 316.75 601.557159158249 380.862778420582 377.125 345,9 387.2625 573.076443242424 327.373178264001 316.75 421 409.75 554.495048918181 377.339128145203 387.2625 375,9 497.875 540.020544026363 404.379674802946 409.75 438,4 616.4 535.805989623727 482.383275403329 497.875 562,4 715.5125 543.865390661354 594.194074897074 616.4 700,65 454.925 561.030101595219 695.410621898232 715.5125 547,525 464.25 550.419591435697 494.7723 etc... | ||||||||||||||||||||||||||||||||||||||||||||||||||||||||||
| Output produced by software: | ||||||||||||||||||||||||||||||||||||||||||||||||||||||||||
| Charts produced by software: |
| Parameters (Session): | par1 = 1 ; par2 = No ; | | Parameters (R input): | par1 = 1 ; par2 = No ; | | R code (references can be found in the software module): | library(rpart)
| library(partykit) par1 <- as.numeric(par1) autoprune <- function ( tree, method='Minimum CV'){ xerr <- tree$cptable[,'xerror'] cpmin.id <- which.min(xerr) if (method == 'Minimum CV Error plus 1 SD'){ xstd <- tree$cptable[,'xstd'] errt <- xerr[cpmin.id] + xstd[cpmin.id] cpSE1.min <- which.min( errt < xerr ) mycp <- (tree$cptable[,'CP'])[cpSE1.min] } if (method == 'Minimum CV') { mycp <- (tree$cptable[,'CP'])[cpmin.id] } return (mycp) } conf.multi.mat <- function(true, new) { if ( all( is.na(match( levels(true),levels(new) ) )) ) stop ( 'conflict of vector levels') multi.t <- list() for (mylev in levels(true) ) { true.tmp <- true new.tmp <- new left.lev <- levels (true.tmp)[- match(mylev,levels(true) ) ] levels(true.tmp) <- list ( mylev = mylev, all = left.lev ) levels(new.tmp) <- list ( mylev = mylev, all = left.lev ) curr.t <- conf.mat ( true.tmp , new.tmp ) multi.t[[mylev]] <- curr.t multi.t[[mylev]]$precision <- round( curr.t$conf[1,1] / sum( curr.t$conf[1,] ), 2 ) } return (multi.t) } x <- t(y) k <- length(x[1,]) n <- length(x[,1]) x1 <- cbind(x[,par1], x[,1:k!=par1]) mycolnames <- c(colnames(x)[par1], colnames(x)[1:k!=par1]) colnames(x1) <- mycolnames #colnames(x)[par1] m <- rpart(as.data.frame(x1)) par2 if (par2 != 'No') { mincp <- autoprune(m,method=par2) print(mincp) m <- prune(m,cp=mincp) } m$cptable bitmap(file='test1.png') plot(as.party(m),tp_args=list(id=FALSE)) dev.off() bitmap(file='test2.png') plotcp(m) dev.off() cbind(y=m$y,pred=predict(m),res=residuals(m)) myr <- residuals(m) myp <- predict(m) bitmap(file='test4.png') op <- par(mfrow=c(2,2)) plot(myr,ylab='residuals') plot(density(myr),main='Residual Kernel Density') plot(myp,myr,xlab='predicted',ylab='residuals',main='Predicted vs Residuals') plot(density(myp),main='Prediction Kernel Density') par(op) dev.off() load(file='createtable') a<-table.start() a<-table.row.start(a) a<-table.element(a,'Model Performance',6,TRUE) a<-table.row.end(a) a<-table.row.start(a) a<-table.element(a,'#',header=TRUE) a<-table.element(a,'Complexity',header=TRUE) a<-table.element(a,'split',header=TRUE) a<-table.element(a,'relative error',header=TRUE) a<-table.element(a,'CV error',header=TRUE) a<-table.element(a,'CV S.D.',header=TRUE) a<-table.row.end(a) for (i in 1:length(m$cptable[,1])) { a<-table.row.start(a) a<-table.element(a,i,header=TRUE) a<-table.element(a,round(m$cptable[i,'CP'],3)) a<-table.element(a,m$cptable[i,'nsplit']) a<-table.element(a,round(m$cptable[i,'rel error'],3)) a<-table.element(a,round(m$cptable[i,'xerror'],3)) a<-table.element(a,round(m$cptable[i,'xstd'],3)) a<-table.row.end(a) } a<-table.end(a) table.save(a,file='mytable.tab') | Copyright
Software written by Ed van Stee & Patrick Wessa Disclaimer Information provided on this web site is provided "AS IS" without warranty of any kind, either express or implied, including, without limitation, warranties of merchantability, fitness for a particular purpose, and noninfringement. We use reasonable efforts to include accurate and timely information and periodically update the information, and software without notice. However, we make no warranties or representations as to the accuracy or completeness of such information (or software), and we assume no liability or responsibility for errors or omissions in the content of this web site, or any software bugs in online applications. Your use of this web site is AT YOUR OWN RISK. Under no circumstances and under no legal theory shall we be liable to you or any other person for any direct, indirect, special, incidental, exemplary, or consequential damages arising from your access to, or use of, this web site. Privacy Policy We may request personal information to be submitted to our servers in order to be able to:
We NEVER allow other companies to directly offer registered users information about their products and services. Banner references and hyperlinks of third parties NEVER contain any personal data of the visitor. We do NOT sell, nor transmit by any means, personal information, nor statistical data series uploaded by you to third parties.
We store a unique ANONYMOUS USER ID in the form of a small 'Cookie' on your computer. This allows us to track your progress when using this website which is necessary to create state-dependent features. The cookie is used for NO OTHER PURPOSE. At any time you may opt to disallow cookies from this website - this will not affect other features of this website. We examine cookies that are used by third-parties (banner and online ads) very closely: abuse from third-parties automatically results in termination of the advertising contract without refund. We have very good reason to believe that the cookies that are produced by third parties (banner ads) do NOT cause any privacy or security risk. FreeStatistics.org is safe. There is no need to download any software to use the applications and services contained in this website. Hence, your system's security is not compromised by their use, and your personal data - other than data you submit in the account application form, and the user-agent information that is transmitted by your browser - is never transmitted to our servers. As a general rule, we do not log on-line behavior of individuals (other than normal logging of webserver 'hits'). However, in cases of abuse, hacking, unauthorized access, Denial of Service attacks, illegal copying, hotlinking, non-compliance with international webstandards (such as robots.txt), or any other harmful behavior, our system engineers are empowered to log, track, identify, publish, and ban misbehaving individuals - even if this leads to ban entire blocks of IP addresses, or disclosing user's identity. | ||||||||||||||||||||||||||||||||||||||||||||||