pr | ||||||||||||||||||||||||||||||||||||||||||||||||||||||||||||||||
| *The author of this computation has been verified* | ||||||||||||||||||||||||||||||||||||||||||||||||||||||||||||||||
| R Software Module: /rwasp_regression_trees1.wasp (opens new window with default values) | ||||||||||||||||||||||||||||||||||||||||||||||||||||||||||||||||
| Title produced by software: Recursive Partitioning (Regression Trees) | ||||||||||||||||||||||||||||||||||||||||||||||||||||||||||||||||
| Date of computation: Fri, 31 Dec 2010 09:04:32 +0000 | ||||||||||||||||||||||||||||||||||||||||||||||||||||||||||||||||
| Cite this page as follows: | ||||||||||||||||||||||||||||||||||||||||||||||||||||||||||||||||
| Statistical Computations at FreeStatistics.org, Office for Research Development and Education, URL http://www.freestatistics.org/blog/date/2010/Dec/31/t1293786152jht3895qhukcok1.htm/, Retrieved Fri, 31 Dec 2010 10:02:32 +0100 | ||||||||||||||||||||||||||||||||||||||||||||||||||||||||||||||||
| BibTeX entries for LaTeX users: | ||||||||||||||||||||||||||||||||||||||||||||||||||||||||||||||||
@Manual{KEY,
    author = {{YOUR NAME}},
    publisher = {Office for Research Development and Education},
    title = {Statistical Computations at FreeStatistics.org, URL http://www.freestatistics.org/blog/date/2010/Dec/31/t1293786152jht3895qhukcok1.htm/},
    year = {2010},
}
@Manual{R,
    title = {R: A Language and Environment for Statistical Computing},
    author = {{R Development Core Team}},
    organization = {R Foundation for Statistical Computing},
    address = {Vienna, Austria},
    year = {2010},
    note = {{ISBN} 3-900051-07-0},
    url = {http://www.R-project.org},
}
| ||||||||||||||||||||||||||||||||||||||||||||||||||||||||||||||||
| Original text written by user: | ||||||||||||||||||||||||||||||||||||||||||||||||||||||||||||||||
| IsPrivate? | ||||||||||||||||||||||||||||||||||||||||||||||||||||||||||||||||
| No (this computation is public) | ||||||||||||||||||||||||||||||||||||||||||||||||||||||||||||||||
| User-defined keywords: | ||||||||||||||||||||||||||||||||||||||||||||||||||||||||||||||||
| Dataseries X: | ||||||||||||||||||||||||||||||||||||||||||||||||||||||||||||||||
| » Textbox « » Textfile « » CSV « | ||||||||||||||||||||||||||||||||||||||||||||||||||||||||||||||||
| 186448 17822 1942 16739 4872 1020 190530 22422 2547 17851 4905 1200 194207 18817 2033 17034 4971 1279 190855 22043 2049 18055 4971 1308 200779 19191 2007 18216 4930 1173 204428 23171 2660 18960 5001 1291 207617 19463 2063 17903 5059 1466 212071 22522 2113 18842 5085 1507 214239 20265 2145 18907 5111 1478 215883 24249 2866 19862 5190 1629 223484 20299 2163 18836 5076 1712 221529 25455 2157 19846 5134 1727 225247 21089 2201 19511 4804 1519 226699 26237 2838 20318 4579 1617 231406 21362 2142 19843 4526 1637 232324 26489 2253 20975 4550 1633 237192 21828 2258 20485 4566 1469 236727 27496 2979 21407 4588 1657 240698 21991 2288 20404 4564 1599 240688 27611 2431 21454 4723 1420 245283 22512 2393 21558 4553 1495 243556 28581 3244 22442 4556 1623 247826 23000 2476 21201 4542 1346 245798 28385 2490 21804 4234 1613 250479 23387 2547 22537 4341 1563 249216 30192 3461 22736 4269 2071 251896 24346 2549 21525 4217 1584 247616 30393 2496 22427 4207 1843 249994 24753 2532 23437 4267 1598 246552 31 etc... | ||||||||||||||||||||||||||||||||||||||||||||||||||||||||||||||||
| Output produced by software: | ||||||||||||||||||||||||||||||||||||||||||||||||||||||||||||||||
Enter (or paste) a matrix (table) containing all data (time) series. Every column represents a different variable and must be delimited by a space or Tab. Every row represents a period in time (or category) and must be delimited by hard returns. The easiest way to enter data is to copy and paste a block of spreadsheet cells. Please, do not use commas or spaces to seperate groups of digits!
| ||||||||||||||||||||||||||||||||||||||||||||||||||||||||||||||||
| Charts produced by software: | ||||||||||||||||||||||||||||||||||||||||||||||||||||||||||||||||
| ||||||||||||||||||||||||||||||||||||||||||||||||||||||||||||||||
| Parameters (Session): | ||||||||||||||||||||||||||||||||||||||||||||||||||||||||||||||||
| par1 = 1 ; par2 = quantiles ; par3 = 2 ; par4 = yes ; | ||||||||||||||||||||||||||||||||||||||||||||||||||||||||||||||||
| Parameters (R input): | ||||||||||||||||||||||||||||||||||||||||||||||||||||||||||||||||
| par1 = 1 ; par2 = quantiles ; par3 = 2 ; par4 = yes ; | ||||||||||||||||||||||||||||||||||||||||||||||||||||||||||||||||
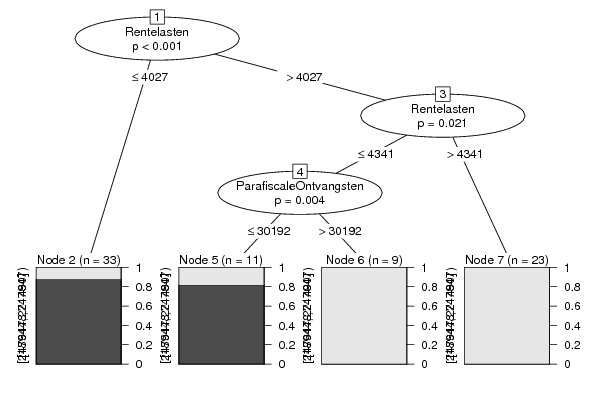
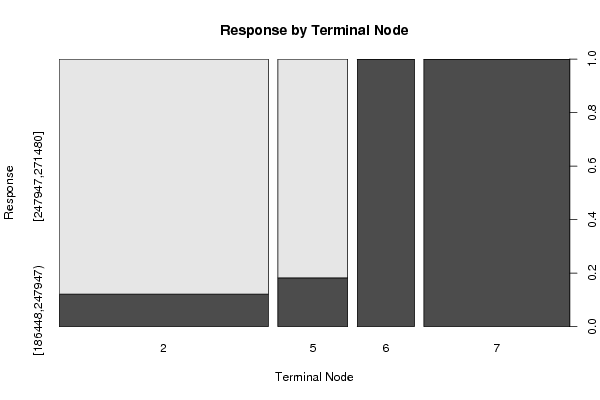
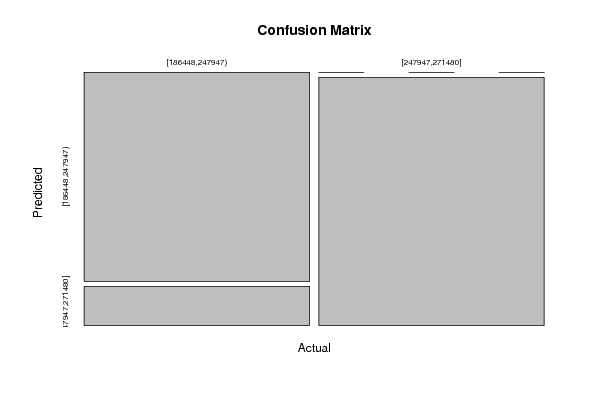
| R code (references can be found in the software module): | ||||||||||||||||||||||||||||||||||||||||||||||||||||||||||||||||
| library(party)
library(Hmisc) par1 <- as.numeric(par1) par3 <- as.numeric(par3) x <- data.frame(t(y)) is.data.frame(x) x <- x[!is.na(x[,par1]),] k <- length(x[1,]) n <- length(x[,1]) colnames(x)[par1] x[,par1] if (par2 == 'kmeans') { cl <- kmeans(x[,par1], par3) print(cl) clm <- matrix(cbind(cl$centers,1:par3),ncol=2) clm <- clm[sort.list(clm[,1]),] for (i in 1:par3) { cl$cluster[cl$cluster==clm[i,2]] <- paste('C',i,sep='') } cl$cluster <- as.factor(cl$cluster) print(cl$cluster) x[,par1] <- cl$cluster } if (par2 == 'quantiles') { x[,par1] <- cut2(x[,par1],g=par3) } if (par2 == 'hclust') { hc <- hclust(dist(x[,par1])^2, 'cen') print(hc) memb <- cutree(hc, k = par3) dum <- c(mean(x[memb==1,par1])) for (i in 2:par3) { dum <- c(dum, mean(x[memb==i,par1])) } hcm <- matrix(cbind(dum,1:par3),ncol=2) hcm <- hcm[sort.list(hcm[,1]),] for (i in 1:par3) { memb[memb==hcm[i,2]] <- paste('C',i,sep='') } memb <- as.factor(memb) print(memb) x[,par1] <- memb } if (par2=='equal') { ed <- cut(as.numeric(x[,par1]),par3,labels=paste('C',1:par3,sep='')) x[,par1] <- as.factor(ed) } table(x[,par1]) colnames(x) colnames(x)[par1] x[,par1] if (par2 == 'none') { m <- ctree(as.formula(paste(colnames(x)[par1],' ~ .',sep='')),data = x) } load(file='createtable') if (par2 != 'none') { m <- ctree(as.formula(paste('as.factor(',colnames(x)[par1],') ~ .',sep='')),data = x) if (par4=='yes') { a<-table.start() a<-table.row.start(a) a<-table.element(a,'10-Fold Cross Validation',3+2*par3,TRUE) a<-table.row.end(a) a<-table.row.start(a) a<-table.element(a,'',1,TRUE) a<-table.element(a,'Prediction (training)',par3+1,TRUE) a<-table.element(a,'Prediction (testing)',par3+1,TRUE) a<-table.row.end(a) a<-table.row.start(a) a<-table.element(a,'Actual',1,TRUE) for (jjj in 1:par3) a<-table.element(a,paste('C',jjj,sep=''),1,TRUE) a<-table.element(a,'CV',1,TRUE) for (jjj in 1:par3) a<-table.element(a,paste('C',jjj,sep=''),1,TRUE) a<-table.element(a,'CV',1,TRUE) a<-table.row.end(a) for (i in 1:10) { ind <- sample(2, nrow(x), replace=T, prob=c(0.9,0.1)) m.ct <- ctree(as.formula(paste('as.factor(',colnames(x)[par1],') ~ .',sep='')),data =x[ind==1,]) if (i==1) { m.ct.i.pred <- predict(m.ct, newdata=x[ind==1,]) m.ct.i.actu <- x[ind==1,par1] m.ct.x.pred <- predict(m.ct, newdata=x[ind==2,]) m.ct.x.actu <- x[ind==2,par1] } else { m.ct.i.pred <- c(m.ct.i.pred,predict(m.ct, newdata=x[ind==1,])) m.ct.i.actu <- c(m.ct.i.actu,x[ind==1,par1]) m.ct.x.pred <- c(m.ct.x.pred,predict(m.ct, newdata=x[ind==2,])) m.ct.x.actu <- c(m.ct.x.actu,x[ind==2,par1]) } } print(m.ct.i.tab <- table(m.ct.i.actu,m.ct.i.pred)) numer <- 0 for (i in 1:par3) { print(m.ct.i.tab[i,i] / sum(m.ct.i.tab[i,])) numer <- numer + m.ct.i.tab[i,i] } print(m.ct.i.cp <- numer / sum(m.ct.i.tab)) print(m.ct.x.tab <- table(m.ct.x.actu,m.ct.x.pred)) numer <- 0 for (i in 1:par3) { print(m.ct.x.tab[i,i] / sum(m.ct.x.tab[i,])) numer <- numer + m.ct.x.tab[i,i] } print(m.ct.x.cp <- numer / sum(m.ct.x.tab)) for (i in 1:par3) { a<-table.row.start(a) a<-table.element(a,paste('C',i,sep=''),1,TRUE) for (jjj in 1:par3) a<-table.element(a,m.ct.i.tab[i,jjj]) a<-table.element(a,round(m.ct.i.tab[i,i]/sum(m.ct.i.tab[i,]),4)) for (jjj in 1:par3) a<-table.element(a,m.ct.x.tab[i,jjj]) a<-table.element(a,round(m.ct.x.tab[i,i]/sum(m.ct.x.tab[i,]),4)) a<-table.row.end(a) } a<-table.row.start(a) a<-table.element(a,'Overall',1,TRUE) for (jjj in 1:par3) a<-table.element(a,'-') a<-table.element(a,round(m.ct.i.cp,4)) for (jjj in 1:par3) a<-table.element(a,'-') a<-table.element(a,round(m.ct.x.cp,4)) a<-table.row.end(a) a<-table.end(a) table.save(a,file='mytable3.tab') } } m bitmap(file='test1.png') plot(m) dev.off() bitmap(file='test1a.png') plot(x[,par1] ~ as.factor(where(m)),main='Response by Terminal Node',xlab='Terminal Node',ylab='Response') dev.off() if (par2 == 'none') { forec <- predict(m) result <- as.data.frame(cbind(x[,par1],forec,x[,par1]-forec)) colnames(result) <- c('Actuals','Forecasts','Residuals') print(result) } if (par2 != 'none') { print(cbind(as.factor(x[,par1]),predict(m))) myt <- table(as.factor(x[,par1]),predict(m)) print(myt) } bitmap(file='test2.png') if(par2=='none') { op <- par(mfrow=c(2,2)) plot(density(result$Actuals),main='Kernel Density Plot of Actuals') plot(density(result$Residuals),main='Kernel Density Plot of Residuals') plot(result$Forecasts,result$Actuals,main='Actuals versus Predictions',xlab='Predictions',ylab='Actuals') plot(density(result$Forecasts),main='Kernel Density Plot of Predictions') par(op) } if(par2!='none') { plot(myt,main='Confusion Matrix',xlab='Actual',ylab='Predicted') } dev.off() if (par2 == 'none') { detcoef <- cor(result$Forecasts,result$Actuals) a<-table.start() a<-table.row.start(a) a<-table.element(a,'Goodness of Fit',2,TRUE) a<-table.row.end(a) a<-table.row.start(a) a<-table.element(a,'Correlation',1,TRUE) a<-table.element(a,round(detcoef,4)) a<-table.row.end(a) a<-table.row.start(a) a<-table.element(a,'R-squared',1,TRUE) a<-table.element(a,round(detcoef*detcoef,4)) a<-table.row.end(a) a<-table.row.start(a) a<-table.element(a,'RMSE',1,TRUE) a<-table.element(a,round(sqrt(mean((result$Residuals)^2)),4)) a<-table.row.end(a) a<-table.end(a) table.save(a,file='mytable1.tab') a<-table.start() a<-table.row.start(a) a<-table.element(a,'Actuals, Predictions, and Residuals',4,TRUE) a<-table.row.end(a) a<-table.row.start(a) a<-table.element(a,'#',header=TRUE) a<-table.element(a,'Actuals',header=TRUE) a<-table.element(a,'Forecasts',header=TRUE) a<-table.element(a,'Residuals',header=TRUE) a<-table.row.end(a) for (i in 1:length(result$Actuals)) { a<-table.row.start(a) a<-table.element(a,i,header=TRUE) a<-table.element(a,result$Actuals[i]) a<-table.element(a,result$Forecasts[i]) a<-table.element(a,result$Residuals[i]) a<-table.row.end(a) } a<-table.end(a) table.save(a,file='mytable.tab') } if (par2 != 'none') { a<-table.start() a<-table.row.start(a) a<-table.element(a,'Confusion Matrix (predicted in columns / actuals in rows)',par3+1,TRUE) a<-table.row.end(a) a<-table.row.start(a) a<-table.element(a,'',1,TRUE) for (i in 1:par3) { a<-table.element(a,paste('C',i,sep=''),1,TRUE) } a<-table.row.end(a) for (i in 1:par3) { a<-table.row.start(a) a<-table.element(a,paste('C',i,sep=''),1,TRUE) for (j in 1:par3) { a<-table.element(a,myt[i,j]) } a<-table.row.end(a) } a<-table.end(a) table.save(a,file='mytable2.tab') } | ||||||||||||||||||||||||||||||||||||||||||||||||||||||||||||||||
Copyright

This work is licensed under a
Creative Commons Attribution-Noncommercial-Share Alike 3.0 License.
Software written by Ed van Stee & Patrick Wessa
Disclaimer
Information provided on this web site is provided "AS IS" without warranty of any kind, either express or implied, including, without limitation, warranties of merchantability, fitness for a particular purpose, and noninfringement. We use reasonable efforts to include accurate and timely information and periodically update the information, and software without notice. However, we make no warranties or representations as to the accuracy or completeness of such information (or software), and we assume no liability or responsibility for errors or omissions in the content of this web site, or any software bugs in online applications. Your use of this web site is AT YOUR OWN RISK. Under no circumstances and under no legal theory shall we be liable to you or any other person for any direct, indirect, special, incidental, exemplary, or consequential damages arising from your access to, or use of, this web site.
Privacy Policy
We may request personal information to be submitted to our servers in order to be able to:
- personalize online software applications according to your needs
- enforce strict security rules with respect to the data that you upload (e.g. statistical data)
- manage user sessions of online applications
- alert you about important changes or upgrades in resources or applications
We NEVER allow other companies to directly offer registered users information about their products and services. Banner references and hyperlinks of third parties NEVER contain any personal data of the visitor.
We do NOT sell, nor transmit by any means, personal information, nor statistical data series uploaded by you to third parties.
We carefully protect your data from loss, misuse, alteration,
and destruction. However, at any time, and under any circumstance you
are solely responsible for managing your passwords, and keeping them
secret.
We store a unique ANONYMOUS USER ID in the form of a small 'Cookie' on your computer. This allows us to track your progress when using this website which is necessary to create state-dependent features. The cookie is used for NO OTHER PURPOSE. At any time you may opt to disallow cookies from this website - this will not affect other features of this website.
We examine cookies that are used by third-parties (banner and online ads) very closely: abuse from third-parties automatically results in termination of the advertising contract without refund. We have very good reason to believe that the cookies that are produced by third parties (banner ads) do NOT cause any privacy or security risk.
FreeStatistics.org is safe. There is no need to download any software to use the applications and services contained in this website. Hence, your system's security is not compromised by their use, and your personal data - other than data you submit in the account application form, and the user-agent information that is transmitted by your browser - is never transmitted to our servers.
As a general rule, we do not log on-line behavior of individuals (other than normal logging of webserver 'hits'). However, in cases of abuse, hacking, unauthorized access, Denial of Service attacks, illegal copying, hotlinking, non-compliance with international webstandards (such as robots.txt), or any other harmful behavior, our system engineers are empowered to log, track, identify, publish, and ban misbehaving individuals - even if this leads to ban entire blocks of IP addresses, or disclosing user's identity.