STMP | ||||||||||||||||||||||||||||||||||||||||||||||||||||||||||||||||||||||||||||||||||||||||||||||||||||
| *The author of this computation has been verified* | ||||||||||||||||||||||||||||||||||||||||||||||||||||||||||||||||||||||||||||||||||||||||||||||||||||
| R Software Module: /rwasp_smp.wasp (opens new window with default values) | ||||||||||||||||||||||||||||||||||||||||||||||||||||||||||||||||||||||||||||||||||||||||||||||||||||
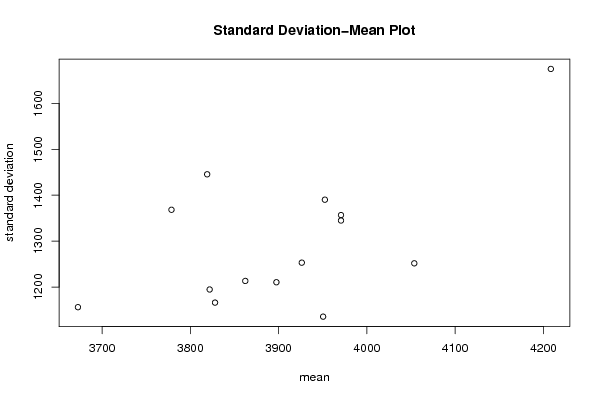
| Title produced by software: Standard Deviation-Mean Plot | ||||||||||||||||||||||||||||||||||||||||||||||||||||||||||||||||||||||||||||||||||||||||||||||||||||
| Date of computation: Wed, 29 Dec 2010 15:09:09 +0000 | ||||||||||||||||||||||||||||||||||||||||||||||||||||||||||||||||||||||||||||||||||||||||||||||||||||
| Cite this page as follows: | ||||||||||||||||||||||||||||||||||||||||||||||||||||||||||||||||||||||||||||||||||||||||||||||||||||
| Statistical Computations at FreeStatistics.org, Office for Research Development and Education, URL http://www.freestatistics.org/blog/date/2010/Dec/29/t1293635262derpi77i41386oz.htm/, Retrieved Wed, 29 Dec 2010 16:07:42 +0100 | ||||||||||||||||||||||||||||||||||||||||||||||||||||||||||||||||||||||||||||||||||||||||||||||||||||
| BibTeX entries for LaTeX users: | ||||||||||||||||||||||||||||||||||||||||||||||||||||||||||||||||||||||||||||||||||||||||||||||||||||
@Manual{KEY,
    author = {{YOUR NAME}},
    publisher = {Office for Research Development and Education},
    title = {Statistical Computations at FreeStatistics.org, URL http://www.freestatistics.org/blog/date/2010/Dec/29/t1293635262derpi77i41386oz.htm/},
    year = {2010},
}
@Manual{R,
    title = {R: A Language and Environment for Statistical Computing},
    author = {{R Development Core Team}},
    organization = {R Foundation for Statistical Computing},
    address = {Vienna, Austria},
    year = {2010},
    note = {{ISBN} 3-900051-07-0},
    url = {http://www.R-project.org},
}
| ||||||||||||||||||||||||||||||||||||||||||||||||||||||||||||||||||||||||||||||||||||||||||||||||||||
| Original text written by user: | ||||||||||||||||||||||||||||||||||||||||||||||||||||||||||||||||||||||||||||||||||||||||||||||||||||
| IsPrivate? | ||||||||||||||||||||||||||||||||||||||||||||||||||||||||||||||||||||||||||||||||||||||||||||||||||||
| No (this computation is public) | ||||||||||||||||||||||||||||||||||||||||||||||||||||||||||||||||||||||||||||||||||||||||||||||||||||
| User-defined keywords: | ||||||||||||||||||||||||||||||||||||||||||||||||||||||||||||||||||||||||||||||||||||||||||||||||||||
| Dataseries X: | ||||||||||||||||||||||||||||||||||||||||||||||||||||||||||||||||||||||||||||||||||||||||||||||||||||
| » Textbox « » Textfile « » CSV « | ||||||||||||||||||||||||||||||||||||||||||||||||||||||||||||||||||||||||||||||||||||||||||||||||||||
| 5745 4549 5074 3602 2732 2589 2148 2330 2752 3241 4517 6550 6778 6240 5570 3558 3299 2447 2380 2378 2947 3651 4816 6436 7090 4682 4198 3860 3056 2563 2568 2472 2821 4015 4686 5418 5649 4572 4695 3766 2900 2528 2549 2478 2828 4139 5390 5621 5291 5272 4677 3520 2842 2723 2581 2429 2606 3787 4630 5505 5577 4911 4701 3557 2921 2734 2636 2433 2640 3794 4745 5698 5909 5119 5200 3876 3104 2251 2386 2794 2967 3392 4741 5909 5901 4962 4751 3909 3130 2860 2568 2540 2894 4216 4530 5144 6206 5645 4601 3645 3140 2264 2557 2431 2747 4587 4512 5313 6011 5328 5014 3630 3102 2739 2877 2659 2957 3785 4785 5757 5458 5427 5018 3498 3204 2763 2589 2591 2805 3278 4615 5524 6167 5380 5377 3603 2774 2470 2407 2512 2451 3134 4210 4859 5022 4584 4267 3022 2777 2428 2389 2496 2820 3854 4748 5666 5293 4905 4920 3854 2659 2491 2455 2472 3030 3987 4453 5417 | ||||||||||||||||||||||||||||||||||||||||||||||||||||||||||||||||||||||||||||||||||||||||||||||||||||
| Output produced by software: | ||||||||||||||||||||||||||||||||||||||||||||||||||||||||||||||||||||||||||||||||||||||||||||||||||||
| ||||||||||||||||||||||||||||||||||||||||||||||||||||||||||||||||||||||||||||||||||||||||||||||||||||
| Charts produced by software: | ||||||||||||||||||||||||||||||||||||||||||||||||||||||||||||||||||||||||||||||||||||||||||||||||||||
| ||||||||||||||||||||||||||||||||||||||||||||||||||||||||||||||||||||||||||||||||||||||||||||||||||||
| Parameters (Session): | ||||||||||||||||||||||||||||||||||||||||||||||||||||||||||||||||||||||||||||||||||||||||||||||||||||
| par1 = 12 ; | ||||||||||||||||||||||||||||||||||||||||||||||||||||||||||||||||||||||||||||||||||||||||||||||||||||
| Parameters (R input): | ||||||||||||||||||||||||||||||||||||||||||||||||||||||||||||||||||||||||||||||||||||||||||||||||||||
| par1 = 12 ; | ||||||||||||||||||||||||||||||||||||||||||||||||||||||||||||||||||||||||||||||||||||||||||||||||||||
| R code (references can be found in the software module): | ||||||||||||||||||||||||||||||||||||||||||||||||||||||||||||||||||||||||||||||||||||||||||||||||||||
| par1 <- as.numeric(par1)
(n <- length(x)) (np <- floor(n / par1)) arr <- array(NA,dim=c(par1,np)) j <- 0 k <- 1 for (i in 1:(np*par1)) { j = j + 1 arr[j,k] <- x[i] if (j == par1) { j = 0 k=k+1 } } arr arr.mean <- array(NA,dim=np) arr.sd <- array(NA,dim=np) arr.range <- array(NA,dim=np) for (j in 1:np) { arr.mean[j] <- mean(arr[,j],na.rm=TRUE) arr.sd[j] <- sd(arr[,j],na.rm=TRUE) arr.range[j] <- max(arr[,j],na.rm=TRUE) - min(arr[,j],na.rm=TRUE) } arr.mean arr.sd arr.range (lm1 <- lm(arr.sd~arr.mean)) (lnlm1 <- lm(log(arr.sd)~log(arr.mean))) (lm2 <- lm(arr.range~arr.mean)) bitmap(file='test1.png') plot(arr.mean,arr.sd,main='Standard Deviation-Mean Plot',xlab='mean',ylab='standard deviation') dev.off() bitmap(file='test2.png') plot(arr.mean,arr.range,main='Range-Mean Plot',xlab='mean',ylab='range') dev.off() load(file='createtable') a<-table.start() a<-table.row.start(a) a<-table.element(a,'Standard Deviation-Mean Plot',4,TRUE) a<-table.row.end(a) a<-table.row.start(a) a<-table.element(a,'Section',header=TRUE) a<-table.element(a,'Mean',header=TRUE) a<-table.element(a,'Standard Deviation',header=TRUE) a<-table.element(a,'Range',header=TRUE) a<-table.row.end(a) for (j in 1:np) { a<-table.row.start(a) a<-table.element(a,j,header=TRUE) a<-table.element(a,arr.mean[j]) a<-table.element(a,arr.sd[j] ) a<-table.element(a,arr.range[j] ) a<-table.row.end(a) } a<-table.end(a) table.save(a,file='mytable.tab') a<-table.start() a<-table.row.start(a) a<-table.element(a,'Regression: S.E.(k) = alpha + beta * Mean(k)',2,TRUE) a<-table.row.end(a) a<-table.row.start(a) a<-table.element(a,'alpha',header=TRUE) a<-table.element(a,lm1$coefficients[[1]]) a<-table.row.end(a) a<-table.row.start(a) a<-table.element(a,'beta',header=TRUE) a<-table.element(a,lm1$coefficients[[2]]) a<-table.row.end(a) a<-table.row.start(a) a<-table.element(a,'S.D.',header=TRUE) a<-table.element(a,summary(lm1)$coefficients[2,2]) a<-table.row.end(a) a<-table.row.start(a) a<-table.element(a,'T-STAT',header=TRUE) a<-table.element(a,summary(lm1)$coefficients[2,3]) a<-table.row.end(a) a<-table.row.start(a) a<-table.element(a,'p-value',header=TRUE) a<-table.element(a,summary(lm1)$coefficients[2,4]) a<-table.row.end(a) a<-table.end(a) table.save(a,file='mytable1.tab') a<-table.start() a<-table.row.start(a) a<-table.element(a,'Regression: ln S.E.(k) = alpha + beta * ln Mean(k)',2,TRUE) a<-table.row.end(a) a<-table.row.start(a) a<-table.element(a,'alpha',header=TRUE) a<-table.element(a,lnlm1$coefficients[[1]]) a<-table.row.end(a) a<-table.row.start(a) a<-table.element(a,'beta',header=TRUE) a<-table.element(a,lnlm1$coefficients[[2]]) a<-table.row.end(a) a<-table.row.start(a) a<-table.element(a,'S.D.',header=TRUE) a<-table.element(a,summary(lnlm1)$coefficients[2,2]) a<-table.row.end(a) a<-table.row.start(a) a<-table.element(a,'T-STAT',header=TRUE) a<-table.element(a,summary(lnlm1)$coefficients[2,3]) a<-table.row.end(a) a<-table.row.start(a) a<-table.element(a,'p-value',header=TRUE) a<-table.element(a,summary(lnlm1)$coefficients[2,4]) a<-table.row.end(a) a<-table.row.start(a) a<-table.element(a,'Lambda',header=TRUE) a<-table.element(a,1-lnlm1$coefficients[[2]]) a<-table.row.end(a) a<-table.end(a) table.save(a,file='mytable2.tab') | ||||||||||||||||||||||||||||||||||||||||||||||||||||||||||||||||||||||||||||||||||||||||||||||||||||

Copyright

This work is licensed under a
Creative Commons Attribution-Noncommercial-Share Alike 3.0 License.
Software written by Ed van Stee & Patrick Wessa
Disclaimer
Information provided on this web site is provided "AS IS" without warranty of any kind, either express or implied, including, without limitation, warranties of merchantability, fitness for a particular purpose, and noninfringement. We use reasonable efforts to include accurate and timely information and periodically update the information, and software without notice. However, we make no warranties or representations as to the accuracy or completeness of such information (or software), and we assume no liability or responsibility for errors or omissions in the content of this web site, or any software bugs in online applications. Your use of this web site is AT YOUR OWN RISK. Under no circumstances and under no legal theory shall we be liable to you or any other person for any direct, indirect, special, incidental, exemplary, or consequential damages arising from your access to, or use of, this web site.
Privacy Policy
We may request personal information to be submitted to our servers in order to be able to:
- personalize online software applications according to your needs
- enforce strict security rules with respect to the data that you upload (e.g. statistical data)
- manage user sessions of online applications
- alert you about important changes or upgrades in resources or applications
We NEVER allow other companies to directly offer registered users information about their products and services. Banner references and hyperlinks of third parties NEVER contain any personal data of the visitor.
We do NOT sell, nor transmit by any means, personal information, nor statistical data series uploaded by you to third parties.
We carefully protect your data from loss, misuse, alteration,
and destruction. However, at any time, and under any circumstance you
are solely responsible for managing your passwords, and keeping them
secret.
We store a unique ANONYMOUS USER ID in the form of a small 'Cookie' on your computer. This allows us to track your progress when using this website which is necessary to create state-dependent features. The cookie is used for NO OTHER PURPOSE. At any time you may opt to disallow cookies from this website - this will not affect other features of this website.
We examine cookies that are used by third-parties (banner and online ads) very closely: abuse from third-parties automatically results in termination of the advertising contract without refund. We have very good reason to believe that the cookies that are produced by third parties (banner ads) do NOT cause any privacy or security risk.
FreeStatistics.org is safe. There is no need to download any software to use the applications and services contained in this website. Hence, your system's security is not compromised by their use, and your personal data - other than data you submit in the account application form, and the user-agent information that is transmitted by your browser - is never transmitted to our servers.
As a general rule, we do not log on-line behavior of individuals (other than normal logging of webserver 'hits'). However, in cases of abuse, hacking, unauthorized access, Denial of Service attacks, illegal copying, hotlinking, non-compliance with international webstandards (such as robots.txt), or any other harmful behavior, our system engineers are empowered to log, track, identify, publish, and ban misbehaving individuals - even if this leads to ban entire blocks of IP addresses, or disclosing user's identity.