ARIMA backward selection Brussel | ||||||||||||||||||||||||||||||||||||||||||||||||||||||||||||||||||||||||||||||||||||||||||||||||||||||||||||||||||||||||||||||||||||||||||||||||||||||||||||||||||||||||||||||||||||||||||||||||||||||||||||||||||||||||||||||||||||||||||||||||||||||||||||||||||||||||||||||||||||||||||||||||||||||||||||||||||||||||||||||||||||||||||||
| *The author of this computation has been verified* | ||||||||||||||||||||||||||||||||||||||||||||||||||||||||||||||||||||||||||||||||||||||||||||||||||||||||||||||||||||||||||||||||||||||||||||||||||||||||||||||||||||||||||||||||||||||||||||||||||||||||||||||||||||||||||||||||||||||||||||||||||||||||||||||||||||||||||||||||||||||||||||||||||||||||||||||||||||||||||||||||||||||||||||
| R Software Module: /rwasp_arimabackwardselection.wasp (opens new window with default values) | ||||||||||||||||||||||||||||||||||||||||||||||||||||||||||||||||||||||||||||||||||||||||||||||||||||||||||||||||||||||||||||||||||||||||||||||||||||||||||||||||||||||||||||||||||||||||||||||||||||||||||||||||||||||||||||||||||||||||||||||||||||||||||||||||||||||||||||||||||||||||||||||||||||||||||||||||||||||||||||||||||||||||||||
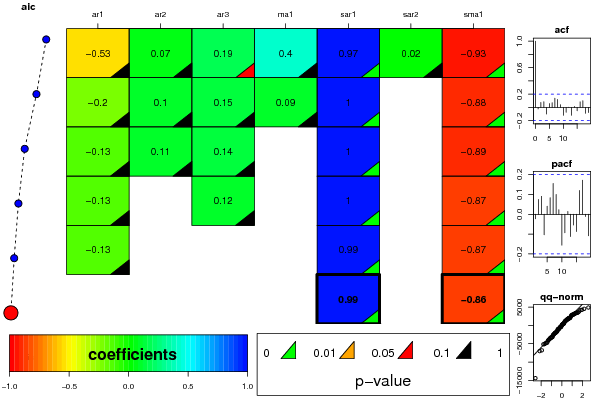
| Title produced by software: ARIMA Backward Selection | ||||||||||||||||||||||||||||||||||||||||||||||||||||||||||||||||||||||||||||||||||||||||||||||||||||||||||||||||||||||||||||||||||||||||||||||||||||||||||||||||||||||||||||||||||||||||||||||||||||||||||||||||||||||||||||||||||||||||||||||||||||||||||||||||||||||||||||||||||||||||||||||||||||||||||||||||||||||||||||||||||||||||||||
| Date of computation: Wed, 29 Dec 2010 13:10:56 +0000 | ||||||||||||||||||||||||||||||||||||||||||||||||||||||||||||||||||||||||||||||||||||||||||||||||||||||||||||||||||||||||||||||||||||||||||||||||||||||||||||||||||||||||||||||||||||||||||||||||||||||||||||||||||||||||||||||||||||||||||||||||||||||||||||||||||||||||||||||||||||||||||||||||||||||||||||||||||||||||||||||||||||||||||||
| Cite this page as follows: | ||||||||||||||||||||||||||||||||||||||||||||||||||||||||||||||||||||||||||||||||||||||||||||||||||||||||||||||||||||||||||||||||||||||||||||||||||||||||||||||||||||||||||||||||||||||||||||||||||||||||||||||||||||||||||||||||||||||||||||||||||||||||||||||||||||||||||||||||||||||||||||||||||||||||||||||||||||||||||||||||||||||||||||
| Statistical Computations at FreeStatistics.org, Office for Research Development and Education, URL http://www.freestatistics.org/blog/date/2010/Dec/29/t1293634013xq0m1mucaxqmxff.htm/, Retrieved Wed, 29 Dec 2010 15:46:55 +0100 | ||||||||||||||||||||||||||||||||||||||||||||||||||||||||||||||||||||||||||||||||||||||||||||||||||||||||||||||||||||||||||||||||||||||||||||||||||||||||||||||||||||||||||||||||||||||||||||||||||||||||||||||||||||||||||||||||||||||||||||||||||||||||||||||||||||||||||||||||||||||||||||||||||||||||||||||||||||||||||||||||||||||||||||
| BibTeX entries for LaTeX users: | ||||||||||||||||||||||||||||||||||||||||||||||||||||||||||||||||||||||||||||||||||||||||||||||||||||||||||||||||||||||||||||||||||||||||||||||||||||||||||||||||||||||||||||||||||||||||||||||||||||||||||||||||||||||||||||||||||||||||||||||||||||||||||||||||||||||||||||||||||||||||||||||||||||||||||||||||||||||||||||||||||||||||||||
@Manual{KEY,
    author = {{YOUR NAME}},
    publisher = {Office for Research Development and Education},
    title = {Statistical Computations at FreeStatistics.org, URL http://www.freestatistics.org/blog/date/2010/Dec/29/t1293634013xq0m1mucaxqmxff.htm/},
    year = {2010},
}
@Manual{R,
    title = {R: A Language and Environment for Statistical Computing},
    author = {{R Development Core Team}},
    organization = {R Foundation for Statistical Computing},
    address = {Vienna, Austria},
    year = {2010},
    note = {{ISBN} 3-900051-07-0},
    url = {http://www.R-project.org},
}
| ||||||||||||||||||||||||||||||||||||||||||||||||||||||||||||||||||||||||||||||||||||||||||||||||||||||||||||||||||||||||||||||||||||||||||||||||||||||||||||||||||||||||||||||||||||||||||||||||||||||||||||||||||||||||||||||||||||||||||||||||||||||||||||||||||||||||||||||||||||||||||||||||||||||||||||||||||||||||||||||||||||||||||||
| Original text written by user: | ||||||||||||||||||||||||||||||||||||||||||||||||||||||||||||||||||||||||||||||||||||||||||||||||||||||||||||||||||||||||||||||||||||||||||||||||||||||||||||||||||||||||||||||||||||||||||||||||||||||||||||||||||||||||||||||||||||||||||||||||||||||||||||||||||||||||||||||||||||||||||||||||||||||||||||||||||||||||||||||||||||||||||||
| IsPrivate? | ||||||||||||||||||||||||||||||||||||||||||||||||||||||||||||||||||||||||||||||||||||||||||||||||||||||||||||||||||||||||||||||||||||||||||||||||||||||||||||||||||||||||||||||||||||||||||||||||||||||||||||||||||||||||||||||||||||||||||||||||||||||||||||||||||||||||||||||||||||||||||||||||||||||||||||||||||||||||||||||||||||||||||||
| No (this computation is public) | ||||||||||||||||||||||||||||||||||||||||||||||||||||||||||||||||||||||||||||||||||||||||||||||||||||||||||||||||||||||||||||||||||||||||||||||||||||||||||||||||||||||||||||||||||||||||||||||||||||||||||||||||||||||||||||||||||||||||||||||||||||||||||||||||||||||||||||||||||||||||||||||||||||||||||||||||||||||||||||||||||||||||||||
| User-defined keywords: | ||||||||||||||||||||||||||||||||||||||||||||||||||||||||||||||||||||||||||||||||||||||||||||||||||||||||||||||||||||||||||||||||||||||||||||||||||||||||||||||||||||||||||||||||||||||||||||||||||||||||||||||||||||||||||||||||||||||||||||||||||||||||||||||||||||||||||||||||||||||||||||||||||||||||||||||||||||||||||||||||||||||||||||
| Dataseries X: | ||||||||||||||||||||||||||||||||||||||||||||||||||||||||||||||||||||||||||||||||||||||||||||||||||||||||||||||||||||||||||||||||||||||||||||||||||||||||||||||||||||||||||||||||||||||||||||||||||||||||||||||||||||||||||||||||||||||||||||||||||||||||||||||||||||||||||||||||||||||||||||||||||||||||||||||||||||||||||||||||||||||||||||
| » Textbox « » Textfile « » CSV « | ||||||||||||||||||||||||||||||||||||||||||||||||||||||||||||||||||||||||||||||||||||||||||||||||||||||||||||||||||||||||||||||||||||||||||||||||||||||||||||||||||||||||||||||||||||||||||||||||||||||||||||||||||||||||||||||||||||||||||||||||||||||||||||||||||||||||||||||||||||||||||||||||||||||||||||||||||||||||||||||||||||||||||||
| 45990 42904 49968 42831 42110 45002 42091 39457 44448 48208 49603 48093 43130 45599 52287 49732 49571 48933 49203 45018 49405 56007 61858 55740 48827 52043 60348 55615 56852 55630 56457 50013 56291 52477 59846 55732 49114 55382 61102 61219 55785 57941 58844 51479 59968 60747 61532 61292 55164 56292 66015 60829 57571 57619 55304 54181 61033 63886 67365 63707 53473 52531 62703 61004 60438 65272 64463 62449 67373 70307 75544 71966 66263 69550 75388 57716 55779 52927 45655 46487 48683 50010 48944 41341 32411 34763 39106 34472 32642 34248 32280 29990 29656 34071 34105 33717 | ||||||||||||||||||||||||||||||||||||||||||||||||||||||||||||||||||||||||||||||||||||||||||||||||||||||||||||||||||||||||||||||||||||||||||||||||||||||||||||||||||||||||||||||||||||||||||||||||||||||||||||||||||||||||||||||||||||||||||||||||||||||||||||||||||||||||||||||||||||||||||||||||||||||||||||||||||||||||||||||||||||||||||||
| Output produced by software: | ||||||||||||||||||||||||||||||||||||||||||||||||||||||||||||||||||||||||||||||||||||||||||||||||||||||||||||||||||||||||||||||||||||||||||||||||||||||||||||||||||||||||||||||||||||||||||||||||||||||||||||||||||||||||||||||||||||||||||||||||||||||||||||||||||||||||||||||||||||||||||||||||||||||||||||||||||||||||||||||||||||||||||||
| ||||||||||||||||||||||||||||||||||||||||||||||||||||||||||||||||||||||||||||||||||||||||||||||||||||||||||||||||||||||||||||||||||||||||||||||||||||||||||||||||||||||||||||||||||||||||||||||||||||||||||||||||||||||||||||||||||||||||||||||||||||||||||||||||||||||||||||||||||||||||||||||||||||||||||||||||||||||||||||||||||||||||||||
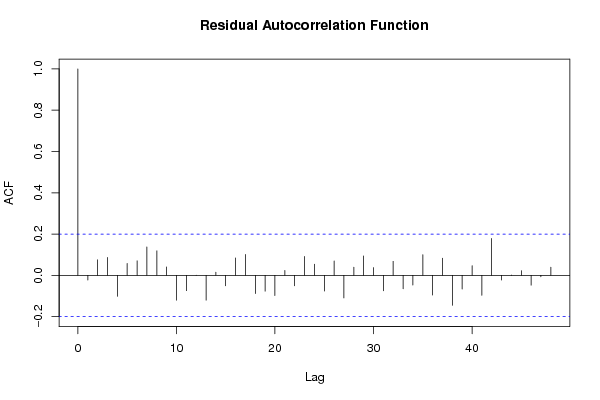
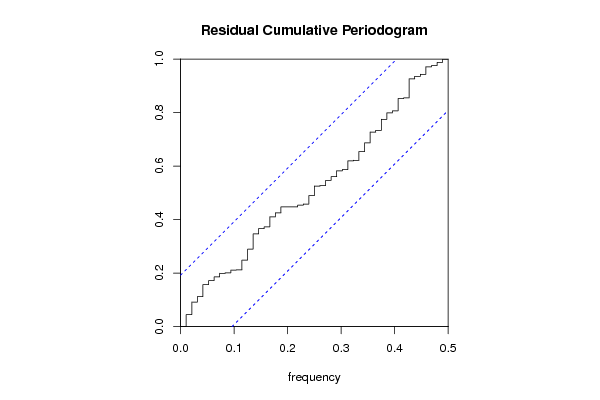
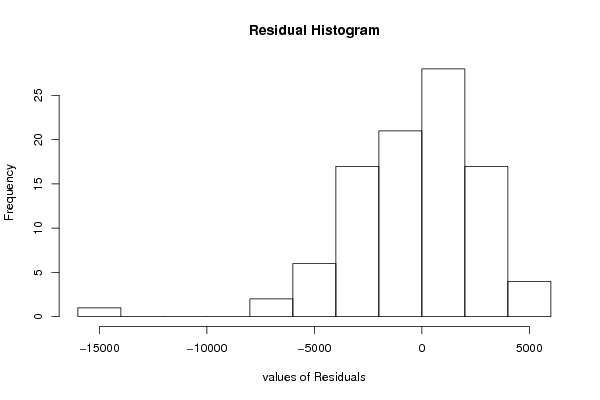
| Charts produced by software: | ||||||||||||||||||||||||||||||||||||||||||||||||||||||||||||||||||||||||||||||||||||||||||||||||||||||||||||||||||||||||||||||||||||||||||||||||||||||||||||||||||||||||||||||||||||||||||||||||||||||||||||||||||||||||||||||||||||||||||||||||||||||||||||||||||||||||||||||||||||||||||||||||||||||||||||||||||||||||||||||||||||||||||||
| ||||||||||||||||||||||||||||||||||||||||||||||||||||||||||||||||||||||||||||||||||||||||||||||||||||||||||||||||||||||||||||||||||||||||||||||||||||||||||||||||||||||||||||||||||||||||||||||||||||||||||||||||||||||||||||||||||||||||||||||||||||||||||||||||||||||||||||||||||||||||||||||||||||||||||||||||||||||||||||||||||||||||||||
| Parameters (Session): | ||||||||||||||||||||||||||||||||||||||||||||||||||||||||||||||||||||||||||||||||||||||||||||||||||||||||||||||||||||||||||||||||||||||||||||||||||||||||||||||||||||||||||||||||||||||||||||||||||||||||||||||||||||||||||||||||||||||||||||||||||||||||||||||||||||||||||||||||||||||||||||||||||||||||||||||||||||||||||||||||||||||||||||
| par1 = 1 ; par2 = 0 ; par3 = 0 ; par4 = 4 ; | ||||||||||||||||||||||||||||||||||||||||||||||||||||||||||||||||||||||||||||||||||||||||||||||||||||||||||||||||||||||||||||||||||||||||||||||||||||||||||||||||||||||||||||||||||||||||||||||||||||||||||||||||||||||||||||||||||||||||||||||||||||||||||||||||||||||||||||||||||||||||||||||||||||||||||||||||||||||||||||||||||||||||||||
| Parameters (R input): | ||||||||||||||||||||||||||||||||||||||||||||||||||||||||||||||||||||||||||||||||||||||||||||||||||||||||||||||||||||||||||||||||||||||||||||||||||||||||||||||||||||||||||||||||||||||||||||||||||||||||||||||||||||||||||||||||||||||||||||||||||||||||||||||||||||||||||||||||||||||||||||||||||||||||||||||||||||||||||||||||||||||||||||
| par1 = FALSE ; par2 = 1 ; par3 = 1 ; par4 = 0 ; par5 = 12 ; par6 = 3 ; par7 = 1 ; par8 = 2 ; par9 = 1 ; | ||||||||||||||||||||||||||||||||||||||||||||||||||||||||||||||||||||||||||||||||||||||||||||||||||||||||||||||||||||||||||||||||||||||||||||||||||||||||||||||||||||||||||||||||||||||||||||||||||||||||||||||||||||||||||||||||||||||||||||||||||||||||||||||||||||||||||||||||||||||||||||||||||||||||||||||||||||||||||||||||||||||||||||
| R code (references can be found in the software module): | ||||||||||||||||||||||||||||||||||||||||||||||||||||||||||||||||||||||||||||||||||||||||||||||||||||||||||||||||||||||||||||||||||||||||||||||||||||||||||||||||||||||||||||||||||||||||||||||||||||||||||||||||||||||||||||||||||||||||||||||||||||||||||||||||||||||||||||||||||||||||||||||||||||||||||||||||||||||||||||||||||||||||||||
| library(lattice)
if (par1 == 'TRUE') par1 <- TRUE if (par1 == 'FALSE') par1 <- FALSE par2 <- as.numeric(par2) #Box-Cox lambda transformation parameter par3 <- as.numeric(par3) #degree of non-seasonal differencing par4 <- as.numeric(par4) #degree of seasonal differencing par5 <- as.numeric(par5) #seasonal period par6 <- as.numeric(par6) #degree (p) of the non-seasonal AR(p) polynomial par7 <- as.numeric(par7) #degree (q) of the non-seasonal MA(q) polynomial par8 <- as.numeric(par8) #degree (P) of the seasonal AR(P) polynomial par9 <- as.numeric(par9) #degree (Q) of the seasonal MA(Q) polynomial armaGR <- function(arima.out, names, n){ try1 <- arima.out$coef try2 <- sqrt(diag(arima.out$var.coef)) try.data.frame <- data.frame(matrix(NA,ncol=4,nrow=length(names))) dimnames(try.data.frame) <- list(names,c('coef','std','tstat','pv')) try.data.frame[,1] <- try1 for(i in 1:length(try2)) try.data.frame[which(rownames(try.data.frame)==names(try2)[i]),2] <- try2[i] try.data.frame[,3] <- try.data.frame[,1] / try.data.frame[,2] try.data.frame[,4] <- round((1-pt(abs(try.data.frame[,3]),df=n-(length(try2)+1)))*2,5) vector <- rep(NA,length(names)) vector[is.na(try.data.frame[,4])] <- 0 maxi <- which.max(try.data.frame[,4]) continue <- max(try.data.frame[,4],na.rm=TRUE) > .05 vector[maxi] <- 0 list(summary=try.data.frame,next.vector=vector,continue=continue) } arimaSelect <- function(series, order=c(13,0,0), seasonal=list(order=c(2,0,0),period=12), include.mean=F){ nrc <- order[1]+order[3]+seasonal$order[1]+seasonal$order[3] coeff <- matrix(NA, nrow=nrc*2, ncol=nrc) pval <- matrix(NA, nrow=nrc*2, ncol=nrc) mylist <- rep(list(NULL), nrc) names <- NULL if(order[1] > 0) names <- paste('ar',1:order[1],sep='') if(order[3] > 0) names <- c( names , paste('ma',1:order[3],sep='') ) if(seasonal$order[1] > 0) names <- c(names, paste('sar',1:seasonal$order[1],sep='')) if(seasonal$order[3] > 0) names <- c(names, paste('sma',1:seasonal$order[3],sep='')) arima.out <- arima(series, order=order, seasonal=seasonal, include.mean=include.mean, method='ML') mylist[[1]] <- arima.out last.arma <- armaGR(arima.out, names, length(series)) mystop <- FALSE i <- 1 coeff[i,] <- last.arma[[1]][,1] pval [i,] <- last.arma[[1]][,4] i <- 2 aic <- arima.out$aic while(!mystop){ mylist[[i]] <- arima.out arima.out <- arima(series, order=order, seasonal=seasonal, include.mean=include.mean, method='ML', fixed=last.arma$next.vector) aic <- c(aic, arima.out$aic) last.arma <- armaGR(arima.out, names, length(series)) mystop <- !last.arma$continue coeff[i,] <- last.arma[[1]][,1] pval [i,] <- last.arma[[1]][,4] i <- i+1 } list(coeff, pval, mylist, aic=aic) } arimaSelectplot <- function(arimaSelect.out,noms,choix){ noms <- names(arimaSelect.out[[3]][[1]]$coef) coeff <- arimaSelect.out[[1]] k <- min(which(is.na(coeff[,1])))-1 coeff <- coeff[1:k,] pval <- arimaSelect.out[[2]][1:k,] aic <- arimaSelect.out$aic[1:k] coeff[coeff==0] <- NA n <- ncol(coeff) if(missing(choix)) choix <- k layout(matrix(c(1,1,1,2, 3,3,3,2, 3,3,3,4, 5,6,7,7),nr=4), widths=c(10,35,45,15), heights=c(30,30,15,15)) couleurs <- rainbow(75)[1:50]#(50) ticks <- pretty(coeff) par(mar=c(1,1,3,1)) plot(aic,k:1-.5,type='o',pch=21,bg='blue',cex=2,axes=F,lty=2,xpd=NA) points(aic[choix],k-choix+.5,pch=21,cex=4,bg=2,xpd=NA) title('aic',line=2) par(mar=c(3,0,0,0)) plot(0,axes=F,xlab='',ylab='',xlim=range(ticks),ylim=c(.1,1)) rect(xleft = min(ticks) + (0:49)/50*(max(ticks)-min(ticks)), xright = min(ticks) + (1:50)/50*(max(ticks)-min(ticks)), ytop = rep(1,50), ybottom= rep(0,50),col=couleurs,border=NA) axis(1,ticks) rect(xleft=min(ticks),xright=max(ticks),ytop=1,ybottom=0) text(mean(coeff,na.rm=T),.5,'coefficients',cex=2,font=2) par(mar=c(1,1,3,1)) image(1:n,1:k,t(coeff[k:1,]),axes=F,col=couleurs,zlim=range(ticks)) for(i in 1:n) for(j in 1:k) if(!is.na(coeff[j,i])) { if(pval[j,i]<.01) symb = 'green' else if( (pval[j,i]<.05) & (pval[j,i]>=.01)) symb = 'orange' else if( (pval[j,i]<.1) & (pval[j,i]>=.05)) symb = 'red' else symb = 'black' polygon(c(i+.5 ,i+.2 ,i+.5 ,i+.5), c(k-j+0.5,k-j+0.5,k-j+0.8,k-j+0.5), col=symb) if(j==choix) { rect(xleft=i-.5, xright=i+.5, ybottom=k-j+1.5, ytop=k-j+.5, lwd=4) text(i, k-j+1, round(coeff[j,i],2), cex=1.2, font=2) } else{ rect(xleft=i-.5,xright=i+.5,ybottom=k-j+1.5,ytop=k-j+.5) text(i,k-j+1,round(coeff[j,i],2),cex=1.2,font=1) } } axis(3,1:n,noms) par(mar=c(0.5,0,0,0.5)) plot(0,axes=F,xlab='',ylab='',type='n',xlim=c(0,8),ylim=c(-.2,.8)) cols <- c('green','orange','red','black') niv <- c('0','0.01','0.05','0.1') for(i in 0:3){ polygon(c(1+2*i ,1+2*i ,1+2*i-.5 ,1+2*i), c(.4 ,.7 , .4 , .4), col=cols[i+1]) text(2*i,0.5,niv[i+1],cex=1.5) } text(8,.5,1,cex=1.5) text(4,0,'p-value',cex=2) box() residus <- arimaSelect.out[[3]][[choix]]$res par(mar=c(1,2,4,1)) acf(residus,main='') title('acf',line=.5) par(mar=c(1,2,4,1)) pacf(residus,main='') title('pacf',line=.5) par(mar=c(2,2,4,1)) qqnorm(residus,main='') title('qq-norm',line=.5) qqline(residus) residus } if (par2 == 0) x <- log(x) if (par2 != 0) x <- x^par2 (selection <- arimaSelect(x, order=c(par6,par3,par7), seasonal=list(order=c(par8,par4,par9), period=par5))) bitmap(file='test1.png') resid <- arimaSelectplot(selection) dev.off() resid bitmap(file='test2.png') acf(resid,length(resid)/2, main='Residual Autocorrelation Function') dev.off() bitmap(file='test3.png') pacf(resid,length(resid)/2, main='Residual Partial Autocorrelation Function') dev.off() bitmap(file='test4.png') cpgram(resid, main='Residual Cumulative Periodogram') dev.off() bitmap(file='test5.png') hist(resid, main='Residual Histogram', xlab='values of Residuals') dev.off() bitmap(file='test6.png') densityplot(~resid,col='black',main='Residual Density Plot', xlab='values of Residuals') dev.off() bitmap(file='test7.png') qqnorm(resid, main='Residual Normal Q-Q Plot') qqline(resid) dev.off() ncols <- length(selection[[1]][1,]) nrows <- length(selection[[2]][,1])-1 load(file='createtable') a<-table.start() a<-table.row.start(a) a<-table.element(a,'ARIMA Parameter Estimation and Backward Selection', ncols+1,TRUE) a<-table.row.end(a) a<-table.row.start(a) a<-table.element(a,'Iteration', header=TRUE) for (i in 1:ncols) { a<-table.element(a,names(selection[[3]][[1]]$coef)[i],header=TRUE) } a<-table.row.end(a) for (j in 1:nrows) { a<-table.row.start(a) mydum <- 'Estimates (' mydum <- paste(mydum,j) mydum <- paste(mydum,')') a<-table.element(a,mydum, header=TRUE) for (i in 1:ncols) { a<-table.element(a,round(selection[[1]][j,i],4)) } a<-table.row.end(a) a<-table.row.start(a) a<-table.element(a,'(p-val)', header=TRUE) for (i in 1:ncols) { mydum <- '(' mydum <- paste(mydum,round(selection[[2]][j,i],4),sep='') mydum <- paste(mydum,')') a<-table.element(a,mydum) } a<-table.row.end(a) } a<-table.end(a) table.save(a,file='mytable.tab') a<-table.start() a<-table.row.start(a) a<-table.element(a,'Estimated ARIMA Residuals', 1,TRUE) a<-table.row.end(a) a<-table.row.start(a) a<-table.element(a,'Value', 1,TRUE) a<-table.row.end(a) for (i in (par4*par5+par3):length(resid)) { a<-table.row.start(a) a<-table.element(a,resid[i]) a<-table.row.end(a) } a<-table.end(a) table.save(a,file='mytable1.tab') | ||||||||||||||||||||||||||||||||||||||||||||||||||||||||||||||||||||||||||||||||||||||||||||||||||||||||||||||||||||||||||||||||||||||||||||||||||||||||||||||||||||||||||||||||||||||||||||||||||||||||||||||||||||||||||||||||||||||||||||||||||||||||||||||||||||||||||||||||||||||||||||||||||||||||||||||||||||||||||||||||||||||||||||


Copyright

This work is licensed under a
Creative Commons Attribution-Noncommercial-Share Alike 3.0 License.
Software written by Ed van Stee & Patrick Wessa
Disclaimer
Information provided on this web site is provided "AS IS" without warranty of any kind, either express or implied, including, without limitation, warranties of merchantability, fitness for a particular purpose, and noninfringement. We use reasonable efforts to include accurate and timely information and periodically update the information, and software without notice. However, we make no warranties or representations as to the accuracy or completeness of such information (or software), and we assume no liability or responsibility for errors or omissions in the content of this web site, or any software bugs in online applications. Your use of this web site is AT YOUR OWN RISK. Under no circumstances and under no legal theory shall we be liable to you or any other person for any direct, indirect, special, incidental, exemplary, or consequential damages arising from your access to, or use of, this web site.
Privacy Policy
We may request personal information to be submitted to our servers in order to be able to:
- personalize online software applications according to your needs
- enforce strict security rules with respect to the data that you upload (e.g. statistical data)
- manage user sessions of online applications
- alert you about important changes or upgrades in resources or applications
We NEVER allow other companies to directly offer registered users information about their products and services. Banner references and hyperlinks of third parties NEVER contain any personal data of the visitor.
We do NOT sell, nor transmit by any means, personal information, nor statistical data series uploaded by you to third parties.
We carefully protect your data from loss, misuse, alteration,
and destruction. However, at any time, and under any circumstance you
are solely responsible for managing your passwords, and keeping them
secret.
We store a unique ANONYMOUS USER ID in the form of a small 'Cookie' on your computer. This allows us to track your progress when using this website which is necessary to create state-dependent features. The cookie is used for NO OTHER PURPOSE. At any time you may opt to disallow cookies from this website - this will not affect other features of this website.
We examine cookies that are used by third-parties (banner and online ads) very closely: abuse from third-parties automatically results in termination of the advertising contract without refund. We have very good reason to believe that the cookies that are produced by third parties (banner ads) do NOT cause any privacy or security risk.
FreeStatistics.org is safe. There is no need to download any software to use the applications and services contained in this website. Hence, your system's security is not compromised by their use, and your personal data - other than data you submit in the account application form, and the user-agent information that is transmitted by your browser - is never transmitted to our servers.
As a general rule, we do not log on-line behavior of individuals (other than normal logging of webserver 'hits'). However, in cases of abuse, hacking, unauthorized access, Denial of Service attacks, illegal copying, hotlinking, non-compliance with international webstandards (such as robots.txt), or any other harmful behavior, our system engineers are empowered to log, track, identify, publish, and ban misbehaving individuals - even if this leads to ban entire blocks of IP addresses, or disclosing user's identity.