Free Statistics

of Irreproducible Research!

Author's title

Author*The author of this computation has been verified*
R Software Modulerwasp_multipleregression.wasp
Title produced by softwareMultiple Regression
Date of computationSun, 26 Dec 2010 17:37:56 +0000
Cite this page as followsStatistical Computations at FreeStatistics.org, Office for Research Development and Education, URL https://freestatistics.org/blog/index.php?v=date/2010/Dec/26/t1293384954rhtgz4cf8pthdpi.htm/, Retrieved Fri, 03 May 2024 14:05:36 +0000
Statistical Computations at FreeStatistics.org, Office for Research Development and Education, URL https://freestatistics.org/blog/index.php?pk=115744, Retrieved Fri, 03 May 2024 14:05:36 +0000
QR Codes:

Original text written by user:
IsPrivate?No (this computation is public)
User-defined keywords
Estimated Impact150
Family? (F = Feedback message, R = changed R code, M = changed R Module, P = changed Parameters, D = changed Data)
-     [Multiple Regression] [HPC Retail Sales] [2008-03-08 13:40:54] [1c0f2c85e8a48e42648374b3bcceca26]
- RMPD  [Multiple Regression] [] [2010-11-26 11:40:42] [d39e5c40c631ed6c22677d2e41dbfc7d]
-    D    [Multiple Regression] [] [2010-12-15 20:39:35] [d39e5c40c631ed6c22677d2e41dbfc7d]
-   PD        [Multiple Regression] [paper Regression ...] [2010-12-26 17:37:56] [6df2229e3f2091de42c4a9cf9a617420] [Current]
Feedback Forum

Post a new message
Dataseries X:
2,08
2,09
2,07
2,04
2,35
2,33
2,37
2,59
2,62
2,6
2,83
2,78
3,01
3,06
3,33
3,32
3,6
3,57
3,57
3,83
3,84
3,8
4,07
4,05
4,272
3,858
4,067
3,964
3,782
4,114
4,009
4,025
4,082
4,044
3,916
4,289
4,296
4,193
3,48
2,934
2,221
1,211
1,28
0,96
0,5
0,687
0,344
0,346
0,334
0,34
0,328
0,344
0,341
0,32
0,314
0,325
0,339
0,329
0,48
0,399
0,37


Summary of computational transaction
Raw Inputview raw input (R code)
Raw Outputview raw output of R engine
Computing time6 seconds
R Server'Gwilym Jenkins' @ 72.249.127.135

\begin{tabular}{lllllllll}
\hline
Summary of computational transaction \tabularnewline
Raw Input & view raw input (R code)  \tabularnewline
Raw Output & view raw output of R engine  \tabularnewline
Computing time & 6 seconds \tabularnewline
R Server & 'Gwilym Jenkins' @ 72.249.127.135 \tabularnewline
\hline
\end{tabular}
%Source: https://freestatistics.org/blog/index.php?pk=115744&T=0

[TABLE]
[ROW][C]Summary of computational transaction[/C][/ROW]
[ROW][C]Raw Input[/C][C]view raw input (R code) [/C][/ROW]
[ROW][C]Raw Output[/C][C]view raw output of R engine [/C][/ROW]
[ROW][C]Computing time[/C][C]6 seconds[/C][/ROW]
[ROW][C]R Server[/C][C]'Gwilym Jenkins' @ 72.249.127.135[/C][/ROW]
[/TABLE]
Source: https://freestatistics.org/blog/index.php?pk=115744&T=0

Globally Unique Identifier (entire table): ba.freestatistics.org/blog/index.php?pk=115744&T=0

As an alternative you can also use a QR Code:  

The GUIDs for individual cells are displayed in the table below:

Summary of computational transaction
Raw Inputview raw input (R code)
Raw Outputview raw output of R engine
Computing time6 seconds
R Server'Gwilym Jenkins' @ 72.249.127.135


Multiple Linear Regression - Estimated Regression Equation
eonia[t] = + 4.15592941176471 -0.226790196078433M1[t] -0.159913725490198M2[t] -0.163582352941180M3[t] -0.24865098039216M4[t] -0.260719607843140M5[t] -0.36098823529412M6[t] -0.311856862745100M7[t] -0.22492549019608M8[t] -0.245194117647061M9[t] -0.179862745098042M10[t] -0.0943313725490219M11[t] -0.0495313725490196t + e[t]

\begin{tabular}{lllllllll}
\hline
Multiple Linear Regression - Estimated Regression Equation \tabularnewline
eonia[t] =  +  4.15592941176471 -0.226790196078433M1[t] -0.159913725490198M2[t] -0.163582352941180M3[t] -0.24865098039216M4[t] -0.260719607843140M5[t] -0.36098823529412M6[t] -0.311856862745100M7[t] -0.22492549019608M8[t] -0.245194117647061M9[t] -0.179862745098042M10[t] -0.0943313725490219M11[t] -0.0495313725490196t  + e[t] \tabularnewline
\hline
\end{tabular}
%Source: https://freestatistics.org/blog/index.php?pk=115744&T=1

[TABLE]
[ROW][C]Multiple Linear Regression - Estimated Regression Equation[/C][/ROW]
[ROW][C]eonia[t] =  +  4.15592941176471 -0.226790196078433M1[t] -0.159913725490198M2[t] -0.163582352941180M3[t] -0.24865098039216M4[t] -0.260719607843140M5[t] -0.36098823529412M6[t] -0.311856862745100M7[t] -0.22492549019608M8[t] -0.245194117647061M9[t] -0.179862745098042M10[t] -0.0943313725490219M11[t] -0.0495313725490196t  + e[t][/C][/ROW]
[/TABLE]
Source: https://freestatistics.org/blog/index.php?pk=115744&T=1

Globally Unique Identifier (entire table): ba.freestatistics.org/blog/index.php?pk=115744&T=1

As an alternative you can also use a QR Code:  

The GUIDs for individual cells are displayed in the table below:

Multiple Linear Regression - Estimated Regression Equation
eonia[t] = + 4.15592941176471 -0.226790196078433M1[t] -0.159913725490198M2[t] -0.163582352941180M3[t] -0.24865098039216M4[t] -0.260719607843140M5[t] -0.36098823529412M6[t] -0.311856862745100M7[t] -0.22492549019608M8[t] -0.245194117647061M9[t] -0.179862745098042M10[t] -0.0943313725490219M11[t] -0.0495313725490196t + e[t]


Multiple Linear Regression - Ordinary Least Squares
VariableParameterS.D.T-STATH0: parameter = 02-tail p-value1-tail p-value
(Intercept)4.155929411764710.7041255.902300
M1-0.2267901960784330.821175-0.27620.7835970.391799
M2-0.1599137254901980.861911-0.18550.8535920.426796
M3-0.1635823529411800.86081-0.190.8500850.425042
M4-0.248650980392160.859824-0.28920.7736830.386841
M5-0.2607196078431400.858953-0.30350.7627960.381398
M6-0.360988235294120.858197-0.42060.6758990.337949
M7-0.3118568627451000.857558-0.36370.7177110.358855
M8-0.224925490196080.857034-0.26240.79410.39705
M9-0.2451941176470610.856626-0.28620.7759320.387966
M10-0.1798627450980420.856335-0.210.8345270.417264
M11-0.09433137254902190.85616-0.11020.9127260.456363
t-0.04953137254901960.00999-4.95829e-065e-06

\begin{tabular}{lllllllll}
\hline
Multiple Linear Regression - Ordinary Least Squares \tabularnewline
Variable & Parameter & S.D. & T-STATH0: parameter = 0 & 2-tail p-value & 1-tail p-value \tabularnewline
(Intercept) & 4.15592941176471 & 0.704125 & 5.9023 & 0 & 0 \tabularnewline
M1 & -0.226790196078433 & 0.821175 & -0.2762 & 0.783597 & 0.391799 \tabularnewline
M2 & -0.159913725490198 & 0.861911 & -0.1855 & 0.853592 & 0.426796 \tabularnewline
M3 & -0.163582352941180 & 0.86081 & -0.19 & 0.850085 & 0.425042 \tabularnewline
M4 & -0.24865098039216 & 0.859824 & -0.2892 & 0.773683 & 0.386841 \tabularnewline
M5 & -0.260719607843140 & 0.858953 & -0.3035 & 0.762796 & 0.381398 \tabularnewline
M6 & -0.36098823529412 & 0.858197 & -0.4206 & 0.675899 & 0.337949 \tabularnewline
M7 & -0.311856862745100 & 0.857558 & -0.3637 & 0.717711 & 0.358855 \tabularnewline
M8 & -0.22492549019608 & 0.857034 & -0.2624 & 0.7941 & 0.39705 \tabularnewline
M9 & -0.245194117647061 & 0.856626 & -0.2862 & 0.775932 & 0.387966 \tabularnewline
M10 & -0.179862745098042 & 0.856335 & -0.21 & 0.834527 & 0.417264 \tabularnewline
M11 & -0.0943313725490219 & 0.85616 & -0.1102 & 0.912726 & 0.456363 \tabularnewline
t & -0.0495313725490196 & 0.00999 & -4.9582 & 9e-06 & 5e-06 \tabularnewline
\hline
\end{tabular}
%Source: https://freestatistics.org/blog/index.php?pk=115744&T=2

[TABLE]
[ROW][C]Multiple Linear Regression - Ordinary Least Squares[/C][/ROW]
[ROW][C]Variable[/C][C]Parameter[/C][C]S.D.[/C][C]T-STATH0: parameter = 0[/C][C]2-tail p-value[/C][C]1-tail p-value[/C][/ROW]
[ROW][C](Intercept)[/C][C]4.15592941176471[/C][C]0.704125[/C][C]5.9023[/C][C]0[/C][C]0[/C][/ROW]
[ROW][C]M1[/C][C]-0.226790196078433[/C][C]0.821175[/C][C]-0.2762[/C][C]0.783597[/C][C]0.391799[/C][/ROW]
[ROW][C]M2[/C][C]-0.159913725490198[/C][C]0.861911[/C][C]-0.1855[/C][C]0.853592[/C][C]0.426796[/C][/ROW]
[ROW][C]M3[/C][C]-0.163582352941180[/C][C]0.86081[/C][C]-0.19[/C][C]0.850085[/C][C]0.425042[/C][/ROW]
[ROW][C]M4[/C][C]-0.24865098039216[/C][C]0.859824[/C][C]-0.2892[/C][C]0.773683[/C][C]0.386841[/C][/ROW]
[ROW][C]M5[/C][C]-0.260719607843140[/C][C]0.858953[/C][C]-0.3035[/C][C]0.762796[/C][C]0.381398[/C][/ROW]
[ROW][C]M6[/C][C]-0.36098823529412[/C][C]0.858197[/C][C]-0.4206[/C][C]0.675899[/C][C]0.337949[/C][/ROW]
[ROW][C]M7[/C][C]-0.311856862745100[/C][C]0.857558[/C][C]-0.3637[/C][C]0.717711[/C][C]0.358855[/C][/ROW]
[ROW][C]M8[/C][C]-0.22492549019608[/C][C]0.857034[/C][C]-0.2624[/C][C]0.7941[/C][C]0.39705[/C][/ROW]
[ROW][C]M9[/C][C]-0.245194117647061[/C][C]0.856626[/C][C]-0.2862[/C][C]0.775932[/C][C]0.387966[/C][/ROW]
[ROW][C]M10[/C][C]-0.179862745098042[/C][C]0.856335[/C][C]-0.21[/C][C]0.834527[/C][C]0.417264[/C][/ROW]
[ROW][C]M11[/C][C]-0.0943313725490219[/C][C]0.85616[/C][C]-0.1102[/C][C]0.912726[/C][C]0.456363[/C][/ROW]
[ROW][C]t[/C][C]-0.0495313725490196[/C][C]0.00999[/C][C]-4.9582[/C][C]9e-06[/C][C]5e-06[/C][/ROW]
[/TABLE]
Source: https://freestatistics.org/blog/index.php?pk=115744&T=2

Globally Unique Identifier (entire table): ba.freestatistics.org/blog/index.php?pk=115744&T=2

As an alternative you can also use a QR Code:  

The GUIDs for individual cells are displayed in the table below:

Multiple Linear Regression - Ordinary Least Squares
VariableParameterS.D.T-STATH0: parameter = 02-tail p-value1-tail p-value
(Intercept)4.155929411764710.7041255.902300
M1-0.2267901960784330.821175-0.27620.7835970.391799
M2-0.1599137254901980.861911-0.18550.8535920.426796
M3-0.1635823529411800.86081-0.190.8500850.425042
M4-0.248650980392160.859824-0.28920.7736830.386841
M5-0.2607196078431400.858953-0.30350.7627960.381398
M6-0.360988235294120.858197-0.42060.6758990.337949
M7-0.3118568627451000.857558-0.36370.7177110.358855
M8-0.224925490196080.857034-0.26240.79410.39705
M9-0.2451941176470610.856626-0.28620.7759320.387966
M10-0.1798627450980420.856335-0.210.8345270.417264
M11-0.09433137254902190.85616-0.11020.9127260.456363
t-0.04953137254901960.00999-4.95829e-065e-06


Multiple Linear Regression - Regression Statistics
Multiple R0.586785378864402
R-squared0.344317080849039
Adjusted R-squared0.180396351061299
F-TEST (value)2.10050968718168
F-TEST (DF numerator)12
F-TEST (DF denominator)48
p-value0.0348169075442155
Multiple Linear Regression - Residual Statistics
Residual Standard Deviation1.35361562785521
Sum Squared Residuals87.9492128627451

\begin{tabular}{lllllllll}
\hline
Multiple Linear Regression - Regression Statistics \tabularnewline
Multiple R & 0.586785378864402 \tabularnewline
R-squared & 0.344317080849039 \tabularnewline
Adjusted R-squared & 0.180396351061299 \tabularnewline
F-TEST (value) & 2.10050968718168 \tabularnewline
F-TEST (DF numerator) & 12 \tabularnewline
F-TEST (DF denominator) & 48 \tabularnewline
p-value & 0.0348169075442155 \tabularnewline
Multiple Linear Regression - Residual Statistics \tabularnewline
Residual Standard Deviation & 1.35361562785521 \tabularnewline
Sum Squared Residuals & 87.9492128627451 \tabularnewline
\hline
\end{tabular}
%Source: https://freestatistics.org/blog/index.php?pk=115744&T=3

[TABLE]
[ROW][C]Multiple Linear Regression - Regression Statistics[/C][/ROW]
[ROW][C]Multiple R[/C][C]0.586785378864402[/C][/ROW]
[ROW][C]R-squared[/C][C]0.344317080849039[/C][/ROW]
[ROW][C]Adjusted R-squared[/C][C]0.180396351061299[/C][/ROW]
[ROW][C]F-TEST (value)[/C][C]2.10050968718168[/C][/ROW]
[ROW][C]F-TEST (DF numerator)[/C][C]12[/C][/ROW]
[ROW][C]F-TEST (DF denominator)[/C][C]48[/C][/ROW]
[ROW][C]p-value[/C][C]0.0348169075442155[/C][/ROW]
[ROW][C]Multiple Linear Regression - Residual Statistics[/C][/ROW]
[ROW][C]Residual Standard Deviation[/C][C]1.35361562785521[/C][/ROW]
[ROW][C]Sum Squared Residuals[/C][C]87.9492128627451[/C][/ROW]
[/TABLE]
Source: https://freestatistics.org/blog/index.php?pk=115744&T=3

Globally Unique Identifier (entire table): ba.freestatistics.org/blog/index.php?pk=115744&T=3

As an alternative you can also use a QR Code:  

The GUIDs for individual cells are displayed in the table below:

Multiple Linear Regression - Regression Statistics
Multiple R0.586785378864402
R-squared0.344317080849039
Adjusted R-squared0.180396351061299
F-TEST (value)2.10050968718168
F-TEST (DF numerator)12
F-TEST (DF denominator)48
p-value0.0348169075442155
Multiple Linear Regression - Residual Statistics
Residual Standard Deviation1.35361562785521
Sum Squared Residuals87.9492128627451


Multiple Linear Regression - Actuals, Interpolation, and Residuals
Time or IndexActualsInterpolationForecastResidualsPrediction Error
12.083.87960784313725-1.79960784313725
22.093.89695294117647-1.80695294117647
32.073.84375294117647-1.77375294117647
42.043.70915294117647-1.66915294117647
52.353.64755294117647-1.29755294117647
62.333.49775294117647-1.16775294117647
72.373.49735294117647-1.12735294117647
82.593.53475294117647-0.94475294117647
92.623.46495294117647-0.84495294117647
102.63.48075294117647-0.880752941176471
112.833.51675294117647-0.686752941176471
122.783.56155294117647-0.781552941176473
133.013.28523137254902-0.275231372549022
143.063.30257647058824-0.242576470588235
153.333.249376470588230.080623529411766
163.323.114776470588230.205223529411765
173.63.053176470588240.546823529411764
183.572.903376470588240.666623529411765
193.572.902976470588240.667023529411764
203.832.940376470588240.889623529411764
213.842.870576470588240.969423529411764
223.82.886376470588240.913623529411764
234.072.922376470588241.14762352941176
244.052.967176470588241.08282352941176
254.2722.690854901960781.58114509803922
263.8582.70821.1498
274.0672.6551.412
283.9642.52041.4436
293.7822.45881.3232
304.1142.3091.805
314.0092.30861.7004
324.0252.3461.679
334.0822.27621.8058
344.0442.2921.752
353.9162.3281.588
364.2892.37281.91620000000000
374.2962.096478431372552.19952156862745
384.1932.113823529411762.07917647058824
393.482.060623529411761.41937647058824
402.9341.926023529411761.00797647058824
412.2211.864423529411760.356576470588236
421.2111.71462352941176-0.503623529411764
431.281.71422352941176-0.434223529411764
440.961.75162352941177-0.791623529411765
450.51.68182352941176-1.18182352941176
460.6871.69762352941176-1.01062352941176
470.3441.73362352941176-1.38962352941176
480.3461.77842352941177-1.43242352941177
490.3341.50210196078431-1.16810196078431
500.341.51944705882353-1.17944705882353
510.3281.46624705882353-1.13824705882353
520.3441.33164705882353-0.987647058823528
530.3411.27004705882353-0.929047058823529
540.321.12024705882353-0.800247058823529
550.3141.11984705882353-0.80584705882353
560.3251.15724705882353-0.83224705882353
570.3391.08744705882353-0.74844705882353
580.3291.10324705882353-0.774247058823529
590.481.13924705882353-0.65924705882353
600.3991.18404705882353-0.785047058823532
610.370.90772549019608-0.537725490196079

\begin{tabular}{lllllllll}
\hline
Multiple Linear Regression - Actuals, Interpolation, and Residuals \tabularnewline
Time or Index & Actuals & InterpolationForecast & ResidualsPrediction Error \tabularnewline
1 & 2.08 & 3.87960784313725 & -1.79960784313725 \tabularnewline
2 & 2.09 & 3.89695294117647 & -1.80695294117647 \tabularnewline
3 & 2.07 & 3.84375294117647 & -1.77375294117647 \tabularnewline
4 & 2.04 & 3.70915294117647 & -1.66915294117647 \tabularnewline
5 & 2.35 & 3.64755294117647 & -1.29755294117647 \tabularnewline
6 & 2.33 & 3.49775294117647 & -1.16775294117647 \tabularnewline
7 & 2.37 & 3.49735294117647 & -1.12735294117647 \tabularnewline
8 & 2.59 & 3.53475294117647 & -0.94475294117647 \tabularnewline
9 & 2.62 & 3.46495294117647 & -0.84495294117647 \tabularnewline
10 & 2.6 & 3.48075294117647 & -0.880752941176471 \tabularnewline
11 & 2.83 & 3.51675294117647 & -0.686752941176471 \tabularnewline
12 & 2.78 & 3.56155294117647 & -0.781552941176473 \tabularnewline
13 & 3.01 & 3.28523137254902 & -0.275231372549022 \tabularnewline
14 & 3.06 & 3.30257647058824 & -0.242576470588235 \tabularnewline
15 & 3.33 & 3.24937647058823 & 0.080623529411766 \tabularnewline
16 & 3.32 & 3.11477647058823 & 0.205223529411765 \tabularnewline
17 & 3.6 & 3.05317647058824 & 0.546823529411764 \tabularnewline
18 & 3.57 & 2.90337647058824 & 0.666623529411765 \tabularnewline
19 & 3.57 & 2.90297647058824 & 0.667023529411764 \tabularnewline
20 & 3.83 & 2.94037647058824 & 0.889623529411764 \tabularnewline
21 & 3.84 & 2.87057647058824 & 0.969423529411764 \tabularnewline
22 & 3.8 & 2.88637647058824 & 0.913623529411764 \tabularnewline
23 & 4.07 & 2.92237647058824 & 1.14762352941176 \tabularnewline
24 & 4.05 & 2.96717647058824 & 1.08282352941176 \tabularnewline
25 & 4.272 & 2.69085490196078 & 1.58114509803922 \tabularnewline
26 & 3.858 & 2.7082 & 1.1498 \tabularnewline
27 & 4.067 & 2.655 & 1.412 \tabularnewline
28 & 3.964 & 2.5204 & 1.4436 \tabularnewline
29 & 3.782 & 2.4588 & 1.3232 \tabularnewline
30 & 4.114 & 2.309 & 1.805 \tabularnewline
31 & 4.009 & 2.3086 & 1.7004 \tabularnewline
32 & 4.025 & 2.346 & 1.679 \tabularnewline
33 & 4.082 & 2.2762 & 1.8058 \tabularnewline
34 & 4.044 & 2.292 & 1.752 \tabularnewline
35 & 3.916 & 2.328 & 1.588 \tabularnewline
36 & 4.289 & 2.3728 & 1.91620000000000 \tabularnewline
37 & 4.296 & 2.09647843137255 & 2.19952156862745 \tabularnewline
38 & 4.193 & 2.11382352941176 & 2.07917647058824 \tabularnewline
39 & 3.48 & 2.06062352941176 & 1.41937647058824 \tabularnewline
40 & 2.934 & 1.92602352941176 & 1.00797647058824 \tabularnewline
41 & 2.221 & 1.86442352941176 & 0.356576470588236 \tabularnewline
42 & 1.211 & 1.71462352941176 & -0.503623529411764 \tabularnewline
43 & 1.28 & 1.71422352941176 & -0.434223529411764 \tabularnewline
44 & 0.96 & 1.75162352941177 & -0.791623529411765 \tabularnewline
45 & 0.5 & 1.68182352941176 & -1.18182352941176 \tabularnewline
46 & 0.687 & 1.69762352941176 & -1.01062352941176 \tabularnewline
47 & 0.344 & 1.73362352941176 & -1.38962352941176 \tabularnewline
48 & 0.346 & 1.77842352941177 & -1.43242352941177 \tabularnewline
49 & 0.334 & 1.50210196078431 & -1.16810196078431 \tabularnewline
50 & 0.34 & 1.51944705882353 & -1.17944705882353 \tabularnewline
51 & 0.328 & 1.46624705882353 & -1.13824705882353 \tabularnewline
52 & 0.344 & 1.33164705882353 & -0.987647058823528 \tabularnewline
53 & 0.341 & 1.27004705882353 & -0.929047058823529 \tabularnewline
54 & 0.32 & 1.12024705882353 & -0.800247058823529 \tabularnewline
55 & 0.314 & 1.11984705882353 & -0.80584705882353 \tabularnewline
56 & 0.325 & 1.15724705882353 & -0.83224705882353 \tabularnewline
57 & 0.339 & 1.08744705882353 & -0.74844705882353 \tabularnewline
58 & 0.329 & 1.10324705882353 & -0.774247058823529 \tabularnewline
59 & 0.48 & 1.13924705882353 & -0.65924705882353 \tabularnewline
60 & 0.399 & 1.18404705882353 & -0.785047058823532 \tabularnewline
61 & 0.37 & 0.90772549019608 & -0.537725490196079 \tabularnewline
\hline
\end{tabular}
%Source: https://freestatistics.org/blog/index.php?pk=115744&T=4

[TABLE]
[ROW][C]Multiple Linear Regression - Actuals, Interpolation, and Residuals[/C][/ROW]
[ROW][C]Time or Index[/C][C]Actuals[/C][C]InterpolationForecast[/C][C]ResidualsPrediction Error[/C][/ROW]
[ROW][C]1[/C][C]2.08[/C][C]3.87960784313725[/C][C]-1.79960784313725[/C][/ROW]
[ROW][C]2[/C][C]2.09[/C][C]3.89695294117647[/C][C]-1.80695294117647[/C][/ROW]
[ROW][C]3[/C][C]2.07[/C][C]3.84375294117647[/C][C]-1.77375294117647[/C][/ROW]
[ROW][C]4[/C][C]2.04[/C][C]3.70915294117647[/C][C]-1.66915294117647[/C][/ROW]
[ROW][C]5[/C][C]2.35[/C][C]3.64755294117647[/C][C]-1.29755294117647[/C][/ROW]
[ROW][C]6[/C][C]2.33[/C][C]3.49775294117647[/C][C]-1.16775294117647[/C][/ROW]
[ROW][C]7[/C][C]2.37[/C][C]3.49735294117647[/C][C]-1.12735294117647[/C][/ROW]
[ROW][C]8[/C][C]2.59[/C][C]3.53475294117647[/C][C]-0.94475294117647[/C][/ROW]
[ROW][C]9[/C][C]2.62[/C][C]3.46495294117647[/C][C]-0.84495294117647[/C][/ROW]
[ROW][C]10[/C][C]2.6[/C][C]3.48075294117647[/C][C]-0.880752941176471[/C][/ROW]
[ROW][C]11[/C][C]2.83[/C][C]3.51675294117647[/C][C]-0.686752941176471[/C][/ROW]
[ROW][C]12[/C][C]2.78[/C][C]3.56155294117647[/C][C]-0.781552941176473[/C][/ROW]
[ROW][C]13[/C][C]3.01[/C][C]3.28523137254902[/C][C]-0.275231372549022[/C][/ROW]
[ROW][C]14[/C][C]3.06[/C][C]3.30257647058824[/C][C]-0.242576470588235[/C][/ROW]
[ROW][C]15[/C][C]3.33[/C][C]3.24937647058823[/C][C]0.080623529411766[/C][/ROW]
[ROW][C]16[/C][C]3.32[/C][C]3.11477647058823[/C][C]0.205223529411765[/C][/ROW]
[ROW][C]17[/C][C]3.6[/C][C]3.05317647058824[/C][C]0.546823529411764[/C][/ROW]
[ROW][C]18[/C][C]3.57[/C][C]2.90337647058824[/C][C]0.666623529411765[/C][/ROW]
[ROW][C]19[/C][C]3.57[/C][C]2.90297647058824[/C][C]0.667023529411764[/C][/ROW]
[ROW][C]20[/C][C]3.83[/C][C]2.94037647058824[/C][C]0.889623529411764[/C][/ROW]
[ROW][C]21[/C][C]3.84[/C][C]2.87057647058824[/C][C]0.969423529411764[/C][/ROW]
[ROW][C]22[/C][C]3.8[/C][C]2.88637647058824[/C][C]0.913623529411764[/C][/ROW]
[ROW][C]23[/C][C]4.07[/C][C]2.92237647058824[/C][C]1.14762352941176[/C][/ROW]
[ROW][C]24[/C][C]4.05[/C][C]2.96717647058824[/C][C]1.08282352941176[/C][/ROW]
[ROW][C]25[/C][C]4.272[/C][C]2.69085490196078[/C][C]1.58114509803922[/C][/ROW]
[ROW][C]26[/C][C]3.858[/C][C]2.7082[/C][C]1.1498[/C][/ROW]
[ROW][C]27[/C][C]4.067[/C][C]2.655[/C][C]1.412[/C][/ROW]
[ROW][C]28[/C][C]3.964[/C][C]2.5204[/C][C]1.4436[/C][/ROW]
[ROW][C]29[/C][C]3.782[/C][C]2.4588[/C][C]1.3232[/C][/ROW]
[ROW][C]30[/C][C]4.114[/C][C]2.309[/C][C]1.805[/C][/ROW]
[ROW][C]31[/C][C]4.009[/C][C]2.3086[/C][C]1.7004[/C][/ROW]
[ROW][C]32[/C][C]4.025[/C][C]2.346[/C][C]1.679[/C][/ROW]
[ROW][C]33[/C][C]4.082[/C][C]2.2762[/C][C]1.8058[/C][/ROW]
[ROW][C]34[/C][C]4.044[/C][C]2.292[/C][C]1.752[/C][/ROW]
[ROW][C]35[/C][C]3.916[/C][C]2.328[/C][C]1.588[/C][/ROW]
[ROW][C]36[/C][C]4.289[/C][C]2.3728[/C][C]1.91620000000000[/C][/ROW]
[ROW][C]37[/C][C]4.296[/C][C]2.09647843137255[/C][C]2.19952156862745[/C][/ROW]
[ROW][C]38[/C][C]4.193[/C][C]2.11382352941176[/C][C]2.07917647058824[/C][/ROW]
[ROW][C]39[/C][C]3.48[/C][C]2.06062352941176[/C][C]1.41937647058824[/C][/ROW]
[ROW][C]40[/C][C]2.934[/C][C]1.92602352941176[/C][C]1.00797647058824[/C][/ROW]
[ROW][C]41[/C][C]2.221[/C][C]1.86442352941176[/C][C]0.356576470588236[/C][/ROW]
[ROW][C]42[/C][C]1.211[/C][C]1.71462352941176[/C][C]-0.503623529411764[/C][/ROW]
[ROW][C]43[/C][C]1.28[/C][C]1.71422352941176[/C][C]-0.434223529411764[/C][/ROW]
[ROW][C]44[/C][C]0.96[/C][C]1.75162352941177[/C][C]-0.791623529411765[/C][/ROW]
[ROW][C]45[/C][C]0.5[/C][C]1.68182352941176[/C][C]-1.18182352941176[/C][/ROW]
[ROW][C]46[/C][C]0.687[/C][C]1.69762352941176[/C][C]-1.01062352941176[/C][/ROW]
[ROW][C]47[/C][C]0.344[/C][C]1.73362352941176[/C][C]-1.38962352941176[/C][/ROW]
[ROW][C]48[/C][C]0.346[/C][C]1.77842352941177[/C][C]-1.43242352941177[/C][/ROW]
[ROW][C]49[/C][C]0.334[/C][C]1.50210196078431[/C][C]-1.16810196078431[/C][/ROW]
[ROW][C]50[/C][C]0.34[/C][C]1.51944705882353[/C][C]-1.17944705882353[/C][/ROW]
[ROW][C]51[/C][C]0.328[/C][C]1.46624705882353[/C][C]-1.13824705882353[/C][/ROW]
[ROW][C]52[/C][C]0.344[/C][C]1.33164705882353[/C][C]-0.987647058823528[/C][/ROW]
[ROW][C]53[/C][C]0.341[/C][C]1.27004705882353[/C][C]-0.929047058823529[/C][/ROW]
[ROW][C]54[/C][C]0.32[/C][C]1.12024705882353[/C][C]-0.800247058823529[/C][/ROW]
[ROW][C]55[/C][C]0.314[/C][C]1.11984705882353[/C][C]-0.80584705882353[/C][/ROW]
[ROW][C]56[/C][C]0.325[/C][C]1.15724705882353[/C][C]-0.83224705882353[/C][/ROW]
[ROW][C]57[/C][C]0.339[/C][C]1.08744705882353[/C][C]-0.74844705882353[/C][/ROW]
[ROW][C]58[/C][C]0.329[/C][C]1.10324705882353[/C][C]-0.774247058823529[/C][/ROW]
[ROW][C]59[/C][C]0.48[/C][C]1.13924705882353[/C][C]-0.65924705882353[/C][/ROW]
[ROW][C]60[/C][C]0.399[/C][C]1.18404705882353[/C][C]-0.785047058823532[/C][/ROW]
[ROW][C]61[/C][C]0.37[/C][C]0.90772549019608[/C][C]-0.537725490196079[/C][/ROW]
[/TABLE]
Source: https://freestatistics.org/blog/index.php?pk=115744&T=4

Globally Unique Identifier (entire table): ba.freestatistics.org/blog/index.php?pk=115744&T=4

As an alternative you can also use a QR Code:  

The GUIDs for individual cells are displayed in the table below:

Multiple Linear Regression - Actuals, Interpolation, and Residuals
Time or IndexActualsInterpolationForecastResidualsPrediction Error
12.083.87960784313725-1.79960784313725
22.093.89695294117647-1.80695294117647
32.073.84375294117647-1.77375294117647
42.043.70915294117647-1.66915294117647
52.353.64755294117647-1.29755294117647
62.333.49775294117647-1.16775294117647
72.373.49735294117647-1.12735294117647
82.593.53475294117647-0.94475294117647
92.623.46495294117647-0.84495294117647
102.63.48075294117647-0.880752941176471
112.833.51675294117647-0.686752941176471
122.783.56155294117647-0.781552941176473
133.013.28523137254902-0.275231372549022
143.063.30257647058824-0.242576470588235
153.333.249376470588230.080623529411766
163.323.114776470588230.205223529411765
173.63.053176470588240.546823529411764
183.572.903376470588240.666623529411765
193.572.902976470588240.667023529411764
203.832.940376470588240.889623529411764
213.842.870576470588240.969423529411764
223.82.886376470588240.913623529411764
234.072.922376470588241.14762352941176
244.052.967176470588241.08282352941176
254.2722.690854901960781.58114509803922
263.8582.70821.1498
274.0672.6551.412
283.9642.52041.4436
293.7822.45881.3232
304.1142.3091.805
314.0092.30861.7004
324.0252.3461.679
334.0822.27621.8058
344.0442.2921.752
353.9162.3281.588
364.2892.37281.91620000000000
374.2962.096478431372552.19952156862745
384.1932.113823529411762.07917647058824
393.482.060623529411761.41937647058824
402.9341.926023529411761.00797647058824
412.2211.864423529411760.356576470588236
421.2111.71462352941176-0.503623529411764
431.281.71422352941176-0.434223529411764
440.961.75162352941177-0.791623529411765
450.51.68182352941176-1.18182352941176
460.6871.69762352941176-1.01062352941176
470.3441.73362352941176-1.38962352941176
480.3461.77842352941177-1.43242352941177
490.3341.50210196078431-1.16810196078431
500.341.51944705882353-1.17944705882353
510.3281.46624705882353-1.13824705882353
520.3441.33164705882353-0.987647058823528
530.3411.27004705882353-0.929047058823529
540.321.12024705882353-0.800247058823529
550.3141.11984705882353-0.80584705882353
560.3251.15724705882353-0.83224705882353
570.3391.08744705882353-0.74844705882353
580.3291.10324705882353-0.774247058823529
590.481.13924705882353-0.65924705882353
600.3991.18404705882353-0.785047058823532
610.370.90772549019608-0.537725490196079


Goldfeld-Quandt test for Heteroskedasticity
p-valuesAlternative Hypothesis
breakpoint indexgreater2-sidedless
160.004067427031680540.008134854063361090.99593257296832
170.0006810334414204670.001362066882840930.99931896655858
180.0001019634559029530.0002039269118059070.999898036544097
191.34893749211852e-052.69787498423704e-050.999986510625079
201.80372337198144e-063.60744674396288e-060.999998196276628
212.15393752279348e-074.30787504558695e-070.999999784606248
222.55613153994926e-085.11226307989852e-080.999999974438685
232.99712232682948e-095.99424465365895e-090.999999997002878
244.34921728333755e-108.6984345666751e-100.999999999565078
255.52344309651239e-111.10468861930248e-100.999999999944766
264.43818377017946e-098.87636754035892e-090.999999995561816
273.7694772406998e-097.5389544813996e-090.999999996230523
283.60926102177713e-097.21852204355426e-090.99999999639074
291.43929129983413e-072.87858259966825e-070.99999985607087
306.7606411873192e-081.35212823746384e-070.999999932393588
314.48853660572322e-088.97707321144643e-080.999999955114634
327.5108672807777e-081.50217345615554e-070.999999924891327
337.85290861301129e-081.57058172260226e-070.999999921470914
346.65591828729338e-081.33118365745868e-070.999999933440817
352.59067683543586e-075.18135367087172e-070.999999740932316
363.14176047373146e-076.28352094746292e-070.999999685823953
371.25017550757980e-062.50035101515959e-060.999998749824492
383.97279677059104e-057.94559354118208e-050.999960272032294
390.009635502842884650.01927100568576930.990364497157115
400.3698669774181640.7397339548363270.630133022581836
410.9464016987240540.1071966025518910.0535983012759456
420.9876961794622250.02460764107555090.0123038205377754
430.997490461025750.005019077948501910.00250953897425096
440.9990926512665290.001814697466942040.000907348733471018
450.9959435754414320.008112849117136940.00405642455856847

\begin{tabular}{lllllllll}
\hline
Goldfeld-Quandt test for Heteroskedasticity \tabularnewline
p-values & Alternative Hypothesis \tabularnewline
breakpoint index & greater & 2-sided & less \tabularnewline
16 & 0.00406742703168054 & 0.00813485406336109 & 0.99593257296832 \tabularnewline
17 & 0.000681033441420467 & 0.00136206688284093 & 0.99931896655858 \tabularnewline
18 & 0.000101963455902953 & 0.000203926911805907 & 0.999898036544097 \tabularnewline
19 & 1.34893749211852e-05 & 2.69787498423704e-05 & 0.999986510625079 \tabularnewline
20 & 1.80372337198144e-06 & 3.60744674396288e-06 & 0.999998196276628 \tabularnewline
21 & 2.15393752279348e-07 & 4.30787504558695e-07 & 0.999999784606248 \tabularnewline
22 & 2.55613153994926e-08 & 5.11226307989852e-08 & 0.999999974438685 \tabularnewline
23 & 2.99712232682948e-09 & 5.99424465365895e-09 & 0.999999997002878 \tabularnewline
24 & 4.34921728333755e-10 & 8.6984345666751e-10 & 0.999999999565078 \tabularnewline
25 & 5.52344309651239e-11 & 1.10468861930248e-10 & 0.999999999944766 \tabularnewline
26 & 4.43818377017946e-09 & 8.87636754035892e-09 & 0.999999995561816 \tabularnewline
27 & 3.7694772406998e-09 & 7.5389544813996e-09 & 0.999999996230523 \tabularnewline
28 & 3.60926102177713e-09 & 7.21852204355426e-09 & 0.99999999639074 \tabularnewline
29 & 1.43929129983413e-07 & 2.87858259966825e-07 & 0.99999985607087 \tabularnewline
30 & 6.7606411873192e-08 & 1.35212823746384e-07 & 0.999999932393588 \tabularnewline
31 & 4.48853660572322e-08 & 8.97707321144643e-08 & 0.999999955114634 \tabularnewline
32 & 7.5108672807777e-08 & 1.50217345615554e-07 & 0.999999924891327 \tabularnewline
33 & 7.85290861301129e-08 & 1.57058172260226e-07 & 0.999999921470914 \tabularnewline
34 & 6.65591828729338e-08 & 1.33118365745868e-07 & 0.999999933440817 \tabularnewline
35 & 2.59067683543586e-07 & 5.18135367087172e-07 & 0.999999740932316 \tabularnewline
36 & 3.14176047373146e-07 & 6.28352094746292e-07 & 0.999999685823953 \tabularnewline
37 & 1.25017550757980e-06 & 2.50035101515959e-06 & 0.999998749824492 \tabularnewline
38 & 3.97279677059104e-05 & 7.94559354118208e-05 & 0.999960272032294 \tabularnewline
39 & 0.00963550284288465 & 0.0192710056857693 & 0.990364497157115 \tabularnewline
40 & 0.369866977418164 & 0.739733954836327 & 0.630133022581836 \tabularnewline
41 & 0.946401698724054 & 0.107196602551891 & 0.0535983012759456 \tabularnewline
42 & 0.987696179462225 & 0.0246076410755509 & 0.0123038205377754 \tabularnewline
43 & 0.99749046102575 & 0.00501907794850191 & 0.00250953897425096 \tabularnewline
44 & 0.999092651266529 & 0.00181469746694204 & 0.000907348733471018 \tabularnewline
45 & 0.995943575441432 & 0.00811284911713694 & 0.00405642455856847 \tabularnewline
\hline
\end{tabular}
%Source: https://freestatistics.org/blog/index.php?pk=115744&T=5

[TABLE]
[ROW][C]Goldfeld-Quandt test for Heteroskedasticity[/C][/ROW]
[ROW][C]p-values[/C][C]Alternative Hypothesis[/C][/ROW]
[ROW][C]breakpoint index[/C][C]greater[/C][C]2-sided[/C][C]less[/C][/ROW]
[ROW][C]16[/C][C]0.00406742703168054[/C][C]0.00813485406336109[/C][C]0.99593257296832[/C][/ROW]
[ROW][C]17[/C][C]0.000681033441420467[/C][C]0.00136206688284093[/C][C]0.99931896655858[/C][/ROW]
[ROW][C]18[/C][C]0.000101963455902953[/C][C]0.000203926911805907[/C][C]0.999898036544097[/C][/ROW]
[ROW][C]19[/C][C]1.34893749211852e-05[/C][C]2.69787498423704e-05[/C][C]0.999986510625079[/C][/ROW]
[ROW][C]20[/C][C]1.80372337198144e-06[/C][C]3.60744674396288e-06[/C][C]0.999998196276628[/C][/ROW]
[ROW][C]21[/C][C]2.15393752279348e-07[/C][C]4.30787504558695e-07[/C][C]0.999999784606248[/C][/ROW]
[ROW][C]22[/C][C]2.55613153994926e-08[/C][C]5.11226307989852e-08[/C][C]0.999999974438685[/C][/ROW]
[ROW][C]23[/C][C]2.99712232682948e-09[/C][C]5.99424465365895e-09[/C][C]0.999999997002878[/C][/ROW]
[ROW][C]24[/C][C]4.34921728333755e-10[/C][C]8.6984345666751e-10[/C][C]0.999999999565078[/C][/ROW]
[ROW][C]25[/C][C]5.52344309651239e-11[/C][C]1.10468861930248e-10[/C][C]0.999999999944766[/C][/ROW]
[ROW][C]26[/C][C]4.43818377017946e-09[/C][C]8.87636754035892e-09[/C][C]0.999999995561816[/C][/ROW]
[ROW][C]27[/C][C]3.7694772406998e-09[/C][C]7.5389544813996e-09[/C][C]0.999999996230523[/C][/ROW]
[ROW][C]28[/C][C]3.60926102177713e-09[/C][C]7.21852204355426e-09[/C][C]0.99999999639074[/C][/ROW]
[ROW][C]29[/C][C]1.43929129983413e-07[/C][C]2.87858259966825e-07[/C][C]0.99999985607087[/C][/ROW]
[ROW][C]30[/C][C]6.7606411873192e-08[/C][C]1.35212823746384e-07[/C][C]0.999999932393588[/C][/ROW]
[ROW][C]31[/C][C]4.48853660572322e-08[/C][C]8.97707321144643e-08[/C][C]0.999999955114634[/C][/ROW]
[ROW][C]32[/C][C]7.5108672807777e-08[/C][C]1.50217345615554e-07[/C][C]0.999999924891327[/C][/ROW]
[ROW][C]33[/C][C]7.85290861301129e-08[/C][C]1.57058172260226e-07[/C][C]0.999999921470914[/C][/ROW]
[ROW][C]34[/C][C]6.65591828729338e-08[/C][C]1.33118365745868e-07[/C][C]0.999999933440817[/C][/ROW]
[ROW][C]35[/C][C]2.59067683543586e-07[/C][C]5.18135367087172e-07[/C][C]0.999999740932316[/C][/ROW]
[ROW][C]36[/C][C]3.14176047373146e-07[/C][C]6.28352094746292e-07[/C][C]0.999999685823953[/C][/ROW]
[ROW][C]37[/C][C]1.25017550757980e-06[/C][C]2.50035101515959e-06[/C][C]0.999998749824492[/C][/ROW]
[ROW][C]38[/C][C]3.97279677059104e-05[/C][C]7.94559354118208e-05[/C][C]0.999960272032294[/C][/ROW]
[ROW][C]39[/C][C]0.00963550284288465[/C][C]0.0192710056857693[/C][C]0.990364497157115[/C][/ROW]
[ROW][C]40[/C][C]0.369866977418164[/C][C]0.739733954836327[/C][C]0.630133022581836[/C][/ROW]
[ROW][C]41[/C][C]0.946401698724054[/C][C]0.107196602551891[/C][C]0.0535983012759456[/C][/ROW]
[ROW][C]42[/C][C]0.987696179462225[/C][C]0.0246076410755509[/C][C]0.0123038205377754[/C][/ROW]
[ROW][C]43[/C][C]0.99749046102575[/C][C]0.00501907794850191[/C][C]0.00250953897425096[/C][/ROW]
[ROW][C]44[/C][C]0.999092651266529[/C][C]0.00181469746694204[/C][C]0.000907348733471018[/C][/ROW]
[ROW][C]45[/C][C]0.995943575441432[/C][C]0.00811284911713694[/C][C]0.00405642455856847[/C][/ROW]
[/TABLE]
Source: https://freestatistics.org/blog/index.php?pk=115744&T=5

Globally Unique Identifier (entire table): ba.freestatistics.org/blog/index.php?pk=115744&T=5

As an alternative you can also use a QR Code:  

The GUIDs for individual cells are displayed in the table below:

Goldfeld-Quandt test for Heteroskedasticity
p-valuesAlternative Hypothesis
breakpoint indexgreater2-sidedless
160.004067427031680540.008134854063361090.99593257296832
170.0006810334414204670.001362066882840930.99931896655858
180.0001019634559029530.0002039269118059070.999898036544097
191.34893749211852e-052.69787498423704e-050.999986510625079
201.80372337198144e-063.60744674396288e-060.999998196276628
212.15393752279348e-074.30787504558695e-070.999999784606248
222.55613153994926e-085.11226307989852e-080.999999974438685
232.99712232682948e-095.99424465365895e-090.999999997002878
244.34921728333755e-108.6984345666751e-100.999999999565078
255.52344309651239e-111.10468861930248e-100.999999999944766
264.43818377017946e-098.87636754035892e-090.999999995561816
273.7694772406998e-097.5389544813996e-090.999999996230523
283.60926102177713e-097.21852204355426e-090.99999999639074
291.43929129983413e-072.87858259966825e-070.99999985607087
306.7606411873192e-081.35212823746384e-070.999999932393588
314.48853660572322e-088.97707321144643e-080.999999955114634
327.5108672807777e-081.50217345615554e-070.999999924891327
337.85290861301129e-081.57058172260226e-070.999999921470914
346.65591828729338e-081.33118365745868e-070.999999933440817
352.59067683543586e-075.18135367087172e-070.999999740932316
363.14176047373146e-076.28352094746292e-070.999999685823953
371.25017550757980e-062.50035101515959e-060.999998749824492
383.97279677059104e-057.94559354118208e-050.999960272032294
390.009635502842884650.01927100568576930.990364497157115
400.3698669774181640.7397339548363270.630133022581836
410.9464016987240540.1071966025518910.0535983012759456
420.9876961794622250.02460764107555090.0123038205377754
430.997490461025750.005019077948501910.00250953897425096
440.9990926512665290.001814697466942040.000907348733471018
450.9959435754414320.008112849117136940.00405642455856847


Meta Analysis of Goldfeld-Quandt test for Heteroskedasticity
Description# significant tests% significant testsOK/NOK
1% type I error level260.866666666666667NOK
5% type I error level280.933333333333333NOK
10% type I error level280.933333333333333NOK

\begin{tabular}{lllllllll}
\hline
Meta Analysis of Goldfeld-Quandt test for Heteroskedasticity \tabularnewline
Description & # significant tests & % significant tests & OK/NOK \tabularnewline
1% type I error level & 26 & 0.866666666666667 & NOK \tabularnewline
5% type I error level & 28 & 0.933333333333333 & NOK \tabularnewline
10% type I error level & 28 & 0.933333333333333 & NOK \tabularnewline
\hline
\end{tabular}
%Source: https://freestatistics.org/blog/index.php?pk=115744&T=6

[TABLE]
[ROW][C]Meta Analysis of Goldfeld-Quandt test for Heteroskedasticity[/C][/ROW]
[ROW][C]Description[/C][C]# significant tests[/C][C]% significant tests[/C][C]OK/NOK[/C][/ROW]
[ROW][C]1% type I error level[/C][C]26[/C][C]0.866666666666667[/C][C]NOK[/C][/ROW]
[ROW][C]5% type I error level[/C][C]28[/C][C]0.933333333333333[/C][C]NOK[/C][/ROW]
[ROW][C]10% type I error level[/C][C]28[/C][C]0.933333333333333[/C][C]NOK[/C][/ROW]
[/TABLE]
Source: https://freestatistics.org/blog/index.php?pk=115744&T=6

Globally Unique Identifier (entire table): ba.freestatistics.org/blog/index.php?pk=115744&T=6

As an alternative you can also use a QR Code:  

The GUIDs for individual cells are displayed in the table below:

Meta Analysis of Goldfeld-Quandt test for Heteroskedasticity
Description# significant tests% significant testsOK/NOK
1% type I error level260.866666666666667NOK
5% type I error level280.933333333333333NOK
10% type I error level280.933333333333333NOK


Parameters (Session):
par1 = 12 ; par2 = 0.3 ; par3 = 1 ; par4 = 0 ; par5 = 12 ; par6 = 0 ; par7 = 0 ; par8 = 1 ; par9 = 0 ; par10 = FALSE ;
Parameters (R input):
par1 = 1 ; par2 = Include Monthly Dummies ; par3 = Linear Trend ;
R code (references can be found in the software module):
library(lattice)
library(lmtest)
n25 <- 25 #minimum number of obs. for Goldfeld-Quandt test
par1 <- as.numeric(par1)
x <- t(y)
k <- length(x[1,])
n <- length(x[,1])
x1 <- cbind(x[,par1], x[,1:k!=par1])
mycolnames <- c(colnames(x)[par1], colnames(x)[1:k!=par1])
colnames(x1) <- mycolnames #colnames(x)[par1]
x <- x1
if (par3 == 'First Differences'){
x2 <- array(0, dim=c(n-1,k), dimnames=list(1:(n-1), paste('(1-B)',colnames(x),sep='')))
for (i in 1:n-1) {
for (j in 1:k) {
x2[i,j] <- x[i+1,j] - x[i,j]
}
}
x <- x2
}
if (par2 == 'Include Monthly Dummies'){
x2 <- array(0, dim=c(n,11), dimnames=list(1:n, paste('M', seq(1:11), sep ='')))
for (i in 1:11){
x2[seq(i,n,12),i] <- 1
}
x <- cbind(x, x2)
}
if (par2 == 'Include Quarterly Dummies'){
x2 <- array(0, dim=c(n,3), dimnames=list(1:n, paste('Q', seq(1:3), sep ='')))
for (i in 1:3){
x2[seq(i,n,4),i] <- 1
}
x <- cbind(x, x2)
}
k <- length(x[1,])
if (par3 == 'Linear Trend'){
x <- cbind(x, c(1:n))
colnames(x)[k+1] <- 't'
}
x
k <- length(x[1,])
df <- as.data.frame(x)
(mylm <- lm(df))
(mysum <- summary(mylm))
if (n > n25) {
kp3 <- k + 3
nmkm3 <- n - k - 3
gqarr <- array(NA, dim=c(nmkm3-kp3+1,3))
numgqtests <- 0
numsignificant1 <- 0
numsignificant5 <- 0
numsignificant10 <- 0
for (mypoint in kp3:nmkm3) {
j <- 0
numgqtests <- numgqtests + 1
for (myalt in c('greater', 'two.sided', 'less')) {
j <- j + 1
gqarr[mypoint-kp3+1,j] <- gqtest(mylm, point=mypoint, alternative=myalt)$p.value
}
if (gqarr[mypoint-kp3+1,2] < 0.01) numsignificant1 <- numsignificant1 + 1
if (gqarr[mypoint-kp3+1,2] < 0.05) numsignificant5 <- numsignificant5 + 1
if (gqarr[mypoint-kp3+1,2] < 0.10) numsignificant10 <- numsignificant10 + 1
}
gqarr
}
bitmap(file='test0.png')
plot(x[,1], type='l', main='Actuals and Interpolation', ylab='value of Actuals and Interpolation (dots)', xlab='time or index')
points(x[,1]-mysum$resid)
grid()
dev.off()
bitmap(file='test1.png')
plot(mysum$resid, type='b', pch=19, main='Residuals', ylab='value of Residuals', xlab='time or index')
grid()
dev.off()
bitmap(file='test2.png')
hist(mysum$resid, main='Residual Histogram', xlab='values of Residuals')
grid()
dev.off()
bitmap(file='test3.png')
densityplot(~mysum$resid,col='black',main='Residual Density Plot', xlab='values of Residuals')
dev.off()
bitmap(file='test4.png')
qqnorm(mysum$resid, main='Residual Normal Q-Q Plot')
qqline(mysum$resid)
grid()
dev.off()
(myerror <- as.ts(mysum$resid))
bitmap(file='test5.png')
dum <- cbind(lag(myerror,k=1),myerror)
dum
dum1 <- dum[2:length(myerror),]
dum1
z <- as.data.frame(dum1)
z
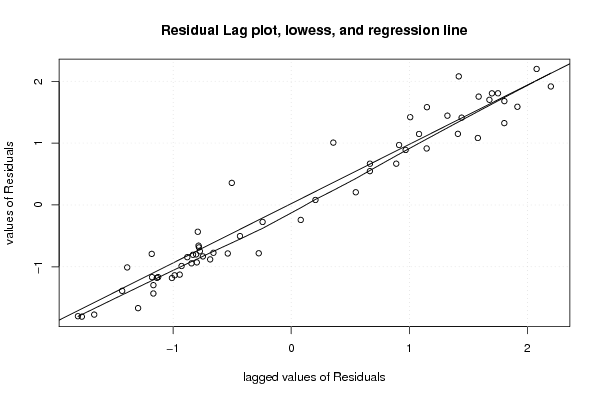
plot(z,main=paste('Residual Lag plot, lowess, and regression line'), ylab='values of Residuals', xlab='lagged values of Residuals')
lines(lowess(z))
abline(lm(z))
grid()
dev.off()
bitmap(file='test6.png')
acf(mysum$resid, lag.max=length(mysum$resid)/2, main='Residual Autocorrelation Function')
grid()
dev.off()
bitmap(file='test7.png')
pacf(mysum$resid, lag.max=length(mysum$resid)/2, main='Residual Partial Autocorrelation Function')
grid()
dev.off()
bitmap(file='test8.png')
opar <- par(mfrow = c(2,2), oma = c(0, 0, 1.1, 0))
plot(mylm, las = 1, sub='Residual Diagnostics')
par(opar)
dev.off()
if (n > n25) {
bitmap(file='test9.png')
plot(kp3:nmkm3,gqarr[,2], main='Goldfeld-Quandt test',ylab='2-sided p-value',xlab='breakpoint')
grid()
dev.off()
}
load(file='createtable')
a<-table.start()
a<-table.row.start(a)
a<-table.element(a, 'Multiple Linear Regression - Estimated Regression Equation', 1, TRUE)
a<-table.row.end(a)
myeq <- colnames(x)[1]
myeq <- paste(myeq, '[t] = ', sep='')
for (i in 1:k){
if (mysum$coefficients[i,1] > 0) myeq <- paste(myeq, '+', '')
myeq <- paste(myeq, mysum$coefficients[i,1], sep=' ')
if (rownames(mysum$coefficients)[i] != '(Intercept)') {
myeq <- paste(myeq, rownames(mysum$coefficients)[i], sep='')
if (rownames(mysum$coefficients)[i] != 't') myeq <- paste(myeq, '[t]', sep='')
}
}
myeq <- paste(myeq, ' + e[t]')
a<-table.row.start(a)
a<-table.element(a, myeq)
a<-table.row.end(a)
a<-table.end(a)
table.save(a,file='mytable1.tab')
a<-table.start()
a<-table.row.start(a)
a<-table.element(a,hyperlink('ols1.htm','Multiple Linear Regression - Ordinary Least Squares',''), 6, TRUE)
a<-table.row.end(a)
a<-table.row.start(a)
a<-table.element(a,'Variable',header=TRUE)
a<-table.element(a,'Parameter',header=TRUE)
a<-table.element(a,'S.D.',header=TRUE)
a<-table.element(a,'T-STAT
H0: parameter = 0',header=TRUE)
a<-table.element(a,'2-tail p-value',header=TRUE)
a<-table.element(a,'1-tail p-value',header=TRUE)
a<-table.row.end(a)
for (i in 1:k){
a<-table.row.start(a)
a<-table.element(a,rownames(mysum$coefficients)[i],header=TRUE)
a<-table.element(a,mysum$coefficients[i,1])
a<-table.element(a, round(mysum$coefficients[i,2],6))
a<-table.element(a, round(mysum$coefficients[i,3],4))
a<-table.element(a, round(mysum$coefficients[i,4],6))
a<-table.element(a, round(mysum$coefficients[i,4]/2,6))
a<-table.row.end(a)
}
a<-table.end(a)
table.save(a,file='mytable2.tab')
a<-table.start()
a<-table.row.start(a)
a<-table.element(a, 'Multiple Linear Regression - Regression Statistics', 2, TRUE)
a<-table.row.end(a)
a<-table.row.start(a)
a<-table.element(a, 'Multiple R',1,TRUE)
a<-table.element(a, sqrt(mysum$r.squared))
a<-table.row.end(a)
a<-table.row.start(a)
a<-table.element(a, 'R-squared',1,TRUE)
a<-table.element(a, mysum$r.squared)
a<-table.row.end(a)
a<-table.row.start(a)
a<-table.element(a, 'Adjusted R-squared',1,TRUE)
a<-table.element(a, mysum$adj.r.squared)
a<-table.row.end(a)
a<-table.row.start(a)
a<-table.element(a, 'F-TEST (value)',1,TRUE)
a<-table.element(a, mysum$fstatistic[1])
a<-table.row.end(a)
a<-table.row.start(a)
a<-table.element(a, 'F-TEST (DF numerator)',1,TRUE)
a<-table.element(a, mysum$fstatistic[2])
a<-table.row.end(a)
a<-table.row.start(a)
a<-table.element(a, 'F-TEST (DF denominator)',1,TRUE)
a<-table.element(a, mysum$fstatistic[3])
a<-table.row.end(a)
a<-table.row.start(a)
a<-table.element(a, 'p-value',1,TRUE)
a<-table.element(a, 1-pf(mysum$fstatistic[1],mysum$fstatistic[2],mysum$fstatistic[3]))
a<-table.row.end(a)
a<-table.row.start(a)
a<-table.element(a, 'Multiple Linear Regression - Residual Statistics', 2, TRUE)
a<-table.row.end(a)
a<-table.row.start(a)
a<-table.element(a, 'Residual Standard Deviation',1,TRUE)
a<-table.element(a, mysum$sigma)
a<-table.row.end(a)
a<-table.row.start(a)
a<-table.element(a, 'Sum Squared Residuals',1,TRUE)
a<-table.element(a, sum(myerror*myerror))
a<-table.row.end(a)
a<-table.end(a)
table.save(a,file='mytable3.tab')
a<-table.start()
a<-table.row.start(a)
a<-table.element(a, 'Multiple Linear Regression - Actuals, Interpolation, and Residuals', 4, TRUE)
a<-table.row.end(a)
a<-table.row.start(a)
a<-table.element(a, 'Time or Index', 1, TRUE)
a<-table.element(a, 'Actuals', 1, TRUE)
a<-table.element(a, 'Interpolation
Forecast', 1, TRUE)
a<-table.element(a, 'Residuals
Prediction Error', 1, TRUE)
a<-table.row.end(a)
for (i in 1:n) {
a<-table.row.start(a)
a<-table.element(a,i, 1, TRUE)
a<-table.element(a,x[i])
a<-table.element(a,x[i]-mysum$resid[i])
a<-table.element(a,mysum$resid[i])
a<-table.row.end(a)
}
a<-table.end(a)
table.save(a,file='mytable4.tab')
if (n > n25) {
a<-table.start()
a<-table.row.start(a)
a<-table.element(a,'Goldfeld-Quandt test for Heteroskedasticity',4,TRUE)
a<-table.row.end(a)
a<-table.row.start(a)
a<-table.element(a,'p-values',header=TRUE)
a<-table.element(a,'Alternative Hypothesis',3,header=TRUE)
a<-table.row.end(a)
a<-table.row.start(a)
a<-table.element(a,'breakpoint index',header=TRUE)
a<-table.element(a,'greater',header=TRUE)
a<-table.element(a,'2-sided',header=TRUE)
a<-table.element(a,'less',header=TRUE)
a<-table.row.end(a)
for (mypoint in kp3:nmkm3) {
a<-table.row.start(a)
a<-table.element(a,mypoint,header=TRUE)
a<-table.element(a,gqarr[mypoint-kp3+1,1])
a<-table.element(a,gqarr[mypoint-kp3+1,2])
a<-table.element(a,gqarr[mypoint-kp3+1,3])
a<-table.row.end(a)
}
a<-table.end(a)
table.save(a,file='mytable5.tab')
a<-table.start()
a<-table.row.start(a)
a<-table.element(a,'Meta Analysis of Goldfeld-Quandt test for Heteroskedasticity',4,TRUE)
a<-table.row.end(a)
a<-table.row.start(a)
a<-table.element(a,'Description',header=TRUE)
a<-table.element(a,'# significant tests',header=TRUE)
a<-table.element(a,'% significant tests',header=TRUE)
a<-table.element(a,'OK/NOK',header=TRUE)
a<-table.row.end(a)
a<-table.row.start(a)
a<-table.element(a,'1% type I error level',header=TRUE)
a<-table.element(a,numsignificant1)
a<-table.element(a,numsignificant1/numgqtests)
if (numsignificant1/numgqtests < 0.01) dum <- 'OK' else dum <- 'NOK'
a<-table.element(a,dum)
a<-table.row.end(a)
a<-table.row.start(a)
a<-table.element(a,'5% type I error level',header=TRUE)
a<-table.element(a,numsignificant5)
a<-table.element(a,numsignificant5/numgqtests)
if (numsignificant5/numgqtests < 0.05) dum <- 'OK' else dum <- 'NOK'
a<-table.element(a,dum)
a<-table.row.end(a)
a<-table.row.start(a)
a<-table.element(a,'10% type I error level',header=TRUE)
a<-table.element(a,numsignificant10)
a<-table.element(a,numsignificant10/numgqtests)
if (numsignificant10/numgqtests < 0.1) dum <- 'OK' else dum <- 'NOK'
a<-table.element(a,dum)
a<-table.row.end(a)
a<-table.end(a)
table.save(a,file='mytable6.tab')
}