Free Statistics

of Irreproducible Research!

Author's title

Author*The author of this computation has been verified*
R Software Modulerwasp_multipleregression.wasp
Title produced by softwareMultiple Regression
Date of computationSun, 26 Dec 2010 17:24:50 +0000
Cite this page as followsStatistical Computations at FreeStatistics.org, Office for Research Development and Education, URL https://freestatistics.org/blog/index.php?v=date/2010/Dec/26/t1293384610u38s79ejity3qtc.htm/, Retrieved Fri, 03 May 2024 09:51:09 +0000
Statistical Computations at FreeStatistics.org, Office for Research Development and Education, URL https://freestatistics.org/blog/index.php?pk=115741, Retrieved Fri, 03 May 2024 09:51:09 +0000
QR Codes:

Original text written by user:
IsPrivate?No (this computation is public)
User-defined keywords
Estimated Impact178
Family? (F = Feedback message, R = changed R code, M = changed R Module, P = changed Parameters, D = changed Data)
-     [Multiple Regression] [HPC Retail Sales] [2008-03-08 13:40:54] [1c0f2c85e8a48e42648374b3bcceca26]
- RMPD  [Multiple Regression] [] [2010-11-26 11:40:42] [d39e5c40c631ed6c22677d2e41dbfc7d]
-    D    [Multiple Regression] [] [2010-12-15 20:39:35] [d39e5c40c631ed6c22677d2e41dbfc7d]
-   PD        [Multiple Regression] [paper multiple alles] [2010-12-26 17:24:50] [6df2229e3f2091de42c4a9cf9a617420] [Current]
Feedback Forum

Post a new message
Dataseries X:
61,2	2,08	83,9	10554,27
62	2,09	85,6	10532,54
65,1	2,07	87,5	10324,31
63,2	2,04	88,5	10695,25
66,3	2,35	91	10827,81
61,9	2,33	90,6	10872,48
62,1	2,37	91,2	10971,19
66,3	2,59	93,2	11145,65
72	2,62	90,1	11234,68
65,3	2,6	95	11333,88
67,6	2,83	95,4	10997,97
70,5	2,78	93,7	11036,89
74,2	3,01	93,9	11257,35
77,8	3,06	92,5	11533,59
78,5	3,33	89,2	11963,12
77,8	3,32	93,3	12185,15
81,4	3,6	93	12377,62
84,5	3,57	96,1	12512,89
88	3,57	96,7	12631,48
93,9	3,83	97,6	12268,53
98,9	3,84	102,6	12754,8
96,7	3,8	107,6	13407,75
98,9	4,07	103,5	13480,21
102,2	4,05	100,8	13673,28
105,4	4,272	94,5	13239,71
105,1	3,858	100,1	13557,69
116,6	4,067	97,4	13901,28
112	3,964	103	13200,58
108,8	3,782	100,2	13406,97
106,9	4,114	100,2	12538,12
109,5	4,009	99	12419,57
106,7	4,025	102,4	12193,88
118,9	4,082	99	12656,63
117,5	4,044	103,7	12812,48
113,7	3,916	103,4	12056,67
119,6	4,289	95,3	11322,38
120,6	4,296	93,6	11530,75
117,5	4,193	102,4	11114,08
120,3	3,48	110,5	9181,73
119,8	2,934	109,1	8614,55
108	2,221	100,9	8595,56
98,8	1,211	108,1	8396,2
94,6	1,28	105	7690,5
84,6	0,96	111,5	7235,47
84,4	0,5	109,5	7992,12
79,1	0,687	110,5	8398,37
73,3	0,344	114	8593
74,3	0,346	108,2	8679,75
67,8	0,334	110,3	9374,63
64,8	0,34	111,8	9634,97
66,5	0,328	107,5	9857,34
57,7	0,344	114,1	10238,83
53,8	0,341	113,8	10433,44
51,8	0,32	114,5	10471,24
50,9	0,314	114,8	10214,51
49	0,325	117,8	10677,52
48,1	0,339	116,7	11052,15
42,6	0,329	122,8	10500,19
40,9	0,48	122,3	10159,27
43,3	0,399	115	10222,24
43,7	0,37	118,5	10350,4


Summary of computational transaction
Raw Inputview raw input (R code)
Raw Outputview raw output of R engine
Computing time6 seconds
R Server'George Udny Yule' @ 72.249.76.132

\begin{tabular}{lllllllll}
\hline
Summary of computational transaction \tabularnewline
Raw Input & view raw input (R code)  \tabularnewline
Raw Output & view raw output of R engine  \tabularnewline
Computing time & 6 seconds \tabularnewline
R Server & 'George Udny Yule' @ 72.249.76.132 \tabularnewline
\hline
\end{tabular}
%Source: https://freestatistics.org/blog/index.php?pk=115741&T=0

[TABLE]
[ROW][C]Summary of computational transaction[/C][/ROW]
[ROW][C]Raw Input[/C][C]view raw input (R code) [/C][/ROW]
[ROW][C]Raw Output[/C][C]view raw output of R engine [/C][/ROW]
[ROW][C]Computing time[/C][C]6 seconds[/C][/ROW]
[ROW][C]R Server[/C][C]'George Udny Yule' @ 72.249.76.132[/C][/ROW]
[/TABLE]
Source: https://freestatistics.org/blog/index.php?pk=115741&T=0

Globally Unique Identifier (entire table): ba.freestatistics.org/blog/index.php?pk=115741&T=0

As an alternative you can also use a QR Code:  

The GUIDs for individual cells are displayed in the table below:

Summary of computational transaction
Raw Inputview raw input (R code)
Raw Outputview raw output of R engine
Computing time6 seconds
R Server'George Udny Yule' @ 72.249.76.132


Multiple Linear Regression - Estimated Regression Equation
2JAAR[t] = + 111.020989459042 + 23.3612140925946Eonia[t] -0.272891438563962deposits[t] -0.00776632084898145DowJones[t] -0.0946750391652894M1[t] + 4.74945252117933M2[t] + 7.35576735626189M3[t] + 6.81072177491929M4[t] + 5.60982904331188M5[t] + 4.6853631855139M6[t] + 2.63886426724786M7[t] + 0.275054900138095M8[t] + 8.58264908164894M9[t] + 5.56042748620996M10[t] + 0.692937437920097M11[t] + 0.801501000137598t + e[t]

\begin{tabular}{lllllllll}
\hline
Multiple Linear Regression - Estimated Regression Equation \tabularnewline
2JAAR[t] =  +  111.020989459042 +  23.3612140925946Eonia[t] -0.272891438563962deposits[t] -0.00776632084898145DowJones[t] -0.0946750391652894M1[t] +  4.74945252117933M2[t] +  7.35576735626189M3[t] +  6.81072177491929M4[t] +  5.60982904331188M5[t] +  4.6853631855139M6[t] +  2.63886426724786M7[t] +  0.275054900138095M8[t] +  8.58264908164894M9[t] +  5.56042748620996M10[t] +  0.692937437920097M11[t] +  0.801501000137598t  + e[t] \tabularnewline
\hline
\end{tabular}
%Source: https://freestatistics.org/blog/index.php?pk=115741&T=1

[TABLE]
[ROW][C]Multiple Linear Regression - Estimated Regression Equation[/C][/ROW]
[ROW][C]2JAAR[t] =  +  111.020989459042 +  23.3612140925946Eonia[t] -0.272891438563962deposits[t] -0.00776632084898145DowJones[t] -0.0946750391652894M1[t] +  4.74945252117933M2[t] +  7.35576735626189M3[t] +  6.81072177491929M4[t] +  5.60982904331188M5[t] +  4.6853631855139M6[t] +  2.63886426724786M7[t] +  0.275054900138095M8[t] +  8.58264908164894M9[t] +  5.56042748620996M10[t] +  0.692937437920097M11[t] +  0.801501000137598t  + e[t][/C][/ROW]
[/TABLE]
Source: https://freestatistics.org/blog/index.php?pk=115741&T=1

Globally Unique Identifier (entire table): ba.freestatistics.org/blog/index.php?pk=115741&T=1

As an alternative you can also use a QR Code:  

The GUIDs for individual cells are displayed in the table below:

Multiple Linear Regression - Estimated Regression Equation
2JAAR[t] = + 111.020989459042 + 23.3612140925946Eonia[t] -0.272891438563962deposits[t] -0.00776632084898145DowJones[t] -0.0946750391652894M1[t] + 4.74945252117933M2[t] + 7.35576735626189M3[t] + 6.81072177491929M4[t] + 5.60982904331188M5[t] + 4.6853631855139M6[t] + 2.63886426724786M7[t] + 0.275054900138095M8[t] + 8.58264908164894M9[t] + 5.56042748620996M10[t] + 0.692937437920097M11[t] + 0.801501000137598t + e[t]


Multiple Linear Regression - Ordinary Least Squares
VariableParameterS.D.T-STATH0: parameter = 02-tail p-value1-tail p-value
(Intercept)111.02098945904238.5259632.88170.0060410.003021
Eonia23.36121409259461.45657416.038500
deposits-0.2728914385639620.451644-0.60420.5487330.274366
DowJones-0.007766320848981450.001141-6.804400
M1-0.09467503916528945.605833-0.01690.98660.4933
M24.749452521179335.8647480.80980.4222990.21115
M37.355767356261895.8520081.2570.2152520.107626
M46.810721774919295.9907791.13690.2616120.130806
M55.609829043311885.8421390.96020.3420680.171034
M64.68536318551395.909620.79280.4320330.216017
M72.638864267247865.8551470.45070.6543760.327188
M80.2750549001380956.0935980.04510.9641970.482098
M98.582649081648945.9073761.45290.1531980.076599
M105.560427486209966.4184550.86630.3909110.195456
M110.6929374379200976.3200020.10960.9131810.45659
t0.8015010001375980.2260363.54590.0009270.000464

\begin{tabular}{lllllllll}
\hline
Multiple Linear Regression - Ordinary Least Squares \tabularnewline
Variable & Parameter & S.D. & T-STATH0: parameter = 0 & 2-tail p-value & 1-tail p-value \tabularnewline
(Intercept) & 111.020989459042 & 38.525963 & 2.8817 & 0.006041 & 0.003021 \tabularnewline
Eonia & 23.3612140925946 & 1.456574 & 16.0385 & 0 & 0 \tabularnewline
deposits & -0.272891438563962 & 0.451644 & -0.6042 & 0.548733 & 0.274366 \tabularnewline
DowJones & -0.00776632084898145 & 0.001141 & -6.8044 & 0 & 0 \tabularnewline
M1 & -0.0946750391652894 & 5.605833 & -0.0169 & 0.9866 & 0.4933 \tabularnewline
M2 & 4.74945252117933 & 5.864748 & 0.8098 & 0.422299 & 0.21115 \tabularnewline
M3 & 7.35576735626189 & 5.852008 & 1.257 & 0.215252 & 0.107626 \tabularnewline
M4 & 6.81072177491929 & 5.990779 & 1.1369 & 0.261612 & 0.130806 \tabularnewline
M5 & 5.60982904331188 & 5.842139 & 0.9602 & 0.342068 & 0.171034 \tabularnewline
M6 & 4.6853631855139 & 5.90962 & 0.7928 & 0.432033 & 0.216017 \tabularnewline
M7 & 2.63886426724786 & 5.855147 & 0.4507 & 0.654376 & 0.327188 \tabularnewline
M8 & 0.275054900138095 & 6.093598 & 0.0451 & 0.964197 & 0.482098 \tabularnewline
M9 & 8.58264908164894 & 5.907376 & 1.4529 & 0.153198 & 0.076599 \tabularnewline
M10 & 5.56042748620996 & 6.418455 & 0.8663 & 0.390911 & 0.195456 \tabularnewline
M11 & 0.692937437920097 & 6.320002 & 0.1096 & 0.913181 & 0.45659 \tabularnewline
t & 0.801501000137598 & 0.226036 & 3.5459 & 0.000927 & 0.000464 \tabularnewline
\hline
\end{tabular}
%Source: https://freestatistics.org/blog/index.php?pk=115741&T=2

[TABLE]
[ROW][C]Multiple Linear Regression - Ordinary Least Squares[/C][/ROW]
[ROW][C]Variable[/C][C]Parameter[/C][C]S.D.[/C][C]T-STATH0: parameter = 0[/C][C]2-tail p-value[/C][C]1-tail p-value[/C][/ROW]
[ROW][C](Intercept)[/C][C]111.020989459042[/C][C]38.525963[/C][C]2.8817[/C][C]0.006041[/C][C]0.003021[/C][/ROW]
[ROW][C]Eonia[/C][C]23.3612140925946[/C][C]1.456574[/C][C]16.0385[/C][C]0[/C][C]0[/C][/ROW]
[ROW][C]deposits[/C][C]-0.272891438563962[/C][C]0.451644[/C][C]-0.6042[/C][C]0.548733[/C][C]0.274366[/C][/ROW]
[ROW][C]DowJones[/C][C]-0.00776632084898145[/C][C]0.001141[/C][C]-6.8044[/C][C]0[/C][C]0[/C][/ROW]
[ROW][C]M1[/C][C]-0.0946750391652894[/C][C]5.605833[/C][C]-0.0169[/C][C]0.9866[/C][C]0.4933[/C][/ROW]
[ROW][C]M2[/C][C]4.74945252117933[/C][C]5.864748[/C][C]0.8098[/C][C]0.422299[/C][C]0.21115[/C][/ROW]
[ROW][C]M3[/C][C]7.35576735626189[/C][C]5.852008[/C][C]1.257[/C][C]0.215252[/C][C]0.107626[/C][/ROW]
[ROW][C]M4[/C][C]6.81072177491929[/C][C]5.990779[/C][C]1.1369[/C][C]0.261612[/C][C]0.130806[/C][/ROW]
[ROW][C]M5[/C][C]5.60982904331188[/C][C]5.842139[/C][C]0.9602[/C][C]0.342068[/C][C]0.171034[/C][/ROW]
[ROW][C]M6[/C][C]4.6853631855139[/C][C]5.90962[/C][C]0.7928[/C][C]0.432033[/C][C]0.216017[/C][/ROW]
[ROW][C]M7[/C][C]2.63886426724786[/C][C]5.855147[/C][C]0.4507[/C][C]0.654376[/C][C]0.327188[/C][/ROW]
[ROW][C]M8[/C][C]0.275054900138095[/C][C]6.093598[/C][C]0.0451[/C][C]0.964197[/C][C]0.482098[/C][/ROW]
[ROW][C]M9[/C][C]8.58264908164894[/C][C]5.907376[/C][C]1.4529[/C][C]0.153198[/C][C]0.076599[/C][/ROW]
[ROW][C]M10[/C][C]5.56042748620996[/C][C]6.418455[/C][C]0.8663[/C][C]0.390911[/C][C]0.195456[/C][/ROW]
[ROW][C]M11[/C][C]0.692937437920097[/C][C]6.320002[/C][C]0.1096[/C][C]0.913181[/C][C]0.45659[/C][/ROW]
[ROW][C]t[/C][C]0.801501000137598[/C][C]0.226036[/C][C]3.5459[/C][C]0.000927[/C][C]0.000464[/C][/ROW]
[/TABLE]
Source: https://freestatistics.org/blog/index.php?pk=115741&T=2

Globally Unique Identifier (entire table): ba.freestatistics.org/blog/index.php?pk=115741&T=2

As an alternative you can also use a QR Code:  

The GUIDs for individual cells are displayed in the table below:

Multiple Linear Regression - Ordinary Least Squares
VariableParameterS.D.T-STATH0: parameter = 02-tail p-value1-tail p-value
(Intercept)111.02098945904238.5259632.88170.0060410.003021
Eonia23.36121409259461.45657416.038500
deposits-0.2728914385639620.451644-0.60420.5487330.274366
DowJones-0.007766320848981450.001141-6.804400
M1-0.09467503916528945.605833-0.01690.98660.4933
M24.749452521179335.8647480.80980.4222990.21115
M37.355767356261895.8520081.2570.2152520.107626
M46.810721774919295.9907791.13690.2616120.130806
M55.609829043311885.8421390.96020.3420680.171034
M64.68536318551395.909620.79280.4320330.216017
M72.638864267247865.8551470.45070.6543760.327188
M80.2750549001380956.0935980.04510.9641970.482098
M98.582649081648945.9073761.45290.1531980.076599
M105.560427486209966.4184550.86630.3909110.195456
M110.6929374379200976.3200020.10960.9131810.45659
t0.8015010001375980.2260363.54590.0009270.000464


Multiple Linear Regression - Regression Statistics
Multiple R0.944529868531104
R-squared0.892136672547384
Adjusted R-squared0.856182230063178
F-TEST (value)24.8129747232013
F-TEST (DF numerator)15
F-TEST (DF denominator)45
p-value0
Multiple Linear Regression - Residual Statistics
Residual Standard Deviation9.19128985490603
Sum Squared Residuals3801.59141386043

\begin{tabular}{lllllllll}
\hline
Multiple Linear Regression - Regression Statistics \tabularnewline
Multiple R & 0.944529868531104 \tabularnewline
R-squared & 0.892136672547384 \tabularnewline
Adjusted R-squared & 0.856182230063178 \tabularnewline
F-TEST (value) & 24.8129747232013 \tabularnewline
F-TEST (DF numerator) & 15 \tabularnewline
F-TEST (DF denominator) & 45 \tabularnewline
p-value & 0 \tabularnewline
Multiple Linear Regression - Residual Statistics \tabularnewline
Residual Standard Deviation & 9.19128985490603 \tabularnewline
Sum Squared Residuals & 3801.59141386043 \tabularnewline
\hline
\end{tabular}
%Source: https://freestatistics.org/blog/index.php?pk=115741&T=3

[TABLE]
[ROW][C]Multiple Linear Regression - Regression Statistics[/C][/ROW]
[ROW][C]Multiple R[/C][C]0.944529868531104[/C][/ROW]
[ROW][C]R-squared[/C][C]0.892136672547384[/C][/ROW]
[ROW][C]Adjusted R-squared[/C][C]0.856182230063178[/C][/ROW]
[ROW][C]F-TEST (value)[/C][C]24.8129747232013[/C][/ROW]
[ROW][C]F-TEST (DF numerator)[/C][C]15[/C][/ROW]
[ROW][C]F-TEST (DF denominator)[/C][C]45[/C][/ROW]
[ROW][C]p-value[/C][C]0[/C][/ROW]
[ROW][C]Multiple Linear Regression - Residual Statistics[/C][/ROW]
[ROW][C]Residual Standard Deviation[/C][C]9.19128985490603[/C][/ROW]
[ROW][C]Sum Squared Residuals[/C][C]3801.59141386043[/C][/ROW]
[/TABLE]
Source: https://freestatistics.org/blog/index.php?pk=115741&T=3

Globally Unique Identifier (entire table): ba.freestatistics.org/blog/index.php?pk=115741&T=3

As an alternative you can also use a QR Code:  

The GUIDs for individual cells are displayed in the table below:

Multiple Linear Regression - Regression Statistics
Multiple R0.944529868531104
R-squared0.892136672547384
Adjusted R-squared0.856182230063178
F-TEST (value)24.8129747232013
F-TEST (DF numerator)15
F-TEST (DF denominator)45
p-value0
Multiple Linear Regression - Residual Statistics
Residual Standard Deviation9.19128985490603
Sum Squared Residuals3801.59141386043


Multiple Linear Regression - Actuals, Interpolation, and Residuals
Time or IndexActualsInterpolationForecastResidualsPrediction Error
161.255.45570189031475.74429810968529
26261.03978929821260.96021070178737
365.165.07906810869280.0209318913072214
463.261.48095661042481.71904338957517
566.366.6118091595084-0.31180915950841
661.965.7838550430977-3.88385504309774
762.164.5429572945317-2.44295729453171
866.366.21942081548910.0805791845108795
97276.1838803342789-4.18388033427887
1065.371.3883483799432-6.08834837994323
1167.675.1950668340435-7.59506683404349
1270.574.2972199297476-3.79721992974763
1374.278.6103837499374-4.41038374993744
1477.883.6607525577163-5.86075255771633
1578.590.940770150935-12.4407701509351
1677.888.1204023125925-10.3204023125925
1781.492.849234184815-11.4492341848149
1884.590.1289192235867-5.62891922358671
198887.79917845283920.200821547160819
2093.994.8839696073719-0.983969607371844
2198.999.0856908978922-0.185690897892223
2296.789.49504534772487.2049546522752
2398.992.29269139396816.60730860603187
24102.291.171393992143611.0286060078564
25105.4102.1508692751183.24913072488226
26105.194.127228441748510.9727715582515
27116.6100.48591472594216.1140852740579
28112102.2498340561239.75016594387706
29108.896.759906427758712.0400935722413
30106.9111.140632518477-4.24063251847727
31109.5108.690874183550.80912581645007
32106.7108.327295303348-1.62729530334843
33118.9116.1019456065262.79805439347395
34117.5110.5005280101426.99947198985831
35113.7109.3960339505754.30396604942482
36119.6126.131482757897-6.53148275789715
37120.6125.847484387774-5.2474843877741
38117.5129.921456145501-12.4214561455013
39120.3129.469555772863-9.16955577286273
40119.8121.757738170216-1.95773817021594
41108107.0869930198730.913006980127153
4298.882.952677295484315.8473227045157
4394.689.64625923241944.95374076758056
4484.682.36847698106332.23152301893673
4584.475.40080988686438.99919011313569
4679.174.12067704341544.97932295658456
4773.359.575112499692113.7248875003079
4874.360.639440500116613.6605594998834
4967.855.096198839453312.7038011605467
5064.858.45077355682136.34922644317872
5166.561.02469124156735.47530875843267
5257.756.89106885064380.808931149356247
5353.854.9920572080451-1.19205720804508
5451.853.8939159193539-2.09391591935394
5550.954.4207308366597-3.52073083665975
564948.70083729272730.299162707272664
5748.155.5276732744385-7.42767327443854
5842.655.6954012187748-13.0954012187748
5940.957.9410953217211-17.0410953217211
6043.357.660462820095-14.360462820095
6143.755.7393618574027-12.0393618574027

\begin{tabular}{lllllllll}
\hline
Multiple Linear Regression - Actuals, Interpolation, and Residuals \tabularnewline
Time or Index & Actuals & InterpolationForecast & ResidualsPrediction Error \tabularnewline
1 & 61.2 & 55.4557018903147 & 5.74429810968529 \tabularnewline
2 & 62 & 61.0397892982126 & 0.96021070178737 \tabularnewline
3 & 65.1 & 65.0790681086928 & 0.0209318913072214 \tabularnewline
4 & 63.2 & 61.4809566104248 & 1.71904338957517 \tabularnewline
5 & 66.3 & 66.6118091595084 & -0.31180915950841 \tabularnewline
6 & 61.9 & 65.7838550430977 & -3.88385504309774 \tabularnewline
7 & 62.1 & 64.5429572945317 & -2.44295729453171 \tabularnewline
8 & 66.3 & 66.2194208154891 & 0.0805791845108795 \tabularnewline
9 & 72 & 76.1838803342789 & -4.18388033427887 \tabularnewline
10 & 65.3 & 71.3883483799432 & -6.08834837994323 \tabularnewline
11 & 67.6 & 75.1950668340435 & -7.59506683404349 \tabularnewline
12 & 70.5 & 74.2972199297476 & -3.79721992974763 \tabularnewline
13 & 74.2 & 78.6103837499374 & -4.41038374993744 \tabularnewline
14 & 77.8 & 83.6607525577163 & -5.86075255771633 \tabularnewline
15 & 78.5 & 90.940770150935 & -12.4407701509351 \tabularnewline
16 & 77.8 & 88.1204023125925 & -10.3204023125925 \tabularnewline
17 & 81.4 & 92.849234184815 & -11.4492341848149 \tabularnewline
18 & 84.5 & 90.1289192235867 & -5.62891922358671 \tabularnewline
19 & 88 & 87.7991784528392 & 0.200821547160819 \tabularnewline
20 & 93.9 & 94.8839696073719 & -0.983969607371844 \tabularnewline
21 & 98.9 & 99.0856908978922 & -0.185690897892223 \tabularnewline
22 & 96.7 & 89.4950453477248 & 7.2049546522752 \tabularnewline
23 & 98.9 & 92.2926913939681 & 6.60730860603187 \tabularnewline
24 & 102.2 & 91.1713939921436 & 11.0286060078564 \tabularnewline
25 & 105.4 & 102.150869275118 & 3.24913072488226 \tabularnewline
26 & 105.1 & 94.1272284417485 & 10.9727715582515 \tabularnewline
27 & 116.6 & 100.485914725942 & 16.1140852740579 \tabularnewline
28 & 112 & 102.249834056123 & 9.75016594387706 \tabularnewline
29 & 108.8 & 96.7599064277587 & 12.0400935722413 \tabularnewline
30 & 106.9 & 111.140632518477 & -4.24063251847727 \tabularnewline
31 & 109.5 & 108.69087418355 & 0.80912581645007 \tabularnewline
32 & 106.7 & 108.327295303348 & -1.62729530334843 \tabularnewline
33 & 118.9 & 116.101945606526 & 2.79805439347395 \tabularnewline
34 & 117.5 & 110.500528010142 & 6.99947198985831 \tabularnewline
35 & 113.7 & 109.396033950575 & 4.30396604942482 \tabularnewline
36 & 119.6 & 126.131482757897 & -6.53148275789715 \tabularnewline
37 & 120.6 & 125.847484387774 & -5.2474843877741 \tabularnewline
38 & 117.5 & 129.921456145501 & -12.4214561455013 \tabularnewline
39 & 120.3 & 129.469555772863 & -9.16955577286273 \tabularnewline
40 & 119.8 & 121.757738170216 & -1.95773817021594 \tabularnewline
41 & 108 & 107.086993019873 & 0.913006980127153 \tabularnewline
42 & 98.8 & 82.9526772954843 & 15.8473227045157 \tabularnewline
43 & 94.6 & 89.6462592324194 & 4.95374076758056 \tabularnewline
44 & 84.6 & 82.3684769810633 & 2.23152301893673 \tabularnewline
45 & 84.4 & 75.4008098868643 & 8.99919011313569 \tabularnewline
46 & 79.1 & 74.1206770434154 & 4.97932295658456 \tabularnewline
47 & 73.3 & 59.5751124996921 & 13.7248875003079 \tabularnewline
48 & 74.3 & 60.6394405001166 & 13.6605594998834 \tabularnewline
49 & 67.8 & 55.0961988394533 & 12.7038011605467 \tabularnewline
50 & 64.8 & 58.4507735568213 & 6.34922644317872 \tabularnewline
51 & 66.5 & 61.0246912415673 & 5.47530875843267 \tabularnewline
52 & 57.7 & 56.8910688506438 & 0.808931149356247 \tabularnewline
53 & 53.8 & 54.9920572080451 & -1.19205720804508 \tabularnewline
54 & 51.8 & 53.8939159193539 & -2.09391591935394 \tabularnewline
55 & 50.9 & 54.4207308366597 & -3.52073083665975 \tabularnewline
56 & 49 & 48.7008372927273 & 0.299162707272664 \tabularnewline
57 & 48.1 & 55.5276732744385 & -7.42767327443854 \tabularnewline
58 & 42.6 & 55.6954012187748 & -13.0954012187748 \tabularnewline
59 & 40.9 & 57.9410953217211 & -17.0410953217211 \tabularnewline
60 & 43.3 & 57.660462820095 & -14.360462820095 \tabularnewline
61 & 43.7 & 55.7393618574027 & -12.0393618574027 \tabularnewline
\hline
\end{tabular}
%Source: https://freestatistics.org/blog/index.php?pk=115741&T=4

[TABLE]
[ROW][C]Multiple Linear Regression - Actuals, Interpolation, and Residuals[/C][/ROW]
[ROW][C]Time or Index[/C][C]Actuals[/C][C]InterpolationForecast[/C][C]ResidualsPrediction Error[/C][/ROW]
[ROW][C]1[/C][C]61.2[/C][C]55.4557018903147[/C][C]5.74429810968529[/C][/ROW]
[ROW][C]2[/C][C]62[/C][C]61.0397892982126[/C][C]0.96021070178737[/C][/ROW]
[ROW][C]3[/C][C]65.1[/C][C]65.0790681086928[/C][C]0.0209318913072214[/C][/ROW]
[ROW][C]4[/C][C]63.2[/C][C]61.4809566104248[/C][C]1.71904338957517[/C][/ROW]
[ROW][C]5[/C][C]66.3[/C][C]66.6118091595084[/C][C]-0.31180915950841[/C][/ROW]
[ROW][C]6[/C][C]61.9[/C][C]65.7838550430977[/C][C]-3.88385504309774[/C][/ROW]
[ROW][C]7[/C][C]62.1[/C][C]64.5429572945317[/C][C]-2.44295729453171[/C][/ROW]
[ROW][C]8[/C][C]66.3[/C][C]66.2194208154891[/C][C]0.0805791845108795[/C][/ROW]
[ROW][C]9[/C][C]72[/C][C]76.1838803342789[/C][C]-4.18388033427887[/C][/ROW]
[ROW][C]10[/C][C]65.3[/C][C]71.3883483799432[/C][C]-6.08834837994323[/C][/ROW]
[ROW][C]11[/C][C]67.6[/C][C]75.1950668340435[/C][C]-7.59506683404349[/C][/ROW]
[ROW][C]12[/C][C]70.5[/C][C]74.2972199297476[/C][C]-3.79721992974763[/C][/ROW]
[ROW][C]13[/C][C]74.2[/C][C]78.6103837499374[/C][C]-4.41038374993744[/C][/ROW]
[ROW][C]14[/C][C]77.8[/C][C]83.6607525577163[/C][C]-5.86075255771633[/C][/ROW]
[ROW][C]15[/C][C]78.5[/C][C]90.940770150935[/C][C]-12.4407701509351[/C][/ROW]
[ROW][C]16[/C][C]77.8[/C][C]88.1204023125925[/C][C]-10.3204023125925[/C][/ROW]
[ROW][C]17[/C][C]81.4[/C][C]92.849234184815[/C][C]-11.4492341848149[/C][/ROW]
[ROW][C]18[/C][C]84.5[/C][C]90.1289192235867[/C][C]-5.62891922358671[/C][/ROW]
[ROW][C]19[/C][C]88[/C][C]87.7991784528392[/C][C]0.200821547160819[/C][/ROW]
[ROW][C]20[/C][C]93.9[/C][C]94.8839696073719[/C][C]-0.983969607371844[/C][/ROW]
[ROW][C]21[/C][C]98.9[/C][C]99.0856908978922[/C][C]-0.185690897892223[/C][/ROW]
[ROW][C]22[/C][C]96.7[/C][C]89.4950453477248[/C][C]7.2049546522752[/C][/ROW]
[ROW][C]23[/C][C]98.9[/C][C]92.2926913939681[/C][C]6.60730860603187[/C][/ROW]
[ROW][C]24[/C][C]102.2[/C][C]91.1713939921436[/C][C]11.0286060078564[/C][/ROW]
[ROW][C]25[/C][C]105.4[/C][C]102.150869275118[/C][C]3.24913072488226[/C][/ROW]
[ROW][C]26[/C][C]105.1[/C][C]94.1272284417485[/C][C]10.9727715582515[/C][/ROW]
[ROW][C]27[/C][C]116.6[/C][C]100.485914725942[/C][C]16.1140852740579[/C][/ROW]
[ROW][C]28[/C][C]112[/C][C]102.249834056123[/C][C]9.75016594387706[/C][/ROW]
[ROW][C]29[/C][C]108.8[/C][C]96.7599064277587[/C][C]12.0400935722413[/C][/ROW]
[ROW][C]30[/C][C]106.9[/C][C]111.140632518477[/C][C]-4.24063251847727[/C][/ROW]
[ROW][C]31[/C][C]109.5[/C][C]108.69087418355[/C][C]0.80912581645007[/C][/ROW]
[ROW][C]32[/C][C]106.7[/C][C]108.327295303348[/C][C]-1.62729530334843[/C][/ROW]
[ROW][C]33[/C][C]118.9[/C][C]116.101945606526[/C][C]2.79805439347395[/C][/ROW]
[ROW][C]34[/C][C]117.5[/C][C]110.500528010142[/C][C]6.99947198985831[/C][/ROW]
[ROW][C]35[/C][C]113.7[/C][C]109.396033950575[/C][C]4.30396604942482[/C][/ROW]
[ROW][C]36[/C][C]119.6[/C][C]126.131482757897[/C][C]-6.53148275789715[/C][/ROW]
[ROW][C]37[/C][C]120.6[/C][C]125.847484387774[/C][C]-5.2474843877741[/C][/ROW]
[ROW][C]38[/C][C]117.5[/C][C]129.921456145501[/C][C]-12.4214561455013[/C][/ROW]
[ROW][C]39[/C][C]120.3[/C][C]129.469555772863[/C][C]-9.16955577286273[/C][/ROW]
[ROW][C]40[/C][C]119.8[/C][C]121.757738170216[/C][C]-1.95773817021594[/C][/ROW]
[ROW][C]41[/C][C]108[/C][C]107.086993019873[/C][C]0.913006980127153[/C][/ROW]
[ROW][C]42[/C][C]98.8[/C][C]82.9526772954843[/C][C]15.8473227045157[/C][/ROW]
[ROW][C]43[/C][C]94.6[/C][C]89.6462592324194[/C][C]4.95374076758056[/C][/ROW]
[ROW][C]44[/C][C]84.6[/C][C]82.3684769810633[/C][C]2.23152301893673[/C][/ROW]
[ROW][C]45[/C][C]84.4[/C][C]75.4008098868643[/C][C]8.99919011313569[/C][/ROW]
[ROW][C]46[/C][C]79.1[/C][C]74.1206770434154[/C][C]4.97932295658456[/C][/ROW]
[ROW][C]47[/C][C]73.3[/C][C]59.5751124996921[/C][C]13.7248875003079[/C][/ROW]
[ROW][C]48[/C][C]74.3[/C][C]60.6394405001166[/C][C]13.6605594998834[/C][/ROW]
[ROW][C]49[/C][C]67.8[/C][C]55.0961988394533[/C][C]12.7038011605467[/C][/ROW]
[ROW][C]50[/C][C]64.8[/C][C]58.4507735568213[/C][C]6.34922644317872[/C][/ROW]
[ROW][C]51[/C][C]66.5[/C][C]61.0246912415673[/C][C]5.47530875843267[/C][/ROW]
[ROW][C]52[/C][C]57.7[/C][C]56.8910688506438[/C][C]0.808931149356247[/C][/ROW]
[ROW][C]53[/C][C]53.8[/C][C]54.9920572080451[/C][C]-1.19205720804508[/C][/ROW]
[ROW][C]54[/C][C]51.8[/C][C]53.8939159193539[/C][C]-2.09391591935394[/C][/ROW]
[ROW][C]55[/C][C]50.9[/C][C]54.4207308366597[/C][C]-3.52073083665975[/C][/ROW]
[ROW][C]56[/C][C]49[/C][C]48.7008372927273[/C][C]0.299162707272664[/C][/ROW]
[ROW][C]57[/C][C]48.1[/C][C]55.5276732744385[/C][C]-7.42767327443854[/C][/ROW]
[ROW][C]58[/C][C]42.6[/C][C]55.6954012187748[/C][C]-13.0954012187748[/C][/ROW]
[ROW][C]59[/C][C]40.9[/C][C]57.9410953217211[/C][C]-17.0410953217211[/C][/ROW]
[ROW][C]60[/C][C]43.3[/C][C]57.660462820095[/C][C]-14.360462820095[/C][/ROW]
[ROW][C]61[/C][C]43.7[/C][C]55.7393618574027[/C][C]-12.0393618574027[/C][/ROW]
[/TABLE]
Source: https://freestatistics.org/blog/index.php?pk=115741&T=4

Globally Unique Identifier (entire table): ba.freestatistics.org/blog/index.php?pk=115741&T=4

As an alternative you can also use a QR Code:  

The GUIDs for individual cells are displayed in the table below:

Multiple Linear Regression - Actuals, Interpolation, and Residuals
Time or IndexActualsInterpolationForecastResidualsPrediction Error
161.255.45570189031475.74429810968529
26261.03978929821260.96021070178737
365.165.07906810869280.0209318913072214
463.261.48095661042481.71904338957517
566.366.6118091595084-0.31180915950841
661.965.7838550430977-3.88385504309774
762.164.5429572945317-2.44295729453171
866.366.21942081548910.0805791845108795
97276.1838803342789-4.18388033427887
1065.371.3883483799432-6.08834837994323
1167.675.1950668340435-7.59506683404349
1270.574.2972199297476-3.79721992974763
1374.278.6103837499374-4.41038374993744
1477.883.6607525577163-5.86075255771633
1578.590.940770150935-12.4407701509351
1677.888.1204023125925-10.3204023125925
1781.492.849234184815-11.4492341848149
1884.590.1289192235867-5.62891922358671
198887.79917845283920.200821547160819
2093.994.8839696073719-0.983969607371844
2198.999.0856908978922-0.185690897892223
2296.789.49504534772487.2049546522752
2398.992.29269139396816.60730860603187
24102.291.171393992143611.0286060078564
25105.4102.1508692751183.24913072488226
26105.194.127228441748510.9727715582515
27116.6100.48591472594216.1140852740579
28112102.2498340561239.75016594387706
29108.896.759906427758712.0400935722413
30106.9111.140632518477-4.24063251847727
31109.5108.690874183550.80912581645007
32106.7108.327295303348-1.62729530334843
33118.9116.1019456065262.79805439347395
34117.5110.5005280101426.99947198985831
35113.7109.3960339505754.30396604942482
36119.6126.131482757897-6.53148275789715
37120.6125.847484387774-5.2474843877741
38117.5129.921456145501-12.4214561455013
39120.3129.469555772863-9.16955577286273
40119.8121.757738170216-1.95773817021594
41108107.0869930198730.913006980127153
4298.882.952677295484315.8473227045157
4394.689.64625923241944.95374076758056
4484.682.36847698106332.23152301893673
4584.475.40080988686438.99919011313569
4679.174.12067704341544.97932295658456
4773.359.575112499692113.7248875003079
4874.360.639440500116613.6605594998834
4967.855.096198839453312.7038011605467
5064.858.45077355682136.34922644317872
5166.561.02469124156735.47530875843267
5257.756.89106885064380.808931149356247
5353.854.9920572080451-1.19205720804508
5451.853.8939159193539-2.09391591935394
5550.954.4207308366597-3.52073083665975
564948.70083729272730.299162707272664
5748.155.5276732744385-7.42767327443854
5842.655.6954012187748-13.0954012187748
5940.957.9410953217211-17.0410953217211
6043.357.660462820095-14.360462820095
6143.755.7393618574027-12.0393618574027


Goldfeld-Quandt test for Heteroskedasticity
p-valuesAlternative Hypothesis
breakpoint indexgreater2-sidedless
190.007399337404079240.01479867480815850.99260066259592
200.4144307852023210.8288615704046410.585569214797679
210.3576288892927410.7152577785854830.642371110707258
220.2713535002341230.5427070004682470.728646499765877
230.233950557472510.467901114945020.76604944252749
240.1529314277839620.3058628555679250.847068572216038
250.4001698226844020.8003396453688030.599830177315598
260.3276222184372650.655244436874530.672377781562735
270.3380619962037510.6761239924075020.661938003796249
280.3767687439169990.7535374878339980.623231256083001
290.2843454995978690.5686909991957380.715654500402131
300.5800974129060.8398051741879990.419902587094000
310.6597465752883250.680506849423350.340253424711675
320.8490393901867140.3019212196265720.150960609813286
330.8179775853296230.3640448293407530.182022414670377
340.8153489914374870.3693020171250260.184651008562513
350.7370671205806090.5258657588387830.262932879419391
360.7455866423364190.5088267153271620.254413357663581
370.6760764242664190.6478471514671620.323923575733581
380.7617796847338040.4764406305323920.238220315266196
390.8138122714909520.3723754570180960.186187728509048
400.7018382446814380.5963235106371240.298161755318562
410.6407076024875160.7185847950249690.359292397512484
420.7331392476419180.5337215047161630.266860752358082

\begin{tabular}{lllllllll}
\hline
Goldfeld-Quandt test for Heteroskedasticity \tabularnewline
p-values & Alternative Hypothesis \tabularnewline
breakpoint index & greater & 2-sided & less \tabularnewline
19 & 0.00739933740407924 & 0.0147986748081585 & 0.99260066259592 \tabularnewline
20 & 0.414430785202321 & 0.828861570404641 & 0.585569214797679 \tabularnewline
21 & 0.357628889292741 & 0.715257778585483 & 0.642371110707258 \tabularnewline
22 & 0.271353500234123 & 0.542707000468247 & 0.728646499765877 \tabularnewline
23 & 0.23395055747251 & 0.46790111494502 & 0.76604944252749 \tabularnewline
24 & 0.152931427783962 & 0.305862855567925 & 0.847068572216038 \tabularnewline
25 & 0.400169822684402 & 0.800339645368803 & 0.599830177315598 \tabularnewline
26 & 0.327622218437265 & 0.65524443687453 & 0.672377781562735 \tabularnewline
27 & 0.338061996203751 & 0.676123992407502 & 0.661938003796249 \tabularnewline
28 & 0.376768743916999 & 0.753537487833998 & 0.623231256083001 \tabularnewline
29 & 0.284345499597869 & 0.568690999195738 & 0.715654500402131 \tabularnewline
30 & 0.580097412906 & 0.839805174187999 & 0.419902587094000 \tabularnewline
31 & 0.659746575288325 & 0.68050684942335 & 0.340253424711675 \tabularnewline
32 & 0.849039390186714 & 0.301921219626572 & 0.150960609813286 \tabularnewline
33 & 0.817977585329623 & 0.364044829340753 & 0.182022414670377 \tabularnewline
34 & 0.815348991437487 & 0.369302017125026 & 0.184651008562513 \tabularnewline
35 & 0.737067120580609 & 0.525865758838783 & 0.262932879419391 \tabularnewline
36 & 0.745586642336419 & 0.508826715327162 & 0.254413357663581 \tabularnewline
37 & 0.676076424266419 & 0.647847151467162 & 0.323923575733581 \tabularnewline
38 & 0.761779684733804 & 0.476440630532392 & 0.238220315266196 \tabularnewline
39 & 0.813812271490952 & 0.372375457018096 & 0.186187728509048 \tabularnewline
40 & 0.701838244681438 & 0.596323510637124 & 0.298161755318562 \tabularnewline
41 & 0.640707602487516 & 0.718584795024969 & 0.359292397512484 \tabularnewline
42 & 0.733139247641918 & 0.533721504716163 & 0.266860752358082 \tabularnewline
\hline
\end{tabular}
%Source: https://freestatistics.org/blog/index.php?pk=115741&T=5

[TABLE]
[ROW][C]Goldfeld-Quandt test for Heteroskedasticity[/C][/ROW]
[ROW][C]p-values[/C][C]Alternative Hypothesis[/C][/ROW]
[ROW][C]breakpoint index[/C][C]greater[/C][C]2-sided[/C][C]less[/C][/ROW]
[ROW][C]19[/C][C]0.00739933740407924[/C][C]0.0147986748081585[/C][C]0.99260066259592[/C][/ROW]
[ROW][C]20[/C][C]0.414430785202321[/C][C]0.828861570404641[/C][C]0.585569214797679[/C][/ROW]
[ROW][C]21[/C][C]0.357628889292741[/C][C]0.715257778585483[/C][C]0.642371110707258[/C][/ROW]
[ROW][C]22[/C][C]0.271353500234123[/C][C]0.542707000468247[/C][C]0.728646499765877[/C][/ROW]
[ROW][C]23[/C][C]0.23395055747251[/C][C]0.46790111494502[/C][C]0.76604944252749[/C][/ROW]
[ROW][C]24[/C][C]0.152931427783962[/C][C]0.305862855567925[/C][C]0.847068572216038[/C][/ROW]
[ROW][C]25[/C][C]0.400169822684402[/C][C]0.800339645368803[/C][C]0.599830177315598[/C][/ROW]
[ROW][C]26[/C][C]0.327622218437265[/C][C]0.65524443687453[/C][C]0.672377781562735[/C][/ROW]
[ROW][C]27[/C][C]0.338061996203751[/C][C]0.676123992407502[/C][C]0.661938003796249[/C][/ROW]
[ROW][C]28[/C][C]0.376768743916999[/C][C]0.753537487833998[/C][C]0.623231256083001[/C][/ROW]
[ROW][C]29[/C][C]0.284345499597869[/C][C]0.568690999195738[/C][C]0.715654500402131[/C][/ROW]
[ROW][C]30[/C][C]0.580097412906[/C][C]0.839805174187999[/C][C]0.419902587094000[/C][/ROW]
[ROW][C]31[/C][C]0.659746575288325[/C][C]0.68050684942335[/C][C]0.340253424711675[/C][/ROW]
[ROW][C]32[/C][C]0.849039390186714[/C][C]0.301921219626572[/C][C]0.150960609813286[/C][/ROW]
[ROW][C]33[/C][C]0.817977585329623[/C][C]0.364044829340753[/C][C]0.182022414670377[/C][/ROW]
[ROW][C]34[/C][C]0.815348991437487[/C][C]0.369302017125026[/C][C]0.184651008562513[/C][/ROW]
[ROW][C]35[/C][C]0.737067120580609[/C][C]0.525865758838783[/C][C]0.262932879419391[/C][/ROW]
[ROW][C]36[/C][C]0.745586642336419[/C][C]0.508826715327162[/C][C]0.254413357663581[/C][/ROW]
[ROW][C]37[/C][C]0.676076424266419[/C][C]0.647847151467162[/C][C]0.323923575733581[/C][/ROW]
[ROW][C]38[/C][C]0.761779684733804[/C][C]0.476440630532392[/C][C]0.238220315266196[/C][/ROW]
[ROW][C]39[/C][C]0.813812271490952[/C][C]0.372375457018096[/C][C]0.186187728509048[/C][/ROW]
[ROW][C]40[/C][C]0.701838244681438[/C][C]0.596323510637124[/C][C]0.298161755318562[/C][/ROW]
[ROW][C]41[/C][C]0.640707602487516[/C][C]0.718584795024969[/C][C]0.359292397512484[/C][/ROW]
[ROW][C]42[/C][C]0.733139247641918[/C][C]0.533721504716163[/C][C]0.266860752358082[/C][/ROW]
[/TABLE]
Source: https://freestatistics.org/blog/index.php?pk=115741&T=5

Globally Unique Identifier (entire table): ba.freestatistics.org/blog/index.php?pk=115741&T=5

As an alternative you can also use a QR Code:  

The GUIDs for individual cells are displayed in the table below:

Goldfeld-Quandt test for Heteroskedasticity
p-valuesAlternative Hypothesis
breakpoint indexgreater2-sidedless
190.007399337404079240.01479867480815850.99260066259592
200.4144307852023210.8288615704046410.585569214797679
210.3576288892927410.7152577785854830.642371110707258
220.2713535002341230.5427070004682470.728646499765877
230.233950557472510.467901114945020.76604944252749
240.1529314277839620.3058628555679250.847068572216038
250.4001698226844020.8003396453688030.599830177315598
260.3276222184372650.655244436874530.672377781562735
270.3380619962037510.6761239924075020.661938003796249
280.3767687439169990.7535374878339980.623231256083001
290.2843454995978690.5686909991957380.715654500402131
300.5800974129060.8398051741879990.419902587094000
310.6597465752883250.680506849423350.340253424711675
320.8490393901867140.3019212196265720.150960609813286
330.8179775853296230.3640448293407530.182022414670377
340.8153489914374870.3693020171250260.184651008562513
350.7370671205806090.5258657588387830.262932879419391
360.7455866423364190.5088267153271620.254413357663581
370.6760764242664190.6478471514671620.323923575733581
380.7617796847338040.4764406305323920.238220315266196
390.8138122714909520.3723754570180960.186187728509048
400.7018382446814380.5963235106371240.298161755318562
410.6407076024875160.7185847950249690.359292397512484
420.7331392476419180.5337215047161630.266860752358082


Meta Analysis of Goldfeld-Quandt test for Heteroskedasticity
Description# significant tests% significant testsOK/NOK
1% type I error level00OK
5% type I error level10.0416666666666667OK
10% type I error level10.0416666666666667OK

\begin{tabular}{lllllllll}
\hline
Meta Analysis of Goldfeld-Quandt test for Heteroskedasticity \tabularnewline
Description & # significant tests & % significant tests & OK/NOK \tabularnewline
1% type I error level & 0 & 0 & OK \tabularnewline
5% type I error level & 1 & 0.0416666666666667 & OK \tabularnewline
10% type I error level & 1 & 0.0416666666666667 & OK \tabularnewline
\hline
\end{tabular}
%Source: https://freestatistics.org/blog/index.php?pk=115741&T=6

[TABLE]
[ROW][C]Meta Analysis of Goldfeld-Quandt test for Heteroskedasticity[/C][/ROW]
[ROW][C]Description[/C][C]# significant tests[/C][C]% significant tests[/C][C]OK/NOK[/C][/ROW]
[ROW][C]1% type I error level[/C][C]0[/C][C]0[/C][C]OK[/C][/ROW]
[ROW][C]5% type I error level[/C][C]1[/C][C]0.0416666666666667[/C][C]OK[/C][/ROW]
[ROW][C]10% type I error level[/C][C]1[/C][C]0.0416666666666667[/C][C]OK[/C][/ROW]
[/TABLE]
Source: https://freestatistics.org/blog/index.php?pk=115741&T=6

Globally Unique Identifier (entire table): ba.freestatistics.org/blog/index.php?pk=115741&T=6

As an alternative you can also use a QR Code:  

The GUIDs for individual cells are displayed in the table below:

Meta Analysis of Goldfeld-Quandt test for Heteroskedasticity
Description# significant tests% significant testsOK/NOK
1% type I error level00OK
5% type I error level10.0416666666666667OK
10% type I error level10.0416666666666667OK


Parameters (Session):
par1 = 12 ; par2 = 0.3 ; par3 = 1 ; par4 = 0 ; par5 = 12 ; par6 = 0 ; par7 = 0 ; par8 = 1 ; par9 = 0 ; par10 = FALSE ;
Parameters (R input):
par1 = 1 ; par2 = Include Monthly Dummies ; par3 = Linear Trend ;
R code (references can be found in the software module):
library(lattice)
library(lmtest)
n25 <- 25 #minimum number of obs. for Goldfeld-Quandt test
par1 <- as.numeric(par1)
x <- t(y)
k <- length(x[1,])
n <- length(x[,1])
x1 <- cbind(x[,par1], x[,1:k!=par1])
mycolnames <- c(colnames(x)[par1], colnames(x)[1:k!=par1])
colnames(x1) <- mycolnames #colnames(x)[par1]
x <- x1
if (par3 == 'First Differences'){
x2 <- array(0, dim=c(n-1,k), dimnames=list(1:(n-1), paste('(1-B)',colnames(x),sep='')))
for (i in 1:n-1) {
for (j in 1:k) {
x2[i,j] <- x[i+1,j] - x[i,j]
}
}
x <- x2
}
if (par2 == 'Include Monthly Dummies'){
x2 <- array(0, dim=c(n,11), dimnames=list(1:n, paste('M', seq(1:11), sep ='')))
for (i in 1:11){
x2[seq(i,n,12),i] <- 1
}
x <- cbind(x, x2)
}
if (par2 == 'Include Quarterly Dummies'){
x2 <- array(0, dim=c(n,3), dimnames=list(1:n, paste('Q', seq(1:3), sep ='')))
for (i in 1:3){
x2[seq(i,n,4),i] <- 1
}
x <- cbind(x, x2)
}
k <- length(x[1,])
if (par3 == 'Linear Trend'){
x <- cbind(x, c(1:n))
colnames(x)[k+1] <- 't'
}
x
k <- length(x[1,])
df <- as.data.frame(x)
(mylm <- lm(df))
(mysum <- summary(mylm))
if (n > n25) {
kp3 <- k + 3
nmkm3 <- n - k - 3
gqarr <- array(NA, dim=c(nmkm3-kp3+1,3))
numgqtests <- 0
numsignificant1 <- 0
numsignificant5 <- 0
numsignificant10 <- 0
for (mypoint in kp3:nmkm3) {
j <- 0
numgqtests <- numgqtests + 1
for (myalt in c('greater', 'two.sided', 'less')) {
j <- j + 1
gqarr[mypoint-kp3+1,j] <- gqtest(mylm, point=mypoint, alternative=myalt)$p.value
}
if (gqarr[mypoint-kp3+1,2] < 0.01) numsignificant1 <- numsignificant1 + 1
if (gqarr[mypoint-kp3+1,2] < 0.05) numsignificant5 <- numsignificant5 + 1
if (gqarr[mypoint-kp3+1,2] < 0.10) numsignificant10 <- numsignificant10 + 1
}
gqarr
}
bitmap(file='test0.png')
plot(x[,1], type='l', main='Actuals and Interpolation', ylab='value of Actuals and Interpolation (dots)', xlab='time or index')
points(x[,1]-mysum$resid)
grid()
dev.off()
bitmap(file='test1.png')
plot(mysum$resid, type='b', pch=19, main='Residuals', ylab='value of Residuals', xlab='time or index')
grid()
dev.off()
bitmap(file='test2.png')
hist(mysum$resid, main='Residual Histogram', xlab='values of Residuals')
grid()
dev.off()
bitmap(file='test3.png')
densityplot(~mysum$resid,col='black',main='Residual Density Plot', xlab='values of Residuals')
dev.off()
bitmap(file='test4.png')
qqnorm(mysum$resid, main='Residual Normal Q-Q Plot')
qqline(mysum$resid)
grid()
dev.off()
(myerror <- as.ts(mysum$resid))
bitmap(file='test5.png')
dum <- cbind(lag(myerror,k=1),myerror)
dum
dum1 <- dum[2:length(myerror),]
dum1
z <- as.data.frame(dum1)
z
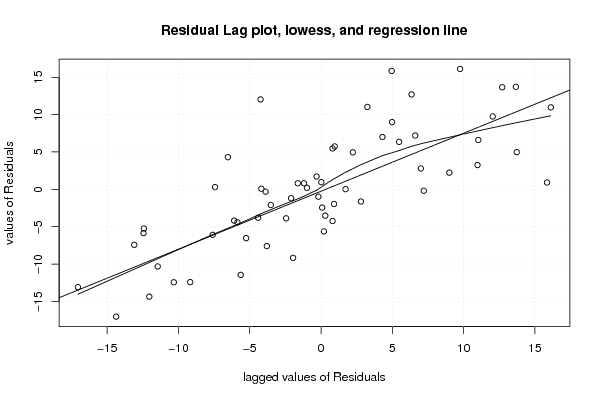
plot(z,main=paste('Residual Lag plot, lowess, and regression line'), ylab='values of Residuals', xlab='lagged values of Residuals')
lines(lowess(z))
abline(lm(z))
grid()
dev.off()
bitmap(file='test6.png')
acf(mysum$resid, lag.max=length(mysum$resid)/2, main='Residual Autocorrelation Function')
grid()
dev.off()
bitmap(file='test7.png')
pacf(mysum$resid, lag.max=length(mysum$resid)/2, main='Residual Partial Autocorrelation Function')
grid()
dev.off()
bitmap(file='test8.png')
opar <- par(mfrow = c(2,2), oma = c(0, 0, 1.1, 0))
plot(mylm, las = 1, sub='Residual Diagnostics')
par(opar)
dev.off()
if (n > n25) {
bitmap(file='test9.png')
plot(kp3:nmkm3,gqarr[,2], main='Goldfeld-Quandt test',ylab='2-sided p-value',xlab='breakpoint')
grid()
dev.off()
}
load(file='createtable')
a<-table.start()
a<-table.row.start(a)
a<-table.element(a, 'Multiple Linear Regression - Estimated Regression Equation', 1, TRUE)
a<-table.row.end(a)
myeq <- colnames(x)[1]
myeq <- paste(myeq, '[t] = ', sep='')
for (i in 1:k){
if (mysum$coefficients[i,1] > 0) myeq <- paste(myeq, '+', '')
myeq <- paste(myeq, mysum$coefficients[i,1], sep=' ')
if (rownames(mysum$coefficients)[i] != '(Intercept)') {
myeq <- paste(myeq, rownames(mysum$coefficients)[i], sep='')
if (rownames(mysum$coefficients)[i] != 't') myeq <- paste(myeq, '[t]', sep='')
}
}
myeq <- paste(myeq, ' + e[t]')
a<-table.row.start(a)
a<-table.element(a, myeq)
a<-table.row.end(a)
a<-table.end(a)
table.save(a,file='mytable1.tab')
a<-table.start()
a<-table.row.start(a)
a<-table.element(a,hyperlink('ols1.htm','Multiple Linear Regression - Ordinary Least Squares',''), 6, TRUE)
a<-table.row.end(a)
a<-table.row.start(a)
a<-table.element(a,'Variable',header=TRUE)
a<-table.element(a,'Parameter',header=TRUE)
a<-table.element(a,'S.D.',header=TRUE)
a<-table.element(a,'T-STAT
H0: parameter = 0',header=TRUE)
a<-table.element(a,'2-tail p-value',header=TRUE)
a<-table.element(a,'1-tail p-value',header=TRUE)
a<-table.row.end(a)
for (i in 1:k){
a<-table.row.start(a)
a<-table.element(a,rownames(mysum$coefficients)[i],header=TRUE)
a<-table.element(a,mysum$coefficients[i,1])
a<-table.element(a, round(mysum$coefficients[i,2],6))
a<-table.element(a, round(mysum$coefficients[i,3],4))
a<-table.element(a, round(mysum$coefficients[i,4],6))
a<-table.element(a, round(mysum$coefficients[i,4]/2,6))
a<-table.row.end(a)
}
a<-table.end(a)
table.save(a,file='mytable2.tab')
a<-table.start()
a<-table.row.start(a)
a<-table.element(a, 'Multiple Linear Regression - Regression Statistics', 2, TRUE)
a<-table.row.end(a)
a<-table.row.start(a)
a<-table.element(a, 'Multiple R',1,TRUE)
a<-table.element(a, sqrt(mysum$r.squared))
a<-table.row.end(a)
a<-table.row.start(a)
a<-table.element(a, 'R-squared',1,TRUE)
a<-table.element(a, mysum$r.squared)
a<-table.row.end(a)
a<-table.row.start(a)
a<-table.element(a, 'Adjusted R-squared',1,TRUE)
a<-table.element(a, mysum$adj.r.squared)
a<-table.row.end(a)
a<-table.row.start(a)
a<-table.element(a, 'F-TEST (value)',1,TRUE)
a<-table.element(a, mysum$fstatistic[1])
a<-table.row.end(a)
a<-table.row.start(a)
a<-table.element(a, 'F-TEST (DF numerator)',1,TRUE)
a<-table.element(a, mysum$fstatistic[2])
a<-table.row.end(a)
a<-table.row.start(a)
a<-table.element(a, 'F-TEST (DF denominator)',1,TRUE)
a<-table.element(a, mysum$fstatistic[3])
a<-table.row.end(a)
a<-table.row.start(a)
a<-table.element(a, 'p-value',1,TRUE)
a<-table.element(a, 1-pf(mysum$fstatistic[1],mysum$fstatistic[2],mysum$fstatistic[3]))
a<-table.row.end(a)
a<-table.row.start(a)
a<-table.element(a, 'Multiple Linear Regression - Residual Statistics', 2, TRUE)
a<-table.row.end(a)
a<-table.row.start(a)
a<-table.element(a, 'Residual Standard Deviation',1,TRUE)
a<-table.element(a, mysum$sigma)
a<-table.row.end(a)
a<-table.row.start(a)
a<-table.element(a, 'Sum Squared Residuals',1,TRUE)
a<-table.element(a, sum(myerror*myerror))
a<-table.row.end(a)
a<-table.end(a)
table.save(a,file='mytable3.tab')
a<-table.start()
a<-table.row.start(a)
a<-table.element(a, 'Multiple Linear Regression - Actuals, Interpolation, and Residuals', 4, TRUE)
a<-table.row.end(a)
a<-table.row.start(a)
a<-table.element(a, 'Time or Index', 1, TRUE)
a<-table.element(a, 'Actuals', 1, TRUE)
a<-table.element(a, 'Interpolation
Forecast', 1, TRUE)
a<-table.element(a, 'Residuals
Prediction Error', 1, TRUE)
a<-table.row.end(a)
for (i in 1:n) {
a<-table.row.start(a)
a<-table.element(a,i, 1, TRUE)
a<-table.element(a,x[i])
a<-table.element(a,x[i]-mysum$resid[i])
a<-table.element(a,mysum$resid[i])
a<-table.row.end(a)
}
a<-table.end(a)
table.save(a,file='mytable4.tab')
if (n > n25) {
a<-table.start()
a<-table.row.start(a)
a<-table.element(a,'Goldfeld-Quandt test for Heteroskedasticity',4,TRUE)
a<-table.row.end(a)
a<-table.row.start(a)
a<-table.element(a,'p-values',header=TRUE)
a<-table.element(a,'Alternative Hypothesis',3,header=TRUE)
a<-table.row.end(a)
a<-table.row.start(a)
a<-table.element(a,'breakpoint index',header=TRUE)
a<-table.element(a,'greater',header=TRUE)
a<-table.element(a,'2-sided',header=TRUE)
a<-table.element(a,'less',header=TRUE)
a<-table.row.end(a)
for (mypoint in kp3:nmkm3) {
a<-table.row.start(a)
a<-table.element(a,mypoint,header=TRUE)
a<-table.element(a,gqarr[mypoint-kp3+1,1])
a<-table.element(a,gqarr[mypoint-kp3+1,2])
a<-table.element(a,gqarr[mypoint-kp3+1,3])
a<-table.row.end(a)
}
a<-table.end(a)
table.save(a,file='mytable5.tab')
a<-table.start()
a<-table.row.start(a)
a<-table.element(a,'Meta Analysis of Goldfeld-Quandt test for Heteroskedasticity',4,TRUE)
a<-table.row.end(a)
a<-table.row.start(a)
a<-table.element(a,'Description',header=TRUE)
a<-table.element(a,'# significant tests',header=TRUE)
a<-table.element(a,'% significant tests',header=TRUE)
a<-table.element(a,'OK/NOK',header=TRUE)
a<-table.row.end(a)
a<-table.row.start(a)
a<-table.element(a,'1% type I error level',header=TRUE)
a<-table.element(a,numsignificant1)
a<-table.element(a,numsignificant1/numgqtests)
if (numsignificant1/numgqtests < 0.01) dum <- 'OK' else dum <- 'NOK'
a<-table.element(a,dum)
a<-table.row.end(a)
a<-table.row.start(a)
a<-table.element(a,'5% type I error level',header=TRUE)
a<-table.element(a,numsignificant5)
a<-table.element(a,numsignificant5/numgqtests)
if (numsignificant5/numgqtests < 0.05) dum <- 'OK' else dum <- 'NOK'
a<-table.element(a,dum)
a<-table.row.end(a)
a<-table.row.start(a)
a<-table.element(a,'10% type I error level',header=TRUE)
a<-table.element(a,numsignificant10)
a<-table.element(a,numsignificant10/numgqtests)
if (numsignificant10/numgqtests < 0.1) dum <- 'OK' else dum <- 'NOK'
a<-table.element(a,dum)
a<-table.row.end(a)
a<-table.end(a)
table.save(a,file='mytable6.tab')
}