ARIMA FORECAST | |||||||||||||||||||||||||||||||||||||||||||||||||||||||||||||||||||||||||||||||||||||||||||||||||||||||||||||||||||||||||||||||||||||||||||||||||||||||||||||||||||||||||||||||||||||||||||||||||||||||||||||||||||||||||||||||||||||||||||||||||||||||||||||||||||||||||||||||||||||||||||||||||||||||||||||||||||||||||||||||||||||||||||||||||||||||||||||||
| *The author of this computation has been verified* | |||||||||||||||||||||||||||||||||||||||||||||||||||||||||||||||||||||||||||||||||||||||||||||||||||||||||||||||||||||||||||||||||||||||||||||||||||||||||||||||||||||||||||||||||||||||||||||||||||||||||||||||||||||||||||||||||||||||||||||||||||||||||||||||||||||||||||||||||||||||||||||||||||||||||||||||||||||||||||||||||||||||||||||||||||||||||||||||
| R Software Module: /rwasp_arimaforecasting.wasp (opens new window with default values) | |||||||||||||||||||||||||||||||||||||||||||||||||||||||||||||||||||||||||||||||||||||||||||||||||||||||||||||||||||||||||||||||||||||||||||||||||||||||||||||||||||||||||||||||||||||||||||||||||||||||||||||||||||||||||||||||||||||||||||||||||||||||||||||||||||||||||||||||||||||||||||||||||||||||||||||||||||||||||||||||||||||||||||||||||||||||||||||||
| Title produced by software: ARIMA Forecasting | |||||||||||||||||||||||||||||||||||||||||||||||||||||||||||||||||||||||||||||||||||||||||||||||||||||||||||||||||||||||||||||||||||||||||||||||||||||||||||||||||||||||||||||||||||||||||||||||||||||||||||||||||||||||||||||||||||||||||||||||||||||||||||||||||||||||||||||||||||||||||||||||||||||||||||||||||||||||||||||||||||||||||||||||||||||||||||||||
| Date of computation: Sat, 25 Dec 2010 16:51:28 +0000 | |||||||||||||||||||||||||||||||||||||||||||||||||||||||||||||||||||||||||||||||||||||||||||||||||||||||||||||||||||||||||||||||||||||||||||||||||||||||||||||||||||||||||||||||||||||||||||||||||||||||||||||||||||||||||||||||||||||||||||||||||||||||||||||||||||||||||||||||||||||||||||||||||||||||||||||||||||||||||||||||||||||||||||||||||||||||||||||||
| Cite this page as follows: | |||||||||||||||||||||||||||||||||||||||||||||||||||||||||||||||||||||||||||||||||||||||||||||||||||||||||||||||||||||||||||||||||||||||||||||||||||||||||||||||||||||||||||||||||||||||||||||||||||||||||||||||||||||||||||||||||||||||||||||||||||||||||||||||||||||||||||||||||||||||||||||||||||||||||||||||||||||||||||||||||||||||||||||||||||||||||||||||
| Statistical Computations at FreeStatistics.org, Office for Research Development and Education, URL http://www.freestatistics.org/blog/date/2010/Dec/25/t1293295767z3izzq93y05blqc.htm/, Retrieved Sat, 25 Dec 2010 17:49:29 +0100 | |||||||||||||||||||||||||||||||||||||||||||||||||||||||||||||||||||||||||||||||||||||||||||||||||||||||||||||||||||||||||||||||||||||||||||||||||||||||||||||||||||||||||||||||||||||||||||||||||||||||||||||||||||||||||||||||||||||||||||||||||||||||||||||||||||||||||||||||||||||||||||||||||||||||||||||||||||||||||||||||||||||||||||||||||||||||||||||||
| BibTeX entries for LaTeX users: | |||||||||||||||||||||||||||||||||||||||||||||||||||||||||||||||||||||||||||||||||||||||||||||||||||||||||||||||||||||||||||||||||||||||||||||||||||||||||||||||||||||||||||||||||||||||||||||||||||||||||||||||||||||||||||||||||||||||||||||||||||||||||||||||||||||||||||||||||||||||||||||||||||||||||||||||||||||||||||||||||||||||||||||||||||||||||||||||
@Manual{KEY,
    author = {{YOUR NAME}},
    publisher = {Office for Research Development and Education},
    title = {Statistical Computations at FreeStatistics.org, URL http://www.freestatistics.org/blog/date/2010/Dec/25/t1293295767z3izzq93y05blqc.htm/},
    year = {2010},
}
@Manual{R,
    title = {R: A Language and Environment for Statistical Computing},
    author = {{R Development Core Team}},
    organization = {R Foundation for Statistical Computing},
    address = {Vienna, Austria},
    year = {2010},
    note = {{ISBN} 3-900051-07-0},
    url = {http://www.R-project.org},
}
| |||||||||||||||||||||||||||||||||||||||||||||||||||||||||||||||||||||||||||||||||||||||||||||||||||||||||||||||||||||||||||||||||||||||||||||||||||||||||||||||||||||||||||||||||||||||||||||||||||||||||||||||||||||||||||||||||||||||||||||||||||||||||||||||||||||||||||||||||||||||||||||||||||||||||||||||||||||||||||||||||||||||||||||||||||||||||||||||
| Original text written by user: | |||||||||||||||||||||||||||||||||||||||||||||||||||||||||||||||||||||||||||||||||||||||||||||||||||||||||||||||||||||||||||||||||||||||||||||||||||||||||||||||||||||||||||||||||||||||||||||||||||||||||||||||||||||||||||||||||||||||||||||||||||||||||||||||||||||||||||||||||||||||||||||||||||||||||||||||||||||||||||||||||||||||||||||||||||||||||||||||
| IsPrivate? | |||||||||||||||||||||||||||||||||||||||||||||||||||||||||||||||||||||||||||||||||||||||||||||||||||||||||||||||||||||||||||||||||||||||||||||||||||||||||||||||||||||||||||||||||||||||||||||||||||||||||||||||||||||||||||||||||||||||||||||||||||||||||||||||||||||||||||||||||||||||||||||||||||||||||||||||||||||||||||||||||||||||||||||||||||||||||||||||
| No (this computation is public) | |||||||||||||||||||||||||||||||||||||||||||||||||||||||||||||||||||||||||||||||||||||||||||||||||||||||||||||||||||||||||||||||||||||||||||||||||||||||||||||||||||||||||||||||||||||||||||||||||||||||||||||||||||||||||||||||||||||||||||||||||||||||||||||||||||||||||||||||||||||||||||||||||||||||||||||||||||||||||||||||||||||||||||||||||||||||||||||||
| User-defined keywords: | |||||||||||||||||||||||||||||||||||||||||||||||||||||||||||||||||||||||||||||||||||||||||||||||||||||||||||||||||||||||||||||||||||||||||||||||||||||||||||||||||||||||||||||||||||||||||||||||||||||||||||||||||||||||||||||||||||||||||||||||||||||||||||||||||||||||||||||||||||||||||||||||||||||||||||||||||||||||||||||||||||||||||||||||||||||||||||||||
| Dataseries X: | |||||||||||||||||||||||||||||||||||||||||||||||||||||||||||||||||||||||||||||||||||||||||||||||||||||||||||||||||||||||||||||||||||||||||||||||||||||||||||||||||||||||||||||||||||||||||||||||||||||||||||||||||||||||||||||||||||||||||||||||||||||||||||||||||||||||||||||||||||||||||||||||||||||||||||||||||||||||||||||||||||||||||||||||||||||||||||||||
| » Textbox « » Textfile « » CSV « | |||||||||||||||||||||||||||||||||||||||||||||||||||||||||||||||||||||||||||||||||||||||||||||||||||||||||||||||||||||||||||||||||||||||||||||||||||||||||||||||||||||||||||||||||||||||||||||||||||||||||||||||||||||||||||||||||||||||||||||||||||||||||||||||||||||||||||||||||||||||||||||||||||||||||||||||||||||||||||||||||||||||||||||||||||||||||||||||
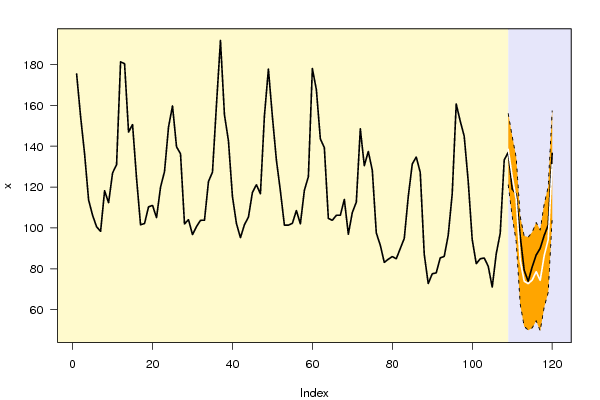
| 175.348 154.439 136.186 113.662 106.157 100.546 98.314 118.179 112.295 126.938 130.92 181.279 180.389 146.917 150.597 124.222 101.554 102.138 110.315 111.015 105.017 119.888 127.623 149.415 159.755 139.737 136.283 101.952 104.044 96.712 100.665 103.699 103.765 122.732 127.297 160.278 191.784 155.375 142.616 115.331 102.136 95.205 101.566 105.273 117.394 121.148 116.666 154.841 177.74 154.427 133.159 118.102 101.361 101.345 102.233 108.522 101.939 118.405 125.06 178 167.714 143.582 139.259 104.674 103.722 106.153 106.21 113.986 96.906 107.512 112.616 148.507 130.48 137.436 128.21 97.552 91.55 83.104 84.68 85.98 84.891 89.896 94.835 115.348 131.284 134.701 127.193 87.077 72.744 77.542 78.005 85.329 86.041 96.384 116.678 160.672 152.364 144.936 122.974 94.456 82.491 84.89 85.277 81.206 71.012 87.302 97.427 133.242 137.064 119.042 116.47 96.028 79.281 73.872 80.964 86.739 89.997 96.292 101.355 13 etc... | |||||||||||||||||||||||||||||||||||||||||||||||||||||||||||||||||||||||||||||||||||||||||||||||||||||||||||||||||||||||||||||||||||||||||||||||||||||||||||||||||||||||||||||||||||||||||||||||||||||||||||||||||||||||||||||||||||||||||||||||||||||||||||||||||||||||||||||||||||||||||||||||||||||||||||||||||||||||||||||||||||||||||||||||||||||||||||||||
| Output produced by software: | |||||||||||||||||||||||||||||||||||||||||||||||||||||||||||||||||||||||||||||||||||||||||||||||||||||||||||||||||||||||||||||||||||||||||||||||||||||||||||||||||||||||||||||||||||||||||||||||||||||||||||||||||||||||||||||||||||||||||||||||||||||||||||||||||||||||||||||||||||||||||||||||||||||||||||||||||||||||||||||||||||||||||||||||||||||||||||||||
| |||||||||||||||||||||||||||||||||||||||||||||||||||||||||||||||||||||||||||||||||||||||||||||||||||||||||||||||||||||||||||||||||||||||||||||||||||||||||||||||||||||||||||||||||||||||||||||||||||||||||||||||||||||||||||||||||||||||||||||||||||||||||||||||||||||||||||||||||||||||||||||||||||||||||||||||||||||||||||||||||||||||||||||||||||||||||||||||
| Charts produced by software: | |||||||||||||||||||||||||||||||||||||||||||||||||||||||||||||||||||||||||||||||||||||||||||||||||||||||||||||||||||||||||||||||||||||||||||||||||||||||||||||||||||||||||||||||||||||||||||||||||||||||||||||||||||||||||||||||||||||||||||||||||||||||||||||||||||||||||||||||||||||||||||||||||||||||||||||||||||||||||||||||||||||||||||||||||||||||||||||||
| |||||||||||||||||||||||||||||||||||||||||||||||||||||||||||||||||||||||||||||||||||||||||||||||||||||||||||||||||||||||||||||||||||||||||||||||||||||||||||||||||||||||||||||||||||||||||||||||||||||||||||||||||||||||||||||||||||||||||||||||||||||||||||||||||||||||||||||||||||||||||||||||||||||||||||||||||||||||||||||||||||||||||||||||||||||||||||||||
| Parameters (Session): | |||||||||||||||||||||||||||||||||||||||||||||||||||||||||||||||||||||||||||||||||||||||||||||||||||||||||||||||||||||||||||||||||||||||||||||||||||||||||||||||||||||||||||||||||||||||||||||||||||||||||||||||||||||||||||||||||||||||||||||||||||||||||||||||||||||||||||||||||||||||||||||||||||||||||||||||||||||||||||||||||||||||||||||||||||||||||||||||
| par1 = 12 ; par2 = 1 ; par3 = 1 ; par4 = 1 ; par5 = 12 ; par6 = 1 ; par7 = 1 ; par8 = 0 ; par9 = 1 ; par10 = FALSE ; | |||||||||||||||||||||||||||||||||||||||||||||||||||||||||||||||||||||||||||||||||||||||||||||||||||||||||||||||||||||||||||||||||||||||||||||||||||||||||||||||||||||||||||||||||||||||||||||||||||||||||||||||||||||||||||||||||||||||||||||||||||||||||||||||||||||||||||||||||||||||||||||||||||||||||||||||||||||||||||||||||||||||||||||||||||||||||||||||
| Parameters (R input): | |||||||||||||||||||||||||||||||||||||||||||||||||||||||||||||||||||||||||||||||||||||||||||||||||||||||||||||||||||||||||||||||||||||||||||||||||||||||||||||||||||||||||||||||||||||||||||||||||||||||||||||||||||||||||||||||||||||||||||||||||||||||||||||||||||||||||||||||||||||||||||||||||||||||||||||||||||||||||||||||||||||||||||||||||||||||||||||||
| par1 = 12 ; par2 = 1 ; par3 = 1 ; par4 = 1 ; par5 = 12 ; par6 = 1 ; par7 = 1 ; par8 = 0 ; par9 = 1 ; par10 = FALSE ; | |||||||||||||||||||||||||||||||||||||||||||||||||||||||||||||||||||||||||||||||||||||||||||||||||||||||||||||||||||||||||||||||||||||||||||||||||||||||||||||||||||||||||||||||||||||||||||||||||||||||||||||||||||||||||||||||||||||||||||||||||||||||||||||||||||||||||||||||||||||||||||||||||||||||||||||||||||||||||||||||||||||||||||||||||||||||||||||||
| R code (references can be found in the software module): | |||||||||||||||||||||||||||||||||||||||||||||||||||||||||||||||||||||||||||||||||||||||||||||||||||||||||||||||||||||||||||||||||||||||||||||||||||||||||||||||||||||||||||||||||||||||||||||||||||||||||||||||||||||||||||||||||||||||||||||||||||||||||||||||||||||||||||||||||||||||||||||||||||||||||||||||||||||||||||||||||||||||||||||||||||||||||||||||
| par1 <- as.numeric(par1) #cut off periods
par2 <- as.numeric(par2) #lambda par3 <- as.numeric(par3) #degree of non-seasonal differencing par4 <- as.numeric(par4) #degree of seasonal differencing par5 <- as.numeric(par5) #seasonal period par6 <- as.numeric(par6) #p par7 <- as.numeric(par7) #q par8 <- as.numeric(par8) #P par9 <- as.numeric(par9) #Q if (par10 == 'TRUE') par10 <- TRUE if (par10 == 'FALSE') par10 <- FALSE if (par2 == 0) x <- log(x) if (par2 != 0) x <- x^par2 lx <- length(x) first <- lx - 2*par1 nx <- lx - par1 nx1 <- nx + 1 fx <- lx - nx if (fx < 1) { fx <- par5 nx1 <- lx + fx - 1 first <- lx - 2*fx } first <- 1 if (fx < 3) fx <- round(lx/10,0) (arima.out <- arima(x[1:nx], order=c(par6,par3,par7), seasonal=list(order=c(par8,par4,par9), period=par5), include.mean=par10, method='ML')) (forecast <- predict(arima.out,par1)) (lb <- forecast$pred - 1.96 * forecast$se) (ub <- forecast$pred + 1.96 * forecast$se) if (par2 == 0) { x <- exp(x) forecast$pred <- exp(forecast$pred) lb <- exp(lb) ub <- exp(ub) } if (par2 != 0) { x <- x^(1/par2) forecast$pred <- forecast$pred^(1/par2) lb <- lb^(1/par2) ub <- ub^(1/par2) } if (par2 < 0) { olb <- lb lb <- ub ub <- olb } (actandfor <- c(x[1:nx], forecast$pred)) (perc.se <- (ub-forecast$pred)/1.96/forecast$pred) bitmap(file='test1.png') opar <- par(mar=c(4,4,2,2),las=1) ylim <- c( min(x[first:nx],lb), max(x[first:nx],ub)) plot(x,ylim=ylim,type='n',xlim=c(first,lx)) usr <- par('usr') rect(usr[1],usr[3],nx+1,usr[4],border=NA,col='lemonchiffon') rect(nx1,usr[3],usr[2],usr[4],border=NA,col='lavender') abline(h= (-3:3)*2 , col ='gray', lty =3) polygon( c(nx1:lx,lx:nx1), c(lb,rev(ub)), col = 'orange', lty=2,border=NA) lines(nx1:lx, lb , lty=2) lines(nx1:lx, ub , lty=2) lines(x, lwd=2) lines(nx1:lx, forecast$pred , lwd=2 , col ='white') box() par(opar) dev.off() prob.dec <- array(NA, dim=fx) prob.sdec <- array(NA, dim=fx) prob.ldec <- array(NA, dim=fx) prob.pval <- array(NA, dim=fx) perf.pe <- array(0, dim=fx) perf.mape <- array(0, dim=fx) perf.mape1 <- array(0, dim=fx) perf.se <- array(0, dim=fx) perf.mse <- array(0, dim=fx) perf.mse1 <- array(0, dim=fx) perf.rmse <- array(0, dim=fx) for (i in 1:fx) { locSD <- (ub[i] - forecast$pred[i]) / 1.96 perf.pe[i] = (x[nx+i] - forecast$pred[i]) / forecast$pred[i] perf.se[i] = (x[nx+i] - forecast$pred[i])^2 prob.dec[i] = pnorm((x[nx+i-1] - forecast$pred[i]) / locSD) prob.sdec[i] = pnorm((x[nx+i-par5] - forecast$pred[i]) / locSD) prob.ldec[i] = pnorm((x[nx] - forecast$pred[i]) / locSD) prob.pval[i] = pnorm(abs(x[nx+i] - forecast$pred[i]) / locSD) } perf.mape[1] = abs(perf.pe[1]) perf.mse[1] = abs(perf.se[1]) for (i in 2:fx) { perf.mape[i] = perf.mape[i-1] + abs(perf.pe[i]) perf.mape1[i] = perf.mape[i] / i perf.mse[i] = perf.mse[i-1] + perf.se[i] perf.mse1[i] = perf.mse[i] / i } perf.rmse = sqrt(perf.mse1) bitmap(file='test2.png') plot(forecast$pred, pch=19, type='b',main='ARIMA Extrapolation Forecast', ylab='Forecast and 95% CI', xlab='time',ylim=c(min(lb),max(ub))) dum <- forecast$pred dum[1:par1] <- x[(nx+1):lx] lines(dum, lty=1) lines(ub,lty=3) lines(lb,lty=3) dev.off() load(file='createtable') a<-table.start() a<-table.row.start(a) a<-table.element(a,'Univariate ARIMA Extrapolation Forecast',9,TRUE) a<-table.row.end(a) a<-table.row.start(a) a<-table.element(a,'time',1,header=TRUE) a<-table.element(a,'Y[t]',1,header=TRUE) a<-table.element(a,'F[t]',1,header=TRUE) a<-table.element(a,'95% LB',1,header=TRUE) a<-table.element(a,'95% UB',1,header=TRUE) a<-table.element(a,'p-value<br />(H0: Y[t] = F[t])',1,header=TRUE) a<-table.element(a,'P(F[t]>Y[t-1])',1,header=TRUE) a<-table.element(a,'P(F[t]>Y[t-s])',1,header=TRUE) mylab <- paste('P(F[t]>Y[',nx,sep='') mylab <- paste(mylab,'])',sep='') a<-table.element(a,mylab,1,header=TRUE) a<-table.row.end(a) for (i in (nx-par5):nx) { a<-table.row.start(a) a<-table.element(a,i,header=TRUE) a<-table.element(a,x[i]) a<-table.element(a,'-') a<-table.element(a,'-') a<-table.element(a,'-') a<-table.element(a,'-') a<-table.element(a,'-') a<-table.element(a,'-') a<-table.element(a,'-') a<-table.row.end(a) } for (i in 1:fx) { a<-table.row.start(a) a<-table.element(a,nx+i,header=TRUE) a<-table.element(a,round(x[nx+i],4)) a<-table.element(a,round(forecast$pred[i],4)) a<-table.element(a,round(lb[i],4)) a<-table.element(a,round(ub[i],4)) a<-table.element(a,round((1-prob.pval[i]),4)) a<-table.element(a,round((1-prob.dec[i]),4)) a<-table.element(a,round((1-prob.sdec[i]),4)) a<-table.element(a,round((1-prob.ldec[i]),4)) a<-table.row.end(a) } a<-table.end(a) table.save(a,file='mytable.tab') a<-table.start() a<-table.row.start(a) a<-table.element(a,'Univariate ARIMA Extrapolation Forecast Performance',7,TRUE) a<-table.row.end(a) a<-table.row.start(a) a<-table.element(a,'time',1,header=TRUE) a<-table.element(a,'% S.E.',1,header=TRUE) a<-table.element(a,'PE',1,header=TRUE) a<-table.element(a,'MAPE',1,header=TRUE) a<-table.element(a,'Sq.E',1,header=TRUE) a<-table.element(a,'MSE',1,header=TRUE) a<-table.element(a,'RMSE',1,header=TRUE) a<-table.row.end(a) for (i in 1:fx) { a<-table.row.start(a) a<-table.element(a,nx+i,header=TRUE) a<-table.element(a,round(perc.se[i],4)) a<-table.element(a,round(perf.pe[i],4)) a<-table.element(a,round(perf.mape1[i],4)) a<-table.element(a,round(perf.se[i],4)) a<-table.element(a,round(perf.mse1[i],4)) a<-table.element(a,round(perf.rmse[i],4)) a<-table.row.end(a) } a<-table.end(a) table.save(a,file='mytable1.tab') | |||||||||||||||||||||||||||||||||||||||||||||||||||||||||||||||||||||||||||||||||||||||||||||||||||||||||||||||||||||||||||||||||||||||||||||||||||||||||||||||||||||||||||||||||||||||||||||||||||||||||||||||||||||||||||||||||||||||||||||||||||||||||||||||||||||||||||||||||||||||||||||||||||||||||||||||||||||||||||||||||||||||||||||||||||||||||||||||

Copyright

This work is licensed under a
Creative Commons Attribution-Noncommercial-Share Alike 3.0 License.
Software written by Ed van Stee & Patrick Wessa
Disclaimer
Information provided on this web site is provided "AS IS" without warranty of any kind, either express or implied, including, without limitation, warranties of merchantability, fitness for a particular purpose, and noninfringement. We use reasonable efforts to include accurate and timely information and periodically update the information, and software without notice. However, we make no warranties or representations as to the accuracy or completeness of such information (or software), and we assume no liability or responsibility for errors or omissions in the content of this web site, or any software bugs in online applications. Your use of this web site is AT YOUR OWN RISK. Under no circumstances and under no legal theory shall we be liable to you or any other person for any direct, indirect, special, incidental, exemplary, or consequential damages arising from your access to, or use of, this web site.
Privacy Policy
We may request personal information to be submitted to our servers in order to be able to:
- personalize online software applications according to your needs
- enforce strict security rules with respect to the data that you upload (e.g. statistical data)
- manage user sessions of online applications
- alert you about important changes or upgrades in resources or applications
We NEVER allow other companies to directly offer registered users information about their products and services. Banner references and hyperlinks of third parties NEVER contain any personal data of the visitor.
We do NOT sell, nor transmit by any means, personal information, nor statistical data series uploaded by you to third parties.
We carefully protect your data from loss, misuse, alteration,
and destruction. However, at any time, and under any circumstance you
are solely responsible for managing your passwords, and keeping them
secret.
We store a unique ANONYMOUS USER ID in the form of a small 'Cookie' on your computer. This allows us to track your progress when using this website which is necessary to create state-dependent features. The cookie is used for NO OTHER PURPOSE. At any time you may opt to disallow cookies from this website - this will not affect other features of this website.
We examine cookies that are used by third-parties (banner and online ads) very closely: abuse from third-parties automatically results in termination of the advertising contract without refund. We have very good reason to believe that the cookies that are produced by third parties (banner ads) do NOT cause any privacy or security risk.
FreeStatistics.org is safe. There is no need to download any software to use the applications and services contained in this website. Hence, your system's security is not compromised by their use, and your personal data - other than data you submit in the account application form, and the user-agent information that is transmitted by your browser - is never transmitted to our servers.
As a general rule, we do not log on-line behavior of individuals (other than normal logging of webserver 'hits'). However, in cases of abuse, hacking, unauthorized access, Denial of Service attacks, illegal copying, hotlinking, non-compliance with international webstandards (such as robots.txt), or any other harmful behavior, our system engineers are empowered to log, track, identify, publish, and ban misbehaving individuals - even if this leads to ban entire blocks of IP addresses, or disclosing user's identity.