Free Statistics
of Irreproducible Research!
Description of Statistical Computation | |||||||||||||||||||||||||||||||||||||||||||||||||||||||||||||||||||||||||||||||||||||||||||||||||||||||||||||||||||||||||
|---|---|---|---|---|---|---|---|---|---|---|---|---|---|---|---|---|---|---|---|---|---|---|---|---|---|---|---|---|---|---|---|---|---|---|---|---|---|---|---|---|---|---|---|---|---|---|---|---|---|---|---|---|---|---|---|---|---|---|---|---|---|---|---|---|---|---|---|---|---|---|---|---|---|---|---|---|---|---|---|---|---|---|---|---|---|---|---|---|---|---|---|---|---|---|---|---|---|---|---|---|---|---|---|---|---|---|---|---|---|---|---|---|---|---|---|---|---|---|---|---|---|
| Author's title | |||||||||||||||||||||||||||||||||||||||||||||||||||||||||||||||||||||||||||||||||||||||||||||||||||||||||||||||||||||||||
| Author | *The author of this computation has been verified* | ||||||||||||||||||||||||||||||||||||||||||||||||||||||||||||||||||||||||||||||||||||||||||||||||||||||||||||||||||||||||
| R Software Module | rwasp_notchedbox1.wasp | ||||||||||||||||||||||||||||||||||||||||||||||||||||||||||||||||||||||||||||||||||||||||||||||||||||||||||||||||||||||||
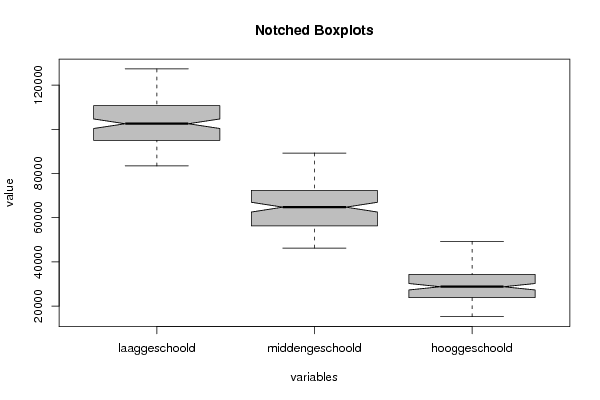
| Title produced by software | Notched Boxplots | ||||||||||||||||||||||||||||||||||||||||||||||||||||||||||||||||||||||||||||||||||||||||||||||||||||||||||||||||||||||||
| Date of computation | Tue, 21 Dec 2010 17:52:26 +0000 | ||||||||||||||||||||||||||||||||||||||||||||||||||||||||||||||||||||||||||||||||||||||||||||||||||||||||||||||||||||||||
| Cite this page as follows | Statistical Computations at FreeStatistics.org, Office for Research Development and Education, URL https://freestatistics.org/blog/index.php?v=date/2010/Dec/21/t1292953851dfp142003joy6a5.htm/, Retrieved Mon, 27 Jul 2026 23:41:24 +0000 | ||||||||||||||||||||||||||||||||||||||||||||||||||||||||||||||||||||||||||||||||||||||||||||||||||||||||||||||||||||||||
| Statistical Computations at FreeStatistics.org, Office for Research Development and Education, URL https://freestatistics.org/blog/index.php?pk=113786, Retrieved Mon, 27 Jul 2026 23:41:24 +0000 | |||||||||||||||||||||||||||||||||||||||||||||||||||||||||||||||||||||||||||||||||||||||||||||||||||||||||||||||||||||||||
| QR Codes: | |||||||||||||||||||||||||||||||||||||||||||||||||||||||||||||||||||||||||||||||||||||||||||||||||||||||||||||||||||||||||
|
| |||||||||||||||||||||||||||||||||||||||||||||||||||||||||||||||||||||||||||||||||||||||||||||||||||||||||||||||||||||||||
| Original text written by user: | |||||||||||||||||||||||||||||||||||||||||||||||||||||||||||||||||||||||||||||||||||||||||||||||||||||||||||||||||||||||||
| IsPrivate? | No (this computation is public) | ||||||||||||||||||||||||||||||||||||||||||||||||||||||||||||||||||||||||||||||||||||||||||||||||||||||||||||||||||||||||
| User-defined keywords | |||||||||||||||||||||||||||||||||||||||||||||||||||||||||||||||||||||||||||||||||||||||||||||||||||||||||||||||||||||||||
| Estimated Impact | 482 | ||||||||||||||||||||||||||||||||||||||||||||||||||||||||||||||||||||||||||||||||||||||||||||||||||||||||||||||||||||||||
Tree of Dependent Computations | |||||||||||||||||||||||||||||||||||||||||||||||||||||||||||||||||||||||||||||||||||||||||||||||||||||||||||||||||||||||||
| Family? (F = Feedback message, R = changed R code, M = changed R Module, P = changed Parameters, D = changed Data) | |||||||||||||||||||||||||||||||||||||||||||||||||||||||||||||||||||||||||||||||||||||||||||||||||||||||||||||||||||||||||
| - [Notched Boxplots] [Screen Width and ...] [2010-09-25 10:03:47] [b98453cac15ba1066b407e146608df68] - D [Notched Boxplots] [Notched Boxplot -...] [2010-10-04 18:20:59] [8214fe6d084e5ad7598b249a26cc9f06] - D [Notched Boxplots] [notched boxplots] [2010-12-21 17:52:26] [b47314d83d48c7bf812ec2bcd743b159] [Current] | |||||||||||||||||||||||||||||||||||||||||||||||||||||||||||||||||||||||||||||||||||||||||||||||||||||||||||||||||||||||||
| Feedback Forum | |||||||||||||||||||||||||||||||||||||||||||||||||||||||||||||||||||||||||||||||||||||||||||||||||||||||||||||||||||||||||
Post a new message | |||||||||||||||||||||||||||||||||||||||||||||||||||||||||||||||||||||||||||||||||||||||||||||||||||||||||||||||||||||||||
Dataset | |||||||||||||||||||||||||||||||||||||||||||||||||||||||||||||||||||||||||||||||||||||||||||||||||||||||||||||||||||||||||
| Dataseries X: | |||||||||||||||||||||||||||||||||||||||||||||||||||||||||||||||||||||||||||||||||||||||||||||||||||||||||||||||||||||||||
104708 56190 19246 101817 54300 17549 97898 51362 16428 95559 49802 16209 92822 48088 15235 90848 46696 16186 101141 56586 24971 105841 64148 30776 93647 56449 26416 90923 52538 23157 89130 49359 20155 90212 49583 19790 93196 51050 18849 91861 49610 17573 90593 48321 16597 89895 47692 16158 88819 46243 15507 87924 46248 16433 96906 56381 26325 101217 62329 31144 98709 60673 30535 98139 58393 27596 95529 55742 24064 98577 57135 23854 100772 57961 22407 100180 56571 21125 99200 55615 20226 96251 53494 19547 94514 52623 18933 93780 52820 20372 105192 66825 34331 107682 70695 37329 99687 65660 36761 99436 63238 32737 102049 61741 29321 102673 63642 28883 105813 65521 27436 105056 64006 25101 103916 62728 23776 103513 62438 23782 101893 61109 23027 102503 63422 25606 113149 78094 41328 116696 82030 44751 108500 75892 42855 107800 72431 37628 105941 69194 33544 108742 71171 33275 111680 72545 32009 111270 71503 30813 110698 69624 29143 108517 67407 28121 107127 66103 27007 107088 67466 29112 116321 81088 44067 125045 86781 48481 116779 79964 46581 122887 80407 41166 120162 76589 36824 123198 78083 35936 123610 78000 33633 122293 76431 31630 121289 75461 30434 119393 73739 28546 117494 71988 27660 116693 72929 29830 125062 85785 45599 127281 89261 49303 120195 84012 44417 119804 80924 40386 117113 76588 35544 119240 77546 35019 115823 73054 30400 116281 73430 29602 113816 71093 27701 114632 72202 27937 112987 70872 27283 111633 70452 29372 116721 80506 42821 114850 80400 45386 112797 77613 40170 105368 69056 34371 102524 65321 30077 101327 64018 29251 102612 64767 27202 98873 61099 25714 95993 58329 23784 93244 56396 22968 90403 54656 22243 88539 55259 24255 98106 66912 37282 96963 66631 38794 90781 59907 31828 89253 56274 27949 87794 54045 24605 89810 55792 25695 90864 55499 23338 89025 53216 21941 87621 52259 22034 87718 51257 20637 83433 48150 19418 84535 51125 22454 92223 61046 33261 91052 61022 34995 88456 56742 29132 88706 54485 26171 89137 53862 23828 94066 58228 25743 99258 61951 25204 100673 62874 25679 102269 64013 25281 100833 62937 25136 99314 61897 24794 101764 65267 28278 108242 75228 40062 108148 76161 42590 104761 71480 37885 103772 69070 34061 103737 68293 32412 111043 74685 34647 109906 72664 31750 109335 71965 31288 107247 69238 29331 105690 67738 28768 102755 65187 27780 102280 66170 30113 110590 77309 41240 109122 77134 43271 102803 70957 38108 101424 67749 34382 99138 65081 31551 | |||||||||||||||||||||||||||||||||||||||||||||||||||||||||||||||||||||||||||||||||||||||||||||||||||||||||||||||||||||||||
Tables (Output of Computation) | |||||||||||||||||||||||||||||||||||||||||||||||||||||||||||||||||||||||||||||||||||||||||||||||||||||||||||||||||||||||||
| |||||||||||||||||||||||||||||||||||||||||||||||||||||||||||||||||||||||||||||||||||||||||||||||||||||||||||||||||||||||||
Figures (Output of Computation) | |||||||||||||||||||||||||||||||||||||||||||||||||||||||||||||||||||||||||||||||||||||||||||||||||||||||||||||||||||||||||
Input Parameters & R Code | |||||||||||||||||||||||||||||||||||||||||||||||||||||||||||||||||||||||||||||||||||||||||||||||||||||||||||||||||||||||||
| Parameters (Session): | |||||||||||||||||||||||||||||||||||||||||||||||||||||||||||||||||||||||||||||||||||||||||||||||||||||||||||||||||||||||||
| par1 = grey ; | |||||||||||||||||||||||||||||||||||||||||||||||||||||||||||||||||||||||||||||||||||||||||||||||||||||||||||||||||||||||||
| Parameters (R input): | |||||||||||||||||||||||||||||||||||||||||||||||||||||||||||||||||||||||||||||||||||||||||||||||||||||||||||||||||||||||||
| par1 = grey ; | |||||||||||||||||||||||||||||||||||||||||||||||||||||||||||||||||||||||||||||||||||||||||||||||||||||||||||||||||||||||||
| R code (references can be found in the software module): | |||||||||||||||||||||||||||||||||||||||||||||||||||||||||||||||||||||||||||||||||||||||||||||||||||||||||||||||||||||||||
z <- as.data.frame(t(y)) | |||||||||||||||||||||||||||||||||||||||||||||||||||||||||||||||||||||||||||||||||||||||||||||||||||||||||||||||||||||||||