Free Statistics

of Irreproducible Research!

Author's title

Author*The author of this computation has been verified*
R Software Modulerwasp_autocorrelation.wasp
Title produced by software(Partial) Autocorrelation Function
Date of computationTue, 21 Dec 2010 16:03:06 +0000
Cite this page as followsStatistical Computations at FreeStatistics.org, Office for Research Development and Education, URL https://freestatistics.org/blog/index.php?v=date/2010/Dec/21/t1292947262v8yi29k770pels9.htm/, Retrieved Sat, 18 May 2024 20:17:42 +0000
Statistical Computations at FreeStatistics.org, Office for Research Development and Education, URL https://freestatistics.org/blog/index.php?pk=113709, Retrieved Sat, 18 May 2024 20:17:42 +0000
QR Codes:

Original text written by user:
IsPrivate?No (this computation is public)
User-defined keywords
Estimated Impact140
Family? (F = Feedback message, R = changed R code, M = changed R Module, P = changed Parameters, D = changed Data)
-     [Univariate Data Series] [data set] [2008-12-01 19:54:57] [b98453cac15ba1066b407e146608df68]
- RMP   [(Partial) Autocorrelation Function] [WS8 Autocorolation] [2010-12-01 09:55:45] [b84bdc9bd81e1f02ca0dcc4710c1b790]
-   PD      [(Partial) Autocorrelation Function] [ACF] [2010-12-21 16:03:06] [a8abc7260f3c847aeac0a796e7895a2e] [Current]
Feedback Forum

Post a new message
Dataseries X:
143827
145191
146832
148577
149873
151847
153252
154292
155657
156523
156416
156693
160312
160438
160882
161668
164391
168556
169738
170387
171294
172202
172651
172770
178366
180014
181067
182586
184957
186417
188599
189490
190264
191221
191110
190674
195438
196393
197172
198760
200945
203845
204613
205487
206100
206315
206291
207801
211653
211325
211893
212056
214696
217455
218884
219816
219984
219062
218550
218179
222218
222196
223393
223292
226236
228831
228745
229140
229270
229359
230006
228810
232677
232961
234629
235660
240024
243554
244368
244356
245126
246321
246797
246735
251083
251786
252732
255051
259022
261698
263891
265247
262228
263429
264305
266371
273248
275472
278146
279506
283991
286794
288703
289285
288869
286942
285833
284095
289229
289389
290793
291454
294733
293853
294056
293982
293075
292391


Summary of computational transaction
Raw Inputview raw input (R code)
Raw Outputview raw output of R engine
Computing time1 seconds
R Server'Gwilym Jenkins' @ 72.249.127.135

\begin{tabular}{lllllllll}
\hline
Summary of computational transaction \tabularnewline
Raw Input & view raw input (R code)  \tabularnewline
Raw Output & view raw output of R engine  \tabularnewline
Computing time & 1 seconds \tabularnewline
R Server & 'Gwilym Jenkins' @ 72.249.127.135 \tabularnewline
\hline
\end{tabular}
%Source: https://freestatistics.org/blog/index.php?pk=113709&T=0

[TABLE]
[ROW][C]Summary of computational transaction[/C][/ROW]
[ROW][C]Raw Input[/C][C]view raw input (R code) [/C][/ROW]
[ROW][C]Raw Output[/C][C]view raw output of R engine [/C][/ROW]
[ROW][C]Computing time[/C][C]1 seconds[/C][/ROW]
[ROW][C]R Server[/C][C]'Gwilym Jenkins' @ 72.249.127.135[/C][/ROW]
[/TABLE]
Source: https://freestatistics.org/blog/index.php?pk=113709&T=0

Globally Unique Identifier (entire table): ba.freestatistics.org/blog/index.php?pk=113709&T=0

As an alternative you can also use a QR Code:  

The GUIDs for individual cells are displayed in the table below:

Summary of computational transaction
Raw Inputview raw input (R code)
Raw Outputview raw output of R engine
Computing time1 seconds
R Server'Gwilym Jenkins' @ 72.249.127.135


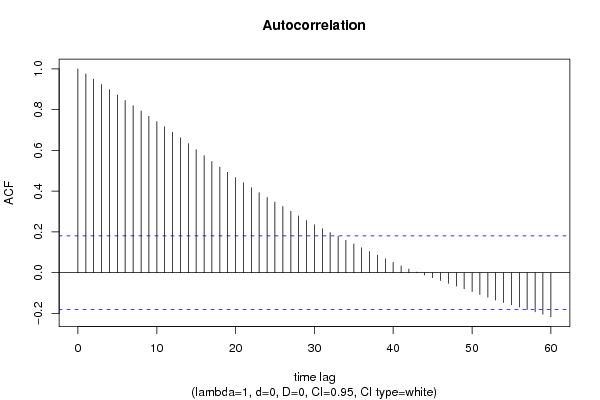
Autocorrelation Function
Time lag kACF(k)T-STATP-value
10.97538810.59540
20.95007810.32050
30.92418610.03920
40.8981999.75690
50.8719019.47130
60.8453179.18250
70.8195848.9030
80.7936188.62090
90.7677358.33970
100.7415688.05550
110.7161757.77960
120.6895337.49020
130.6621717.1930
140.6334436.88090
150.6039756.56080
160.5743436.2390
170.5455275.92590
180.5183715.63090
190.4925525.35050
200.4666985.06961e-06
210.441324.7942e-06
220.4163154.52237e-06
230.3928864.26782e-05
240.3694144.01295.3e-05
250.346793.76710.00013
260.3245223.52520.000302
270.3011543.27140.000702
280.2783293.02340.001533
290.2563622.78480.003121
300.2352572.55550.005936
310.2157662.34380.01038
320.196742.13710.017325
330.1777731.93110.027934
340.158941.72650.043435
350.1408411.52990.064356
360.121981.3250.093859
370.1037671.12720.130973
380.08580.9320.176614
390.0678720.73730.23121
400.0502080.54540.293255
410.0330060.35850.360293
420.0174650.18970.424927
430.0031990.03480.486168
44-0.010929-0.11870.452851
45-0.024782-0.26920.394122
46-0.038832-0.42180.336959
47-0.05219-0.56690.285921
48-0.065901-0.71590.237744
49-0.07908-0.8590.196033
50-0.092766-1.00770.157831
51-0.106642-1.15840.124514
52-0.120618-1.31020.096329
53-0.13423-1.45810.073733
54-0.146492-1.59130.057108
55-0.157685-1.71290.044679
56-0.169005-1.83590.034447
57-0.180297-1.95850.026264
58-0.192329-2.08920.019418
59-0.203747-2.21330.014401
60-0.215876-2.3450.010348

\begin{tabular}{lllllllll}
\hline
Autocorrelation Function \tabularnewline
Time lag k & ACF(k) & T-STAT & P-value \tabularnewline
1 & 0.975388 & 10.5954 & 0 \tabularnewline
2 & 0.950078 & 10.3205 & 0 \tabularnewline
3 & 0.924186 & 10.0392 & 0 \tabularnewline
4 & 0.898199 & 9.7569 & 0 \tabularnewline
5 & 0.871901 & 9.4713 & 0 \tabularnewline
6 & 0.845317 & 9.1825 & 0 \tabularnewline
7 & 0.819584 & 8.903 & 0 \tabularnewline
8 & 0.793618 & 8.6209 & 0 \tabularnewline
9 & 0.767735 & 8.3397 & 0 \tabularnewline
10 & 0.741568 & 8.0555 & 0 \tabularnewline
11 & 0.716175 & 7.7796 & 0 \tabularnewline
12 & 0.689533 & 7.4902 & 0 \tabularnewline
13 & 0.662171 & 7.193 & 0 \tabularnewline
14 & 0.633443 & 6.8809 & 0 \tabularnewline
15 & 0.603975 & 6.5608 & 0 \tabularnewline
16 & 0.574343 & 6.239 & 0 \tabularnewline
17 & 0.545527 & 5.9259 & 0 \tabularnewline
18 & 0.518371 & 5.6309 & 0 \tabularnewline
19 & 0.492552 & 5.3505 & 0 \tabularnewline
20 & 0.466698 & 5.0696 & 1e-06 \tabularnewline
21 & 0.44132 & 4.794 & 2e-06 \tabularnewline
22 & 0.416315 & 4.5223 & 7e-06 \tabularnewline
23 & 0.392886 & 4.2678 & 2e-05 \tabularnewline
24 & 0.369414 & 4.0129 & 5.3e-05 \tabularnewline
25 & 0.34679 & 3.7671 & 0.00013 \tabularnewline
26 & 0.324522 & 3.5252 & 0.000302 \tabularnewline
27 & 0.301154 & 3.2714 & 0.000702 \tabularnewline
28 & 0.278329 & 3.0234 & 0.001533 \tabularnewline
29 & 0.256362 & 2.7848 & 0.003121 \tabularnewline
30 & 0.235257 & 2.5555 & 0.005936 \tabularnewline
31 & 0.215766 & 2.3438 & 0.01038 \tabularnewline
32 & 0.19674 & 2.1371 & 0.017325 \tabularnewline
33 & 0.177773 & 1.9311 & 0.027934 \tabularnewline
34 & 0.15894 & 1.7265 & 0.043435 \tabularnewline
35 & 0.140841 & 1.5299 & 0.064356 \tabularnewline
36 & 0.12198 & 1.325 & 0.093859 \tabularnewline
37 & 0.103767 & 1.1272 & 0.130973 \tabularnewline
38 & 0.0858 & 0.932 & 0.176614 \tabularnewline
39 & 0.067872 & 0.7373 & 0.23121 \tabularnewline
40 & 0.050208 & 0.5454 & 0.293255 \tabularnewline
41 & 0.033006 & 0.3585 & 0.360293 \tabularnewline
42 & 0.017465 & 0.1897 & 0.424927 \tabularnewline
43 & 0.003199 & 0.0348 & 0.486168 \tabularnewline
44 & -0.010929 & -0.1187 & 0.452851 \tabularnewline
45 & -0.024782 & -0.2692 & 0.394122 \tabularnewline
46 & -0.038832 & -0.4218 & 0.336959 \tabularnewline
47 & -0.05219 & -0.5669 & 0.285921 \tabularnewline
48 & -0.065901 & -0.7159 & 0.237744 \tabularnewline
49 & -0.07908 & -0.859 & 0.196033 \tabularnewline
50 & -0.092766 & -1.0077 & 0.157831 \tabularnewline
51 & -0.106642 & -1.1584 & 0.124514 \tabularnewline
52 & -0.120618 & -1.3102 & 0.096329 \tabularnewline
53 & -0.13423 & -1.4581 & 0.073733 \tabularnewline
54 & -0.146492 & -1.5913 & 0.057108 \tabularnewline
55 & -0.157685 & -1.7129 & 0.044679 \tabularnewline
56 & -0.169005 & -1.8359 & 0.034447 \tabularnewline
57 & -0.180297 & -1.9585 & 0.026264 \tabularnewline
58 & -0.192329 & -2.0892 & 0.019418 \tabularnewline
59 & -0.203747 & -2.2133 & 0.014401 \tabularnewline
60 & -0.215876 & -2.345 & 0.010348 \tabularnewline
\hline
\end{tabular}
%Source: https://freestatistics.org/blog/index.php?pk=113709&T=1

[TABLE]
[ROW][C]Autocorrelation Function[/C][/ROW]
[ROW][C]Time lag k[/C][C]ACF(k)[/C][C]T-STAT[/C][C]P-value[/C][/ROW]
[ROW][C]1[/C][C]0.975388[/C][C]10.5954[/C][C]0[/C][/ROW]
[ROW][C]2[/C][C]0.950078[/C][C]10.3205[/C][C]0[/C][/ROW]
[ROW][C]3[/C][C]0.924186[/C][C]10.0392[/C][C]0[/C][/ROW]
[ROW][C]4[/C][C]0.898199[/C][C]9.7569[/C][C]0[/C][/ROW]
[ROW][C]5[/C][C]0.871901[/C][C]9.4713[/C][C]0[/C][/ROW]
[ROW][C]6[/C][C]0.845317[/C][C]9.1825[/C][C]0[/C][/ROW]
[ROW][C]7[/C][C]0.819584[/C][C]8.903[/C][C]0[/C][/ROW]
[ROW][C]8[/C][C]0.793618[/C][C]8.6209[/C][C]0[/C][/ROW]
[ROW][C]9[/C][C]0.767735[/C][C]8.3397[/C][C]0[/C][/ROW]
[ROW][C]10[/C][C]0.741568[/C][C]8.0555[/C][C]0[/C][/ROW]
[ROW][C]11[/C][C]0.716175[/C][C]7.7796[/C][C]0[/C][/ROW]
[ROW][C]12[/C][C]0.689533[/C][C]7.4902[/C][C]0[/C][/ROW]
[ROW][C]13[/C][C]0.662171[/C][C]7.193[/C][C]0[/C][/ROW]
[ROW][C]14[/C][C]0.633443[/C][C]6.8809[/C][C]0[/C][/ROW]
[ROW][C]15[/C][C]0.603975[/C][C]6.5608[/C][C]0[/C][/ROW]
[ROW][C]16[/C][C]0.574343[/C][C]6.239[/C][C]0[/C][/ROW]
[ROW][C]17[/C][C]0.545527[/C][C]5.9259[/C][C]0[/C][/ROW]
[ROW][C]18[/C][C]0.518371[/C][C]5.6309[/C][C]0[/C][/ROW]
[ROW][C]19[/C][C]0.492552[/C][C]5.3505[/C][C]0[/C][/ROW]
[ROW][C]20[/C][C]0.466698[/C][C]5.0696[/C][C]1e-06[/C][/ROW]
[ROW][C]21[/C][C]0.44132[/C][C]4.794[/C][C]2e-06[/C][/ROW]
[ROW][C]22[/C][C]0.416315[/C][C]4.5223[/C][C]7e-06[/C][/ROW]
[ROW][C]23[/C][C]0.392886[/C][C]4.2678[/C][C]2e-05[/C][/ROW]
[ROW][C]24[/C][C]0.369414[/C][C]4.0129[/C][C]5.3e-05[/C][/ROW]
[ROW][C]25[/C][C]0.34679[/C][C]3.7671[/C][C]0.00013[/C][/ROW]
[ROW][C]26[/C][C]0.324522[/C][C]3.5252[/C][C]0.000302[/C][/ROW]
[ROW][C]27[/C][C]0.301154[/C][C]3.2714[/C][C]0.000702[/C][/ROW]
[ROW][C]28[/C][C]0.278329[/C][C]3.0234[/C][C]0.001533[/C][/ROW]
[ROW][C]29[/C][C]0.256362[/C][C]2.7848[/C][C]0.003121[/C][/ROW]
[ROW][C]30[/C][C]0.235257[/C][C]2.5555[/C][C]0.005936[/C][/ROW]
[ROW][C]31[/C][C]0.215766[/C][C]2.3438[/C][C]0.01038[/C][/ROW]
[ROW][C]32[/C][C]0.19674[/C][C]2.1371[/C][C]0.017325[/C][/ROW]
[ROW][C]33[/C][C]0.177773[/C][C]1.9311[/C][C]0.027934[/C][/ROW]
[ROW][C]34[/C][C]0.15894[/C][C]1.7265[/C][C]0.043435[/C][/ROW]
[ROW][C]35[/C][C]0.140841[/C][C]1.5299[/C][C]0.064356[/C][/ROW]
[ROW][C]36[/C][C]0.12198[/C][C]1.325[/C][C]0.093859[/C][/ROW]
[ROW][C]37[/C][C]0.103767[/C][C]1.1272[/C][C]0.130973[/C][/ROW]
[ROW][C]38[/C][C]0.0858[/C][C]0.932[/C][C]0.176614[/C][/ROW]
[ROW][C]39[/C][C]0.067872[/C][C]0.7373[/C][C]0.23121[/C][/ROW]
[ROW][C]40[/C][C]0.050208[/C][C]0.5454[/C][C]0.293255[/C][/ROW]
[ROW][C]41[/C][C]0.033006[/C][C]0.3585[/C][C]0.360293[/C][/ROW]
[ROW][C]42[/C][C]0.017465[/C][C]0.1897[/C][C]0.424927[/C][/ROW]
[ROW][C]43[/C][C]0.003199[/C][C]0.0348[/C][C]0.486168[/C][/ROW]
[ROW][C]44[/C][C]-0.010929[/C][C]-0.1187[/C][C]0.452851[/C][/ROW]
[ROW][C]45[/C][C]-0.024782[/C][C]-0.2692[/C][C]0.394122[/C][/ROW]
[ROW][C]46[/C][C]-0.038832[/C][C]-0.4218[/C][C]0.336959[/C][/ROW]
[ROW][C]47[/C][C]-0.05219[/C][C]-0.5669[/C][C]0.285921[/C][/ROW]
[ROW][C]48[/C][C]-0.065901[/C][C]-0.7159[/C][C]0.237744[/C][/ROW]
[ROW][C]49[/C][C]-0.07908[/C][C]-0.859[/C][C]0.196033[/C][/ROW]
[ROW][C]50[/C][C]-0.092766[/C][C]-1.0077[/C][C]0.157831[/C][/ROW]
[ROW][C]51[/C][C]-0.106642[/C][C]-1.1584[/C][C]0.124514[/C][/ROW]
[ROW][C]52[/C][C]-0.120618[/C][C]-1.3102[/C][C]0.096329[/C][/ROW]
[ROW][C]53[/C][C]-0.13423[/C][C]-1.4581[/C][C]0.073733[/C][/ROW]
[ROW][C]54[/C][C]-0.146492[/C][C]-1.5913[/C][C]0.057108[/C][/ROW]
[ROW][C]55[/C][C]-0.157685[/C][C]-1.7129[/C][C]0.044679[/C][/ROW]
[ROW][C]56[/C][C]-0.169005[/C][C]-1.8359[/C][C]0.034447[/C][/ROW]
[ROW][C]57[/C][C]-0.180297[/C][C]-1.9585[/C][C]0.026264[/C][/ROW]
[ROW][C]58[/C][C]-0.192329[/C][C]-2.0892[/C][C]0.019418[/C][/ROW]
[ROW][C]59[/C][C]-0.203747[/C][C]-2.2133[/C][C]0.014401[/C][/ROW]
[ROW][C]60[/C][C]-0.215876[/C][C]-2.345[/C][C]0.010348[/C][/ROW]
[/TABLE]
Source: https://freestatistics.org/blog/index.php?pk=113709&T=1

Globally Unique Identifier (entire table): ba.freestatistics.org/blog/index.php?pk=113709&T=1

As an alternative you can also use a QR Code:  

The GUIDs for individual cells are displayed in the table below:

Autocorrelation Function
Time lag kACF(k)T-STATP-value
10.97538810.59540
20.95007810.32050
30.92418610.03920
40.8981999.75690
50.8719019.47130
60.8453179.18250
70.8195848.9030
80.7936188.62090
90.7677358.33970
100.7415688.05550
110.7161757.77960
120.6895337.49020
130.6621717.1930
140.6334436.88090
150.6039756.56080
160.5743436.2390
170.5455275.92590
180.5183715.63090
190.4925525.35050
200.4666985.06961e-06
210.441324.7942e-06
220.4163154.52237e-06
230.3928864.26782e-05
240.3694144.01295.3e-05
250.346793.76710.00013
260.3245223.52520.000302
270.3011543.27140.000702
280.2783293.02340.001533
290.2563622.78480.003121
300.2352572.55550.005936
310.2157662.34380.01038
320.196742.13710.017325
330.1777731.93110.027934
340.158941.72650.043435
350.1408411.52990.064356
360.121981.3250.093859
370.1037671.12720.130973
380.08580.9320.176614
390.0678720.73730.23121
400.0502080.54540.293255
410.0330060.35850.360293
420.0174650.18970.424927
430.0031990.03480.486168
44-0.010929-0.11870.452851
45-0.024782-0.26920.394122
46-0.038832-0.42180.336959
47-0.05219-0.56690.285921
48-0.065901-0.71590.237744
49-0.07908-0.8590.196033
50-0.092766-1.00770.157831
51-0.106642-1.15840.124514
52-0.120618-1.31020.096329
53-0.13423-1.45810.073733
54-0.146492-1.59130.057108
55-0.157685-1.71290.044679
56-0.169005-1.83590.034447
57-0.180297-1.95850.026264
58-0.192329-2.08920.019418
59-0.203747-2.21330.014401
60-0.215876-2.3450.010348


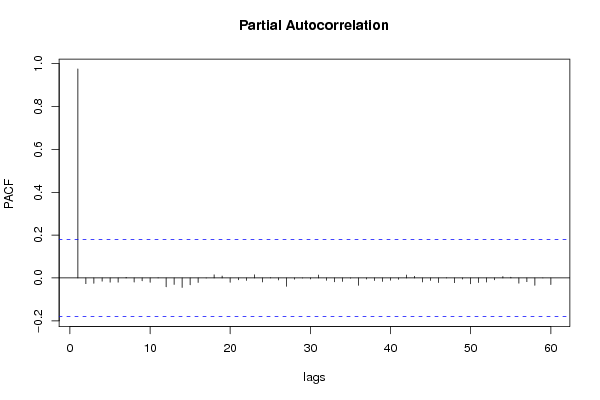
Partial Autocorrelation Function
Time lag kPACF(k)T-STATP-value
10.97538810.59540
2-0.026787-0.2910.385787
3-0.02479-0.26930.394088
4-0.01507-0.16370.435125
5-0.019929-0.21650.414492
6-0.019729-0.21430.415338
70.0034310.03730.485168
8-0.019273-0.20940.417263
9-0.012965-0.14080.44412
10-0.020424-0.22190.412405
119e-040.00980.496109
12-0.041005-0.44540.328414
13-0.029963-0.32550.372697
14-0.043955-0.47750.316956
15-0.031907-0.34660.364754
16-0.021002-0.22810.409965
17-0.000467-0.00510.497981
180.0148010.16080.436272
190.0090590.09840.460889
20-0.020346-0.2210.412731
21-0.008319-0.09040.464076
22-0.011588-0.12590.450019
230.0149340.16220.435705
24-0.018166-0.19730.421953
250.0014640.01590.493669
26-0.009307-0.10110.459823
27-0.038856-0.42210.336867
28-0.005906-0.06420.474476
290.0001130.00120.49951
30-0.00423-0.0460.481713
310.0135380.14710.441668
32-0.011099-0.12060.452119
33-0.017678-0.1920.424024
34-0.015947-0.17320.431382
35-0.001183-0.01290.494884
36-0.034088-0.37030.355916
37-0.005147-0.05590.477754
38-0.012101-0.13140.447822
39-0.016126-0.17520.430623
40-0.010527-0.11440.454577
41-0.006188-0.06720.47326
420.0136240.1480.441301
430.0076040.08260.467155
44-0.018211-0.19780.421761
45-0.011463-0.12450.450557
46-0.02115-0.22980.409342
470.0009450.01030.495914
48-0.021734-0.23610.406884
49-0.004834-0.05250.479106
50-0.027016-0.29350.384841
51-0.021273-0.23110.408823
52-0.018918-0.20550.418766
53-0.008542-0.09280.463116
540.0067150.07290.470987
550.0036850.040.484067
56-0.024026-0.2610.397277
57-0.017466-0.18970.424925
58-0.034201-0.37150.355458
590.000410.00450.498227
60-0.030576-0.33210.370186

\begin{tabular}{lllllllll}
\hline
Partial Autocorrelation Function \tabularnewline
Time lag k & PACF(k) & T-STAT & P-value \tabularnewline
1 & 0.975388 & 10.5954 & 0 \tabularnewline
2 & -0.026787 & -0.291 & 0.385787 \tabularnewline
3 & -0.02479 & -0.2693 & 0.394088 \tabularnewline
4 & -0.01507 & -0.1637 & 0.435125 \tabularnewline
5 & -0.019929 & -0.2165 & 0.414492 \tabularnewline
6 & -0.019729 & -0.2143 & 0.415338 \tabularnewline
7 & 0.003431 & 0.0373 & 0.485168 \tabularnewline
8 & -0.019273 & -0.2094 & 0.417263 \tabularnewline
9 & -0.012965 & -0.1408 & 0.44412 \tabularnewline
10 & -0.020424 & -0.2219 & 0.412405 \tabularnewline
11 & 9e-04 & 0.0098 & 0.496109 \tabularnewline
12 & -0.041005 & -0.4454 & 0.328414 \tabularnewline
13 & -0.029963 & -0.3255 & 0.372697 \tabularnewline
14 & -0.043955 & -0.4775 & 0.316956 \tabularnewline
15 & -0.031907 & -0.3466 & 0.364754 \tabularnewline
16 & -0.021002 & -0.2281 & 0.409965 \tabularnewline
17 & -0.000467 & -0.0051 & 0.497981 \tabularnewline
18 & 0.014801 & 0.1608 & 0.436272 \tabularnewline
19 & 0.009059 & 0.0984 & 0.460889 \tabularnewline
20 & -0.020346 & -0.221 & 0.412731 \tabularnewline
21 & -0.008319 & -0.0904 & 0.464076 \tabularnewline
22 & -0.011588 & -0.1259 & 0.450019 \tabularnewline
23 & 0.014934 & 0.1622 & 0.435705 \tabularnewline
24 & -0.018166 & -0.1973 & 0.421953 \tabularnewline
25 & 0.001464 & 0.0159 & 0.493669 \tabularnewline
26 & -0.009307 & -0.1011 & 0.459823 \tabularnewline
27 & -0.038856 & -0.4221 & 0.336867 \tabularnewline
28 & -0.005906 & -0.0642 & 0.474476 \tabularnewline
29 & 0.000113 & 0.0012 & 0.49951 \tabularnewline
30 & -0.00423 & -0.046 & 0.481713 \tabularnewline
31 & 0.013538 & 0.1471 & 0.441668 \tabularnewline
32 & -0.011099 & -0.1206 & 0.452119 \tabularnewline
33 & -0.017678 & -0.192 & 0.424024 \tabularnewline
34 & -0.015947 & -0.1732 & 0.431382 \tabularnewline
35 & -0.001183 & -0.0129 & 0.494884 \tabularnewline
36 & -0.034088 & -0.3703 & 0.355916 \tabularnewline
37 & -0.005147 & -0.0559 & 0.477754 \tabularnewline
38 & -0.012101 & -0.1314 & 0.447822 \tabularnewline
39 & -0.016126 & -0.1752 & 0.430623 \tabularnewline
40 & -0.010527 & -0.1144 & 0.454577 \tabularnewline
41 & -0.006188 & -0.0672 & 0.47326 \tabularnewline
42 & 0.013624 & 0.148 & 0.441301 \tabularnewline
43 & 0.007604 & 0.0826 & 0.467155 \tabularnewline
44 & -0.018211 & -0.1978 & 0.421761 \tabularnewline
45 & -0.011463 & -0.1245 & 0.450557 \tabularnewline
46 & -0.02115 & -0.2298 & 0.409342 \tabularnewline
47 & 0.000945 & 0.0103 & 0.495914 \tabularnewline
48 & -0.021734 & -0.2361 & 0.406884 \tabularnewline
49 & -0.004834 & -0.0525 & 0.479106 \tabularnewline
50 & -0.027016 & -0.2935 & 0.384841 \tabularnewline
51 & -0.021273 & -0.2311 & 0.408823 \tabularnewline
52 & -0.018918 & -0.2055 & 0.418766 \tabularnewline
53 & -0.008542 & -0.0928 & 0.463116 \tabularnewline
54 & 0.006715 & 0.0729 & 0.470987 \tabularnewline
55 & 0.003685 & 0.04 & 0.484067 \tabularnewline
56 & -0.024026 & -0.261 & 0.397277 \tabularnewline
57 & -0.017466 & -0.1897 & 0.424925 \tabularnewline
58 & -0.034201 & -0.3715 & 0.355458 \tabularnewline
59 & 0.00041 & 0.0045 & 0.498227 \tabularnewline
60 & -0.030576 & -0.3321 & 0.370186 \tabularnewline
\hline
\end{tabular}
%Source: https://freestatistics.org/blog/index.php?pk=113709&T=2

[TABLE]
[ROW][C]Partial Autocorrelation Function[/C][/ROW]
[ROW][C]Time lag k[/C][C]PACF(k)[/C][C]T-STAT[/C][C]P-value[/C][/ROW]
[ROW][C]1[/C][C]0.975388[/C][C]10.5954[/C][C]0[/C][/ROW]
[ROW][C]2[/C][C]-0.026787[/C][C]-0.291[/C][C]0.385787[/C][/ROW]
[ROW][C]3[/C][C]-0.02479[/C][C]-0.2693[/C][C]0.394088[/C][/ROW]
[ROW][C]4[/C][C]-0.01507[/C][C]-0.1637[/C][C]0.435125[/C][/ROW]
[ROW][C]5[/C][C]-0.019929[/C][C]-0.2165[/C][C]0.414492[/C][/ROW]
[ROW][C]6[/C][C]-0.019729[/C][C]-0.2143[/C][C]0.415338[/C][/ROW]
[ROW][C]7[/C][C]0.003431[/C][C]0.0373[/C][C]0.485168[/C][/ROW]
[ROW][C]8[/C][C]-0.019273[/C][C]-0.2094[/C][C]0.417263[/C][/ROW]
[ROW][C]9[/C][C]-0.012965[/C][C]-0.1408[/C][C]0.44412[/C][/ROW]
[ROW][C]10[/C][C]-0.020424[/C][C]-0.2219[/C][C]0.412405[/C][/ROW]
[ROW][C]11[/C][C]9e-04[/C][C]0.0098[/C][C]0.496109[/C][/ROW]
[ROW][C]12[/C][C]-0.041005[/C][C]-0.4454[/C][C]0.328414[/C][/ROW]
[ROW][C]13[/C][C]-0.029963[/C][C]-0.3255[/C][C]0.372697[/C][/ROW]
[ROW][C]14[/C][C]-0.043955[/C][C]-0.4775[/C][C]0.316956[/C][/ROW]
[ROW][C]15[/C][C]-0.031907[/C][C]-0.3466[/C][C]0.364754[/C][/ROW]
[ROW][C]16[/C][C]-0.021002[/C][C]-0.2281[/C][C]0.409965[/C][/ROW]
[ROW][C]17[/C][C]-0.000467[/C][C]-0.0051[/C][C]0.497981[/C][/ROW]
[ROW][C]18[/C][C]0.014801[/C][C]0.1608[/C][C]0.436272[/C][/ROW]
[ROW][C]19[/C][C]0.009059[/C][C]0.0984[/C][C]0.460889[/C][/ROW]
[ROW][C]20[/C][C]-0.020346[/C][C]-0.221[/C][C]0.412731[/C][/ROW]
[ROW][C]21[/C][C]-0.008319[/C][C]-0.0904[/C][C]0.464076[/C][/ROW]
[ROW][C]22[/C][C]-0.011588[/C][C]-0.1259[/C][C]0.450019[/C][/ROW]
[ROW][C]23[/C][C]0.014934[/C][C]0.1622[/C][C]0.435705[/C][/ROW]
[ROW][C]24[/C][C]-0.018166[/C][C]-0.1973[/C][C]0.421953[/C][/ROW]
[ROW][C]25[/C][C]0.001464[/C][C]0.0159[/C][C]0.493669[/C][/ROW]
[ROW][C]26[/C][C]-0.009307[/C][C]-0.1011[/C][C]0.459823[/C][/ROW]
[ROW][C]27[/C][C]-0.038856[/C][C]-0.4221[/C][C]0.336867[/C][/ROW]
[ROW][C]28[/C][C]-0.005906[/C][C]-0.0642[/C][C]0.474476[/C][/ROW]
[ROW][C]29[/C][C]0.000113[/C][C]0.0012[/C][C]0.49951[/C][/ROW]
[ROW][C]30[/C][C]-0.00423[/C][C]-0.046[/C][C]0.481713[/C][/ROW]
[ROW][C]31[/C][C]0.013538[/C][C]0.1471[/C][C]0.441668[/C][/ROW]
[ROW][C]32[/C][C]-0.011099[/C][C]-0.1206[/C][C]0.452119[/C][/ROW]
[ROW][C]33[/C][C]-0.017678[/C][C]-0.192[/C][C]0.424024[/C][/ROW]
[ROW][C]34[/C][C]-0.015947[/C][C]-0.1732[/C][C]0.431382[/C][/ROW]
[ROW][C]35[/C][C]-0.001183[/C][C]-0.0129[/C][C]0.494884[/C][/ROW]
[ROW][C]36[/C][C]-0.034088[/C][C]-0.3703[/C][C]0.355916[/C][/ROW]
[ROW][C]37[/C][C]-0.005147[/C][C]-0.0559[/C][C]0.477754[/C][/ROW]
[ROW][C]38[/C][C]-0.012101[/C][C]-0.1314[/C][C]0.447822[/C][/ROW]
[ROW][C]39[/C][C]-0.016126[/C][C]-0.1752[/C][C]0.430623[/C][/ROW]
[ROW][C]40[/C][C]-0.010527[/C][C]-0.1144[/C][C]0.454577[/C][/ROW]
[ROW][C]41[/C][C]-0.006188[/C][C]-0.0672[/C][C]0.47326[/C][/ROW]
[ROW][C]42[/C][C]0.013624[/C][C]0.148[/C][C]0.441301[/C][/ROW]
[ROW][C]43[/C][C]0.007604[/C][C]0.0826[/C][C]0.467155[/C][/ROW]
[ROW][C]44[/C][C]-0.018211[/C][C]-0.1978[/C][C]0.421761[/C][/ROW]
[ROW][C]45[/C][C]-0.011463[/C][C]-0.1245[/C][C]0.450557[/C][/ROW]
[ROW][C]46[/C][C]-0.02115[/C][C]-0.2298[/C][C]0.409342[/C][/ROW]
[ROW][C]47[/C][C]0.000945[/C][C]0.0103[/C][C]0.495914[/C][/ROW]
[ROW][C]48[/C][C]-0.021734[/C][C]-0.2361[/C][C]0.406884[/C][/ROW]
[ROW][C]49[/C][C]-0.004834[/C][C]-0.0525[/C][C]0.479106[/C][/ROW]
[ROW][C]50[/C][C]-0.027016[/C][C]-0.2935[/C][C]0.384841[/C][/ROW]
[ROW][C]51[/C][C]-0.021273[/C][C]-0.2311[/C][C]0.408823[/C][/ROW]
[ROW][C]52[/C][C]-0.018918[/C][C]-0.2055[/C][C]0.418766[/C][/ROW]
[ROW][C]53[/C][C]-0.008542[/C][C]-0.0928[/C][C]0.463116[/C][/ROW]
[ROW][C]54[/C][C]0.006715[/C][C]0.0729[/C][C]0.470987[/C][/ROW]
[ROW][C]55[/C][C]0.003685[/C][C]0.04[/C][C]0.484067[/C][/ROW]
[ROW][C]56[/C][C]-0.024026[/C][C]-0.261[/C][C]0.397277[/C][/ROW]
[ROW][C]57[/C][C]-0.017466[/C][C]-0.1897[/C][C]0.424925[/C][/ROW]
[ROW][C]58[/C][C]-0.034201[/C][C]-0.3715[/C][C]0.355458[/C][/ROW]
[ROW][C]59[/C][C]0.00041[/C][C]0.0045[/C][C]0.498227[/C][/ROW]
[ROW][C]60[/C][C]-0.030576[/C][C]-0.3321[/C][C]0.370186[/C][/ROW]
[/TABLE]
Source: https://freestatistics.org/blog/index.php?pk=113709&T=2

Globally Unique Identifier (entire table): ba.freestatistics.org/blog/index.php?pk=113709&T=2

As an alternative you can also use a QR Code:  

The GUIDs for individual cells are displayed in the table below:

Partial Autocorrelation Function
Time lag kPACF(k)T-STATP-value
10.97538810.59540
2-0.026787-0.2910.385787
3-0.02479-0.26930.394088
4-0.01507-0.16370.435125
5-0.019929-0.21650.414492
6-0.019729-0.21430.415338
70.0034310.03730.485168
8-0.019273-0.20940.417263
9-0.012965-0.14080.44412
10-0.020424-0.22190.412405
119e-040.00980.496109
12-0.041005-0.44540.328414
13-0.029963-0.32550.372697
14-0.043955-0.47750.316956
15-0.031907-0.34660.364754
16-0.021002-0.22810.409965
17-0.000467-0.00510.497981
180.0148010.16080.436272
190.0090590.09840.460889
20-0.020346-0.2210.412731
21-0.008319-0.09040.464076
22-0.011588-0.12590.450019
230.0149340.16220.435705
24-0.018166-0.19730.421953
250.0014640.01590.493669
26-0.009307-0.10110.459823
27-0.038856-0.42210.336867
28-0.005906-0.06420.474476
290.0001130.00120.49951
30-0.00423-0.0460.481713
310.0135380.14710.441668
32-0.011099-0.12060.452119
33-0.017678-0.1920.424024
34-0.015947-0.17320.431382
35-0.001183-0.01290.494884
36-0.034088-0.37030.355916
37-0.005147-0.05590.477754
38-0.012101-0.13140.447822
39-0.016126-0.17520.430623
40-0.010527-0.11440.454577
41-0.006188-0.06720.47326
420.0136240.1480.441301
430.0076040.08260.467155
44-0.018211-0.19780.421761
45-0.011463-0.12450.450557
46-0.02115-0.22980.409342
470.0009450.01030.495914
48-0.021734-0.23610.406884
49-0.004834-0.05250.479106
50-0.027016-0.29350.384841
51-0.021273-0.23110.408823
52-0.018918-0.20550.418766
53-0.008542-0.09280.463116
540.0067150.07290.470987
550.0036850.040.484067
56-0.024026-0.2610.397277
57-0.017466-0.18970.424925
58-0.034201-0.37150.355458
590.000410.00450.498227
60-0.030576-0.33210.370186


Parameters (Session):
par1 = 1 ; par2 = Do not include Seasonal Dummies ; par3 = No Linear Trend ;
Parameters (R input):
par1 = 60 ; par2 = 1 ; par3 = 0 ; par4 = 0 ; par5 = 12 ; par6 = White Noise ; par7 = 0.95 ; par8 = ;
R code (references can be found in the software module):
if (par1 == 'Default') {
par1 = 10*log10(length(x))
} else {
par1 <- as.numeric(par1)
}
par2 <- as.numeric(par2)
par3 <- as.numeric(par3)
par4 <- as.numeric(par4)
par5 <- as.numeric(par5)
if (par6 == 'White Noise') par6 <- 'white' else par6 <- 'ma'
par7 <- as.numeric(par7)
if (par2 == 0) {
x <- log(x)
} else {
x <- (x ^ par2 - 1) / par2
}
if (par3 > 0) x <- diff(x,lag=1,difference=par3)
if (par4 > 0) x <- diff(x,lag=par5,difference=par4)
bitmap(file='pic1.png')
racf <- acf(x, par1, main='Autocorrelation', xlab='time lag', ylab='ACF', ci.type=par6, ci=par7, sub=paste('(lambda=',par2,', d=',par3,', D=',par4,', CI=', par7, ', CI type=',par6,')',sep=''))
dev.off()
bitmap(file='pic2.png')
rpacf <- pacf(x,par1,main='Partial Autocorrelation',xlab='lags',ylab='PACF')
dev.off()
(myacf <- c(racf$acf))
(mypacf <- c(rpacf$acf))
lengthx <- length(x)
sqrtn <- sqrt(lengthx)
load(file='createtable')
a<-table.start()
a<-table.row.start(a)
a<-table.element(a,'Autocorrelation Function',4,TRUE)
a<-table.row.end(a)
a<-table.row.start(a)
a<-table.element(a,'Time lag k',header=TRUE)
a<-table.element(a,hyperlink('basics.htm','ACF(k)','click here for more information about the Autocorrelation Function'),header=TRUE)
a<-table.element(a,'T-STAT',header=TRUE)
a<-table.element(a,'P-value',header=TRUE)
a<-table.row.end(a)
for (i in 2:(par1+1)) {
a<-table.row.start(a)
a<-table.element(a,i-1,header=TRUE)
a<-table.element(a,round(myacf[i],6))
mytstat <- myacf[i]*sqrtn
a<-table.element(a,round(mytstat,4))
a<-table.element(a,round(1-pt(abs(mytstat),lengthx),6))
a<-table.row.end(a)
}
a<-table.end(a)
table.save(a,file='mytable.tab')
a<-table.start()
a<-table.row.start(a)
a<-table.element(a,'Partial Autocorrelation Function',4,TRUE)
a<-table.row.end(a)
a<-table.row.start(a)
a<-table.element(a,'Time lag k',header=TRUE)
a<-table.element(a,hyperlink('basics.htm','PACF(k)','click here for more information about the Partial Autocorrelation Function'),header=TRUE)
a<-table.element(a,'T-STAT',header=TRUE)
a<-table.element(a,'P-value',header=TRUE)
a<-table.row.end(a)
for (i in 1:par1) {
a<-table.row.start(a)
a<-table.element(a,i,header=TRUE)
a<-table.element(a,round(mypacf[i],6))
mytstat <- mypacf[i]*sqrtn
a<-table.element(a,round(mytstat,4))
a<-table.element(a,round(1-pt(abs(mytstat),lengthx),6))
a<-table.row.end(a)
}
a<-table.end(a)
table.save(a,file='mytable1.tab')