lineaire regressie huwelijken vs geborenen | ||||||||||||||||||||||||||||||
| *The author of this computation has been verified* | ||||||||||||||||||||||||||||||
| R Software Module: /rwasp_linear_regression.wasp (opens new window with default values) | ||||||||||||||||||||||||||||||
| Title produced by software: Linear Regression Graphical Model Validation | ||||||||||||||||||||||||||||||
| Date of computation: Tue, 21 Dec 2010 15:46:33 +0000 | ||||||||||||||||||||||||||||||
| Cite this page as follows: | ||||||||||||||||||||||||||||||
| Statistical Computations at FreeStatistics.org, Office for Research Development and Education, URL http://www.freestatistics.org/blog/date/2010/Dec/21/t129294669772jp6c1l9npp1nr.htm/, Retrieved Tue, 21 Dec 2010 16:51:47 +0100 | ||||||||||||||||||||||||||||||
| BibTeX entries for LaTeX users: | ||||||||||||||||||||||||||||||
@Manual{KEY,
    author = {{YOUR NAME}},
    publisher = {Office for Research Development and Education},
    title = {Statistical Computations at FreeStatistics.org, URL http://www.freestatistics.org/blog/date/2010/Dec/21/t129294669772jp6c1l9npp1nr.htm/},
    year = {2010},
}
@Manual{R,
    title = {R: A Language and Environment for Statistical Computing},
    author = {{R Development Core Team}},
    organization = {R Foundation for Statistical Computing},
    address = {Vienna, Austria},
    year = {2010},
    note = {{ISBN} 3-900051-07-0},
    url = {http://www.R-project.org},
}
| ||||||||||||||||||||||||||||||
| Original text written by user: | ||||||||||||||||||||||||||||||
| IsPrivate? | ||||||||||||||||||||||||||||||
| No (this computation is public) | ||||||||||||||||||||||||||||||
| User-defined keywords: | ||||||||||||||||||||||||||||||
| Dataseries X: | ||||||||||||||||||||||||||||||
| » Textbox « » Textfile « » CSV « | ||||||||||||||||||||||||||||||
| 17153 15579 16755 16585 16572 16325 17913 17572 17338 17087 15864 15554 16229 15180 16215 15801 15751 16477 17324 16919 16438 16239 15613 15821 15678 14671 15876 15563 15711 15583 16405 16701 16194 16024 14728 14776 15399 14286 15646 14543 15673 15171 15999 16260 16123 16144 15005 14806 15019 13909 15211 14385 15144 14659 15989 16262 16021 15662 14531 14544 15071 14236 14771 14804 15597 15418 16903 16350 16393 15685 14556 14850 15391 13704 15409 15098 15254 15522 16669 16238 16246 15424 14952 15008 | ||||||||||||||||||||||||||||||
| Dataseries Y: | ||||||||||||||||||||||||||||||
| » Textbox « » Textfile « » CSV « | ||||||||||||||||||||||||||||||
| 3111 3995 5245 5588 10681 10516 7496 9935 10249 6271 3616 3724 2886 3318 4166 6401 9209 9820 7470 8207 9564 5309 3385 3706 2733 3045 3449 5542 10072 9418 7516 7840 10081 4956 3641 3970 2931 3170 3889 4850 8037 12370 6712 7297 10613 5184 3506 3810 2692 3073 3713 4555 7807 10869 9682 7704 9826 5456 3677 3431 2765 3483 3445 6081 8767 9407 6551 12480 9530 5960 3252 3717 2642 2989 3607 5366 8898 9435 7328 8594 11349 5797 3621 3851 | ||||||||||||||||||||||||||||||
| Output produced by software: | ||||||||||||||||||||||||||||||
| ||||||||||||||||||||||||||||||
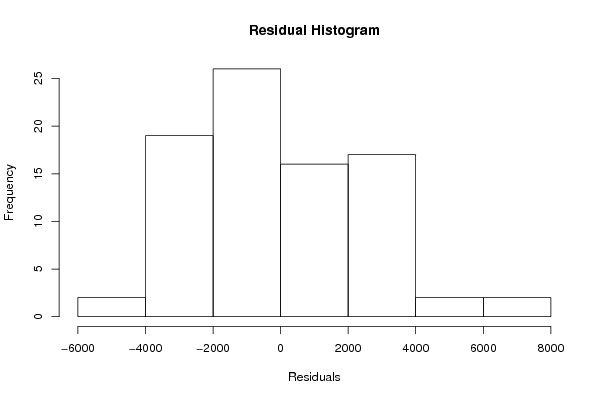
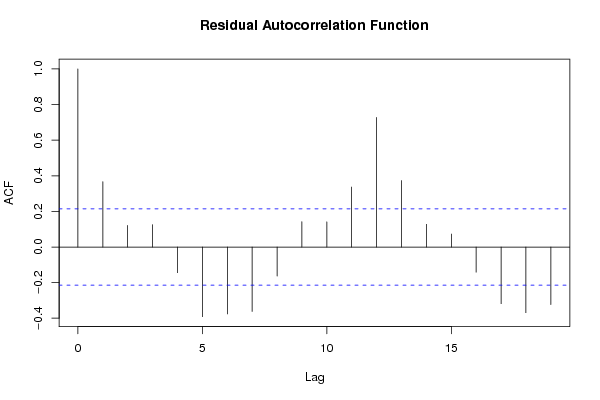
| Charts produced by software: | ||||||||||||||||||||||||||||||
| ||||||||||||||||||||||||||||||
| Parameters (Session): | ||||||||||||||||||||||||||||||
| par1 = 0 ; | ||||||||||||||||||||||||||||||
| Parameters (R input): | ||||||||||||||||||||||||||||||
| par1 = 0 ; | ||||||||||||||||||||||||||||||
| R code (references can be found in the software module): | ||||||||||||||||||||||||||||||
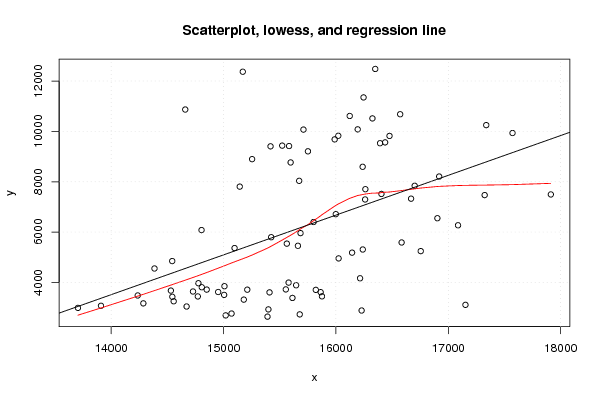
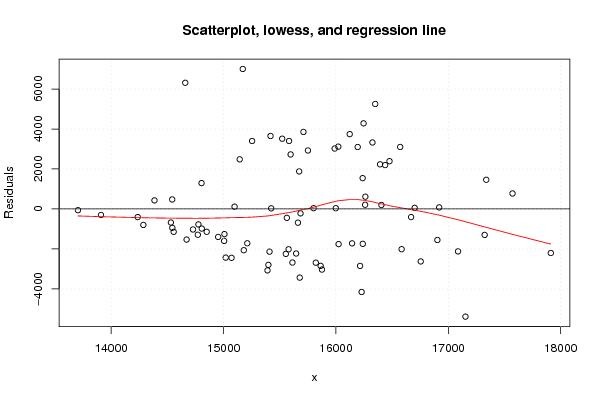
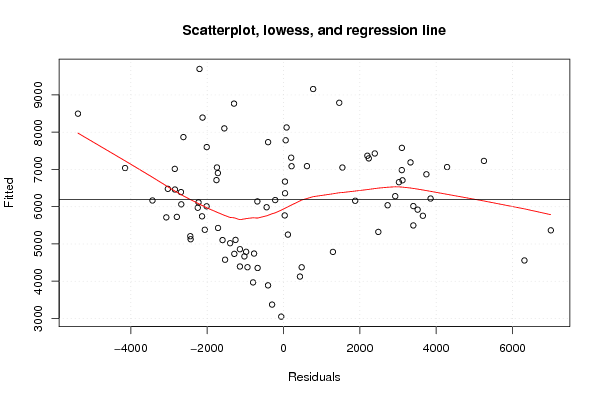
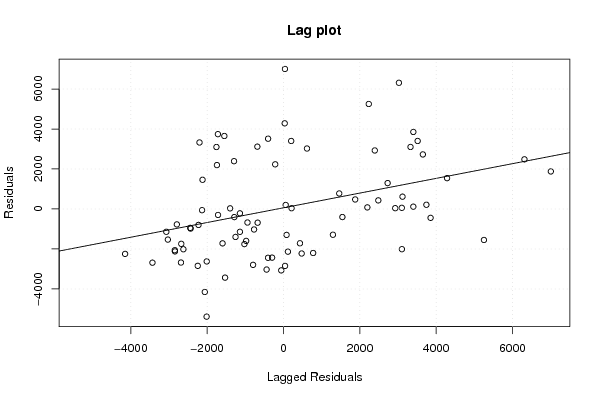
| par1 <- as.numeric(par1)
library(lattice) z <- as.data.frame(cbind(x,y)) m <- lm(y~x) summary(m) bitmap(file='test1.png') plot(z,main='Scatterplot, lowess, and regression line') lines(lowess(z),col='red') abline(m) grid() dev.off() bitmap(file='test2.png') m2 <- lm(m$fitted.values ~ x) summary(m2) z2 <- as.data.frame(cbind(x,m$fitted.values)) names(z2) <- list('x','Fitted') plot(z2,main='Scatterplot, lowess, and regression line') lines(lowess(z2),col='red') abline(m2) grid() dev.off() bitmap(file='test3.png') m3 <- lm(m$residuals ~ x) summary(m3) z3 <- as.data.frame(cbind(x,m$residuals)) names(z3) <- list('x','Residuals') plot(z3,main='Scatterplot, lowess, and regression line') lines(lowess(z3),col='red') abline(m3) grid() dev.off() bitmap(file='test4.png') m4 <- lm(m$fitted.values ~ m$residuals) summary(m4) z4 <- as.data.frame(cbind(m$residuals,m$fitted.values)) names(z4) <- list('Residuals','Fitted') plot(z4,main='Scatterplot, lowess, and regression line') lines(lowess(z4),col='red') abline(m4) grid() dev.off() bitmap(file='test5.png') myr <- as.ts(m$residuals) z5 <- as.data.frame(cbind(lag(myr,1),myr)) names(z5) <- list('Lagged Residuals','Residuals') plot(z5,main='Lag plot') m5 <- lm(z5) summary(m5) abline(m5) grid() dev.off() bitmap(file='test6.png') hist(m$residuals,main='Residual Histogram',xlab='Residuals') dev.off() bitmap(file='test7.png') if (par1 > 0) { densityplot(~m$residuals,col='black',main=paste('Density Plot bw = ',par1),bw=par1) } else { densityplot(~m$residuals,col='black',main='Density Plot') } dev.off() bitmap(file='test8.png') acf(m$residuals,main='Residual Autocorrelation Function') dev.off() bitmap(file='test9.png') qqnorm(x) qqline(x) grid() dev.off() load(file='createtable') a<-table.start() a<-table.row.start(a) a<-table.element(a,'Simple Linear Regression',5,TRUE) a<-table.row.end(a) a<-table.row.start(a) a<-table.element(a,'Statistics',1,TRUE) a<-table.element(a,'Estimate',1,TRUE) a<-table.element(a,'S.D.',1,TRUE) a<-table.element(a,'T-STAT (H0: coeff=0)',1,TRUE) a<-table.element(a,'P-value (two-sided)',1,TRUE) a<-table.row.end(a) a<-table.row.start(a) a<-table.element(a,'constant term',header=TRUE) a<-table.element(a,m$coefficients[[1]]) sd <- sqrt(vcov(m)[1,1]) a<-table.element(a,sd) tstat <- m$coefficients[[1]]/sd a<-table.element(a,tstat) pval <- 2*(1-pt(abs(tstat),length(x)-2)) a<-table.element(a,pval) a<-table.row.end(a) a<-table.row.start(a) a<-table.element(a,'slope',header=TRUE) a<-table.element(a,m$coefficients[[2]]) sd <- sqrt(vcov(m)[2,2]) a<-table.element(a,sd) tstat <- m$coefficients[[2]]/sd a<-table.element(a,tstat) pval <- 2*(1-pt(abs(tstat),length(x)-2)) a<-table.element(a,pval) a<-table.row.end(a) a<-table.end(a) table.save(a,file='mytable.tab') | ||||||||||||||||||||||||||||||


Copyright

This work is licensed under a
Creative Commons Attribution-Noncommercial-Share Alike 3.0 License.
Software written by Ed van Stee & Patrick Wessa
Disclaimer
Information provided on this web site is provided "AS IS" without warranty of any kind, either express or implied, including, without limitation, warranties of merchantability, fitness for a particular purpose, and noninfringement. We use reasonable efforts to include accurate and timely information and periodically update the information, and software without notice. However, we make no warranties or representations as to the accuracy or completeness of such information (or software), and we assume no liability or responsibility for errors or omissions in the content of this web site, or any software bugs in online applications. Your use of this web site is AT YOUR OWN RISK. Under no circumstances and under no legal theory shall we be liable to you or any other person for any direct, indirect, special, incidental, exemplary, or consequential damages arising from your access to, or use of, this web site.
Privacy Policy
We may request personal information to be submitted to our servers in order to be able to:
- personalize online software applications according to your needs
- enforce strict security rules with respect to the data that you upload (e.g. statistical data)
- manage user sessions of online applications
- alert you about important changes or upgrades in resources or applications
We NEVER allow other companies to directly offer registered users information about their products and services. Banner references and hyperlinks of third parties NEVER contain any personal data of the visitor.
We do NOT sell, nor transmit by any means, personal information, nor statistical data series uploaded by you to third parties.
We carefully protect your data from loss, misuse, alteration,
and destruction. However, at any time, and under any circumstance you
are solely responsible for managing your passwords, and keeping them
secret.
We store a unique ANONYMOUS USER ID in the form of a small 'Cookie' on your computer. This allows us to track your progress when using this website which is necessary to create state-dependent features. The cookie is used for NO OTHER PURPOSE. At any time you may opt to disallow cookies from this website - this will not affect other features of this website.
We examine cookies that are used by third-parties (banner and online ads) very closely: abuse from third-parties automatically results in termination of the advertising contract without refund. We have very good reason to believe that the cookies that are produced by third parties (banner ads) do NOT cause any privacy or security risk.
FreeStatistics.org is safe. There is no need to download any software to use the applications and services contained in this website. Hence, your system's security is not compromised by their use, and your personal data - other than data you submit in the account application form, and the user-agent information that is transmitted by your browser - is never transmitted to our servers.
As a general rule, we do not log on-line behavior of individuals (other than normal logging of webserver 'hits'). However, in cases of abuse, hacking, unauthorized access, Denial of Service attacks, illegal copying, hotlinking, non-compliance with international webstandards (such as robots.txt), or any other harmful behavior, our system engineers are empowered to log, track, identify, publish, and ban misbehaving individuals - even if this leads to ban entire blocks of IP addresses, or disclosing user's identity.