Free Statistics

of Irreproducible Research!

Author's title

Author*The author of this computation has been verified*
R Software Modulerwasp_smp.wasp
Title produced by softwareStandard Deviation-Mean Plot
Date of computationTue, 21 Dec 2010 15:24:19 +0000
Cite this page as followsStatistical Computations at FreeStatistics.org, Office for Research Development and Education, URL https://freestatistics.org/blog/index.php?v=date/2010/Dec/21/t1292944981vlwr29e1wxxwnqh.htm/, Retrieved Tue, 07 May 2024 05:00:04 +0000
Statistical Computations at FreeStatistics.org, Office for Research Development and Education, URL https://freestatistics.org/blog/index.php?pk=113670, Retrieved Tue, 07 May 2024 05:00:04 +0000
QR Codes:

Original text written by user:
IsPrivate?No (this computation is public)
User-defined keywords
Estimated Impact159
Family? (F = Feedback message, R = changed R code, M = changed R Module, P = changed Parameters, D = changed Data)
-     [Univariate Data Series] [web server] [2010-10-19 15:51:23] [b98453cac15ba1066b407e146608df68]
- RMP   [Variance Reduction Matrix] [Pageviews] [2010-11-29 10:12:20] [b98453cac15ba1066b407e146608df68]
- RM      [Standard Deviation-Mean Plot] [Pageviews] [2010-11-29 11:10:57] [b98453cac15ba1066b407e146608df68]
-   PD        [Standard Deviation-Mean Plot] [SMP olieproductie LT] [2010-12-21 15:24:19] [8f110cf3e3846d42560df9b5835185a6] [Current]
Feedback Forum

Post a new message
Dataseries X:
31806
34571
37121
40438
43635
48064
50846
53668
58465
58618
55826
60412
62714
63332
66050
62948
59535
57298
56599
57686
57472
60463
60784
63154
64042
65460
65268
65774
66028
67104
68102
69897
72185
73538
72325
74820
74813
74533
76916
80371
81261
81557
81446
81995
79948


Summary of computational transaction
Raw Inputview raw input (R code)
Raw Outputview raw output of R engine
Computing time1 seconds
R Server'RServer@AstonUniversity' @ vre.aston.ac.uk

\begin{tabular}{lllllllll}
\hline
Summary of computational transaction \tabularnewline
Raw Input & view raw input (R code)  \tabularnewline
Raw Output & view raw output of R engine  \tabularnewline
Computing time & 1 seconds \tabularnewline
R Server & 'RServer@AstonUniversity' @ vre.aston.ac.uk \tabularnewline
\hline
\end{tabular}
%Source: https://freestatistics.org/blog/index.php?pk=113670&T=0

[TABLE]
[ROW][C]Summary of computational transaction[/C][/ROW]
[ROW][C]Raw Input[/C][C]view raw input (R code) [/C][/ROW]
[ROW][C]Raw Output[/C][C]view raw output of R engine [/C][/ROW]
[ROW][C]Computing time[/C][C]1 seconds[/C][/ROW]
[ROW][C]R Server[/C][C]'RServer@AstonUniversity' @ vre.aston.ac.uk[/C][/ROW]
[/TABLE]
Source: https://freestatistics.org/blog/index.php?pk=113670&T=0

Globally Unique Identifier (entire table): ba.freestatistics.org/blog/index.php?pk=113670&T=0

As an alternative you can also use a QR Code:  

The GUIDs for individual cells are displayed in the table below:

Summary of computational transaction
Raw Inputview raw input (R code)
Raw Outputview raw output of R engine
Computing time1 seconds
R Server'RServer@AstonUniversity' @ vre.aston.ac.uk


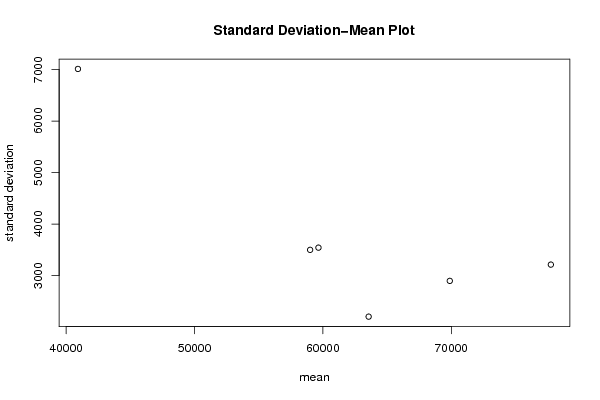
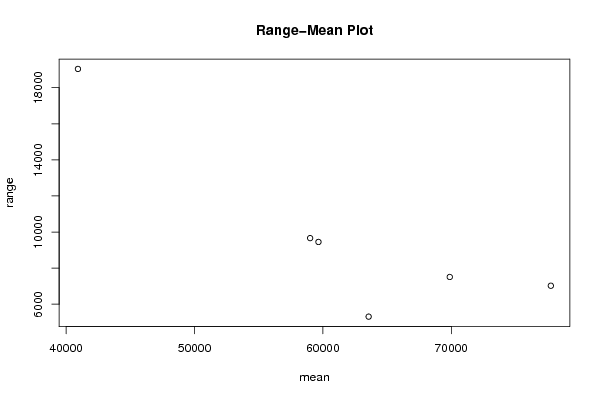
Standard Deviation-Mean Plot
SectionMeanStandard DeviationRange
140925.85714285717011.570423915319040
2590053499.767563710489664
359655.42857142863542.393440276549451
463563.57142857142203.16876771795311
569882.71428571432897.631660183067510
6777533213.136110821747024

\begin{tabular}{lllllllll}
\hline
Standard Deviation-Mean Plot \tabularnewline
Section & Mean & Standard Deviation & Range \tabularnewline
1 & 40925.8571428571 & 7011.5704239153 & 19040 \tabularnewline
2 & 59005 & 3499.76756371048 & 9664 \tabularnewline
3 & 59655.4285714286 & 3542.39344027654 & 9451 \tabularnewline
4 & 63563.5714285714 & 2203.1687677179 & 5311 \tabularnewline
5 & 69882.7142857143 & 2897.63166018306 & 7510 \tabularnewline
6 & 77753 & 3213.13611082174 & 7024 \tabularnewline
\hline
\end{tabular}
%Source: https://freestatistics.org/blog/index.php?pk=113670&T=1

[TABLE]
[ROW][C]Standard Deviation-Mean Plot[/C][/ROW]
[ROW][C]Section[/C][C]Mean[/C][C]Standard Deviation[/C][C]Range[/C][/ROW]
[ROW][C]1[/C][C]40925.8571428571[/C][C]7011.5704239153[/C][C]19040[/C][/ROW]
[ROW][C]2[/C][C]59005[/C][C]3499.76756371048[/C][C]9664[/C][/ROW]
[ROW][C]3[/C][C]59655.4285714286[/C][C]3542.39344027654[/C][C]9451[/C][/ROW]
[ROW][C]4[/C][C]63563.5714285714[/C][C]2203.1687677179[/C][C]5311[/C][/ROW]
[ROW][C]5[/C][C]69882.7142857143[/C][C]2897.63166018306[/C][C]7510[/C][/ROW]
[ROW][C]6[/C][C]77753[/C][C]3213.13611082174[/C][C]7024[/C][/ROW]
[/TABLE]
Source: https://freestatistics.org/blog/index.php?pk=113670&T=1

Globally Unique Identifier (entire table): ba.freestatistics.org/blog/index.php?pk=113670&T=1

As an alternative you can also use a QR Code:  

The GUIDs for individual cells are displayed in the table below:

Standard Deviation-Mean Plot
SectionMeanStandard DeviationRange
140925.85714285717011.570423915319040
2590053499.767563710489664
359655.42857142863542.393440276549451
463563.57142857142203.16876771795311
569882.71428571432897.631660183067510
6777533213.136110821747024


Regression: S.E.(k) = alpha + beta * Mean(k)
alpha10549.8356392255
beta-0.110390880936997
S.D.0.0392500225548654
T-STAT-2.81250490449241
p-value0.0481939508372858

\begin{tabular}{lllllllll}
\hline
Regression: S.E.(k) = alpha + beta * Mean(k) \tabularnewline
alpha & 10549.8356392255 \tabularnewline
beta & -0.110390880936997 \tabularnewline
S.D. & 0.0392500225548654 \tabularnewline
T-STAT & -2.81250490449241 \tabularnewline
p-value & 0.0481939508372858 \tabularnewline
\hline
\end{tabular}
%Source: https://freestatistics.org/blog/index.php?pk=113670&T=2

[TABLE]
[ROW][C]Regression: S.E.(k) = alpha + beta * Mean(k)[/C][/ROW]
[ROW][C]alpha[/C][C]10549.8356392255[/C][/ROW]
[ROW][C]beta[/C][C]-0.110390880936997[/C][/ROW]
[ROW][C]S.D.[/C][C]0.0392500225548654[/C][/ROW]
[ROW][C]T-STAT[/C][C]-2.81250490449241[/C][/ROW]
[ROW][C]p-value[/C][C]0.0481939508372858[/C][/ROW]
[/TABLE]
Source: https://freestatistics.org/blog/index.php?pk=113670&T=2

Globally Unique Identifier (entire table): ba.freestatistics.org/blog/index.php?pk=113670&T=2

As an alternative you can also use a QR Code:  

The GUIDs for individual cells are displayed in the table below:

Regression: S.E.(k) = alpha + beta * Mean(k)
alpha10549.8356392255
beta-0.110390880936997
S.D.0.0392500225548654
T-STAT-2.81250490449241
p-value0.0481939508372858


Regression: ln S.E.(k) = alpha + beta * ln Mean(k)
alpha23.9213870302502
beta-1.43160008992462
S.D.0.509144205273091
T-STAT-2.81177724326008
p-value0.0482296395513407
Lambda2.43160008992462

\begin{tabular}{lllllllll}
\hline
Regression: ln S.E.(k) = alpha + beta * ln Mean(k) \tabularnewline
alpha & 23.9213870302502 \tabularnewline
beta & -1.43160008992462 \tabularnewline
S.D. & 0.509144205273091 \tabularnewline
T-STAT & -2.81177724326008 \tabularnewline
p-value & 0.0482296395513407 \tabularnewline
Lambda & 2.43160008992462 \tabularnewline
\hline
\end{tabular}
%Source: https://freestatistics.org/blog/index.php?pk=113670&T=3

[TABLE]
[ROW][C]Regression: ln S.E.(k) = alpha + beta * ln Mean(k)[/C][/ROW]
[ROW][C]alpha[/C][C]23.9213870302502[/C][/ROW]
[ROW][C]beta[/C][C]-1.43160008992462[/C][/ROW]
[ROW][C]S.D.[/C][C]0.509144205273091[/C][/ROW]
[ROW][C]T-STAT[/C][C]-2.81177724326008[/C][/ROW]
[ROW][C]p-value[/C][C]0.0482296395513407[/C][/ROW]
[ROW][C]Lambda[/C][C]2.43160008992462[/C][/ROW]
[/TABLE]
Source: https://freestatistics.org/blog/index.php?pk=113670&T=3

Globally Unique Identifier (entire table): ba.freestatistics.org/blog/index.php?pk=113670&T=3

As an alternative you can also use a QR Code:  

The GUIDs for individual cells are displayed in the table below:

Regression: ln S.E.(k) = alpha + beta * ln Mean(k)
alpha23.9213870302502
beta-1.43160008992462
S.D.0.509144205273091
T-STAT-2.81177724326008
p-value0.0482296395513407
Lambda2.43160008992462


Parameters (Session):
par1 = 4 ;
Parameters (R input):
par1 = 4 ;
R code (references can be found in the software module):
par1 <- 7
(n <- length(x))
(np <- floor(n / par1))
arr <- array(NA,dim=c(par1,np))
j <- 0
k <- 1
for (i in 1:(np*par1))
{
j = j + 1
arr[j,k] <- x[i]
if (j == par1) {
j = 0
k=k+1
}
}
arr
arr.mean <- array(NA,dim=np)
arr.sd <- array(NA,dim=np)
arr.range <- array(NA,dim=np)
for (j in 1:np)
{
arr.mean[j] <- mean(arr[,j],na.rm=TRUE)
arr.sd[j] <- sd(arr[,j],na.rm=TRUE)
arr.range[j] <- max(arr[,j],na.rm=TRUE) - min(arr[,j],na.rm=TRUE)
}
arr.mean
arr.sd
arr.range
(lm1 <- lm(arr.sd~arr.mean))
(lnlm1 <- lm(log(arr.sd)~log(arr.mean)))
(lm2 <- lm(arr.range~arr.mean))
bitmap(file='test1.png')
plot(arr.mean,arr.sd,main='Standard Deviation-Mean Plot',xlab='mean',ylab='standard deviation')
dev.off()
bitmap(file='test2.png')
plot(arr.mean,arr.range,main='Range-Mean Plot',xlab='mean',ylab='range')
dev.off()
load(file='createtable')
a<-table.start()
a<-table.row.start(a)
a<-table.element(a,'Standard Deviation-Mean Plot',4,TRUE)
a<-table.row.end(a)
a<-table.row.start(a)
a<-table.element(a,'Section',header=TRUE)
a<-table.element(a,'Mean',header=TRUE)
a<-table.element(a,'Standard Deviation',header=TRUE)
a<-table.element(a,'Range',header=TRUE)
a<-table.row.end(a)
for (j in 1:np) {
a<-table.row.start(a)
a<-table.element(a,j,header=TRUE)
a<-table.element(a,arr.mean[j])
a<-table.element(a,arr.sd[j] )
a<-table.element(a,arr.range[j] )
a<-table.row.end(a)
}
a<-table.end(a)
table.save(a,file='mytable.tab')
a<-table.start()
a<-table.row.start(a)
a<-table.element(a,'Regression: S.E.(k) = alpha + beta * Mean(k)',2,TRUE)
a<-table.row.end(a)
a<-table.row.start(a)
a<-table.element(a,'alpha',header=TRUE)
a<-table.element(a,lm1$coefficients[[1]])
a<-table.row.end(a)
a<-table.row.start(a)
a<-table.element(a,'beta',header=TRUE)
a<-table.element(a,lm1$coefficients[[2]])
a<-table.row.end(a)
a<-table.row.start(a)
a<-table.element(a,'S.D.',header=TRUE)
a<-table.element(a,summary(lm1)$coefficients[2,2])
a<-table.row.end(a)
a<-table.row.start(a)
a<-table.element(a,'T-STAT',header=TRUE)
a<-table.element(a,summary(lm1)$coefficients[2,3])
a<-table.row.end(a)
a<-table.row.start(a)
a<-table.element(a,'p-value',header=TRUE)
a<-table.element(a,summary(lm1)$coefficients[2,4])
a<-table.row.end(a)
a<-table.end(a)
table.save(a,file='mytable1.tab')
a<-table.start()
a<-table.row.start(a)
a<-table.element(a,'Regression: ln S.E.(k) = alpha + beta * ln Mean(k)',2,TRUE)
a<-table.row.end(a)
a<-table.row.start(a)
a<-table.element(a,'alpha',header=TRUE)
a<-table.element(a,lnlm1$coefficients[[1]])
a<-table.row.end(a)
a<-table.row.start(a)
a<-table.element(a,'beta',header=TRUE)
a<-table.element(a,lnlm1$coefficients[[2]])
a<-table.row.end(a)
a<-table.row.start(a)
a<-table.element(a,'S.D.',header=TRUE)
a<-table.element(a,summary(lnlm1)$coefficients[2,2])
a<-table.row.end(a)
a<-table.row.start(a)
a<-table.element(a,'T-STAT',header=TRUE)
a<-table.element(a,summary(lnlm1)$coefficients[2,3])
a<-table.row.end(a)
a<-table.row.start(a)
a<-table.element(a,'p-value',header=TRUE)
a<-table.element(a,summary(lnlm1)$coefficients[2,4])
a<-table.row.end(a)
a<-table.row.start(a)
a<-table.element(a,'Lambda',header=TRUE)
a<-table.element(a,1-lnlm1$coefficients[[2]])
a<-table.row.end(a)
a<-table.end(a)
table.save(a,file='mytable2.tab')