Free Statistics

of Irreproducible Research!

Author's title

Author*The author of this computation has been verified*
R Software Modulerwasp_autocorrelation.wasp
Title produced by software(Partial) Autocorrelation Function
Date of computationTue, 21 Dec 2010 12:03:44 +0000
Cite this page as followsStatistical Computations at FreeStatistics.org, Office for Research Development and Education, URL https://freestatistics.org/blog/index.php?v=date/2010/Dec/21/t129293290519gynaaxi04oj5z.htm/, Retrieved Wed, 15 May 2024 10:46:09 +0000
Statistical Computations at FreeStatistics.org, Office for Research Development and Education, URL https://freestatistics.org/blog/index.php?pk=113335, Retrieved Wed, 15 May 2024 10:46:09 +0000
QR Codes:

Original text written by user:
IsPrivate?No (this computation is public)
User-defined keywords
Estimated Impact141
Family? (F = Feedback message, R = changed R code, M = changed R Module, P = changed Parameters, D = changed Data)
-     [(Partial) Autocorrelation Function] [Partial autocorre...] [2008-12-09 20:18:51] [12d343c4448a5f9e527bb31caeac580b]
-   P   [(Partial) Autocorrelation Function] [Partial autocorre...] [2008-12-09 20:27:26] [12d343c4448a5f9e527bb31caeac580b]
-  MPD    [(Partial) Autocorrelation Function] [] [2009-12-11 11:51:14] [cf890101a20378422561610e0d41fd9c]
- R PD        [(Partial) Autocorrelation Function] [] [2010-12-21 12:03:44] [7131fefee4115a2a717140ef0bdd6369] [Current]
Feedback Forum

Post a new message
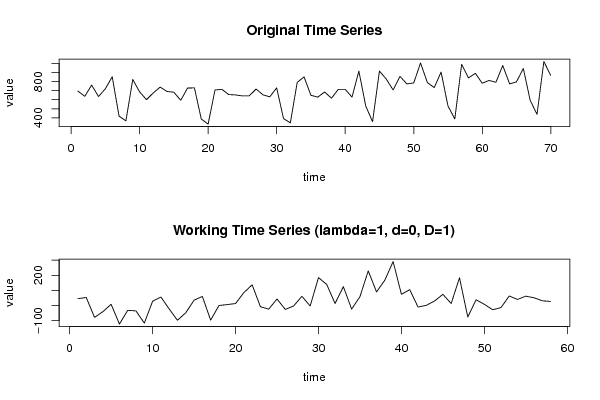
Dataseries X:
695
638
762
635
721
854
418
367
824
687
601
676
740
691
683
594
729
731
386
331
707
715
657
653
642
643
718
654
632
731
392
344
792
852
649
629
685
617
715
715
629
916
531
357
917
828
708
858
775
785
1006
789
734
906
532
387
991
841
892
782
813
793
978
775
797
946
594
438
1022
868


Summary of computational transaction
Raw Inputview raw input (R code)
Raw Outputview raw output of R engine
Computing time2 seconds
R Server'George Udny Yule' @ 72.249.76.132

\begin{tabular}{lllllllll}
\hline
Summary of computational transaction \tabularnewline
Raw Input & view raw input (R code)  \tabularnewline
Raw Output & view raw output of R engine  \tabularnewline
Computing time & 2 seconds \tabularnewline
R Server & 'George Udny Yule' @ 72.249.76.132 \tabularnewline
\hline
\end{tabular}
%Source: https://freestatistics.org/blog/index.php?pk=113335&T=0

[TABLE]
[ROW][C]Summary of computational transaction[/C][/ROW]
[ROW][C]Raw Input[/C][C]view raw input (R code) [/C][/ROW]
[ROW][C]Raw Output[/C][C]view raw output of R engine [/C][/ROW]
[ROW][C]Computing time[/C][C]2 seconds[/C][/ROW]
[ROW][C]R Server[/C][C]'George Udny Yule' @ 72.249.76.132[/C][/ROW]
[/TABLE]
Source: https://freestatistics.org/blog/index.php?pk=113335&T=0

Globally Unique Identifier (entire table): ba.freestatistics.org/blog/index.php?pk=113335&T=0

As an alternative you can also use a QR Code:  

The GUIDs for individual cells are displayed in the table below:

Summary of computational transaction
Raw Inputview raw input (R code)
Raw Outputview raw output of R engine
Computing time2 seconds
R Server'George Udny Yule' @ 72.249.76.132


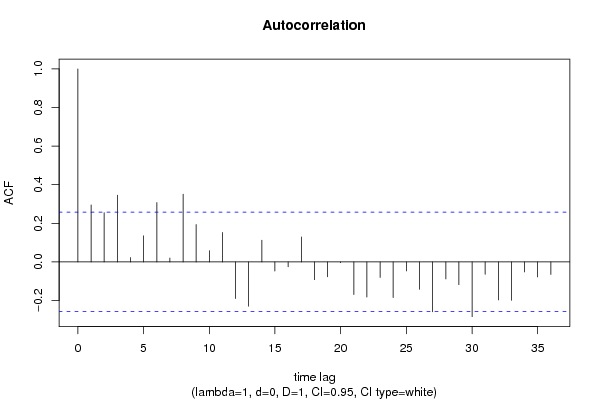
Autocorrelation Function
Time lag kACF(k)T-STATP-value
10.2951682.24790.014199
20.2548031.94050.028591
30.3456182.63210.005427
40.022470.17110.432361
50.1350451.02850.153998
60.3073492.34070.011354
70.0199130.15170.439992
80.3510182.67330.00487
90.1934541.47330.073038
100.0583410.44430.329235
110.1524431.1610.125205
12-0.189828-1.44570.076823
13-0.229277-1.74610.043042
140.1127620.85880.197002
15-0.047441-0.36130.359595
16-0.025248-0.19230.424097
170.1290920.98310.164811
18-0.092227-0.70240.242626
19-0.07734-0.5890.279072
20-0.004235-0.03230.487191
21-0.169487-1.29080.100951
22-0.182033-1.38630.085478
23-0.08062-0.6140.270813
24-0.184791-1.40730.082333
25-0.046804-0.35640.3614
26-0.142198-1.08290.141657
27-0.258789-1.97090.026758
28-0.088195-0.67170.25223
29-0.117982-0.89850.186311
30-0.283816-2.16150.017399
31-0.064417-0.49060.312786
32-0.197447-1.50370.06904
33-0.198922-1.51490.067608
34-0.051776-0.39430.347399
35-0.078321-0.59650.27659
36-0.064923-0.49440.311431

\begin{tabular}{lllllllll}
\hline
Autocorrelation Function \tabularnewline
Time lag k & ACF(k) & T-STAT & P-value \tabularnewline
1 & 0.295168 & 2.2479 & 0.014199 \tabularnewline
2 & 0.254803 & 1.9405 & 0.028591 \tabularnewline
3 & 0.345618 & 2.6321 & 0.005427 \tabularnewline
4 & 0.02247 & 0.1711 & 0.432361 \tabularnewline
5 & 0.135045 & 1.0285 & 0.153998 \tabularnewline
6 & 0.307349 & 2.3407 & 0.011354 \tabularnewline
7 & 0.019913 & 0.1517 & 0.439992 \tabularnewline
8 & 0.351018 & 2.6733 & 0.00487 \tabularnewline
9 & 0.193454 & 1.4733 & 0.073038 \tabularnewline
10 & 0.058341 & 0.4443 & 0.329235 \tabularnewline
11 & 0.152443 & 1.161 & 0.125205 \tabularnewline
12 & -0.189828 & -1.4457 & 0.076823 \tabularnewline
13 & -0.229277 & -1.7461 & 0.043042 \tabularnewline
14 & 0.112762 & 0.8588 & 0.197002 \tabularnewline
15 & -0.047441 & -0.3613 & 0.359595 \tabularnewline
16 & -0.025248 & -0.1923 & 0.424097 \tabularnewline
17 & 0.129092 & 0.9831 & 0.164811 \tabularnewline
18 & -0.092227 & -0.7024 & 0.242626 \tabularnewline
19 & -0.07734 & -0.589 & 0.279072 \tabularnewline
20 & -0.004235 & -0.0323 & 0.487191 \tabularnewline
21 & -0.169487 & -1.2908 & 0.100951 \tabularnewline
22 & -0.182033 & -1.3863 & 0.085478 \tabularnewline
23 & -0.08062 & -0.614 & 0.270813 \tabularnewline
24 & -0.184791 & -1.4073 & 0.082333 \tabularnewline
25 & -0.046804 & -0.3564 & 0.3614 \tabularnewline
26 & -0.142198 & -1.0829 & 0.141657 \tabularnewline
27 & -0.258789 & -1.9709 & 0.026758 \tabularnewline
28 & -0.088195 & -0.6717 & 0.25223 \tabularnewline
29 & -0.117982 & -0.8985 & 0.186311 \tabularnewline
30 & -0.283816 & -2.1615 & 0.017399 \tabularnewline
31 & -0.064417 & -0.4906 & 0.312786 \tabularnewline
32 & -0.197447 & -1.5037 & 0.06904 \tabularnewline
33 & -0.198922 & -1.5149 & 0.067608 \tabularnewline
34 & -0.051776 & -0.3943 & 0.347399 \tabularnewline
35 & -0.078321 & -0.5965 & 0.27659 \tabularnewline
36 & -0.064923 & -0.4944 & 0.311431 \tabularnewline
\hline
\end{tabular}
%Source: https://freestatistics.org/blog/index.php?pk=113335&T=1

[TABLE]
[ROW][C]Autocorrelation Function[/C][/ROW]
[ROW][C]Time lag k[/C][C]ACF(k)[/C][C]T-STAT[/C][C]P-value[/C][/ROW]
[ROW][C]1[/C][C]0.295168[/C][C]2.2479[/C][C]0.014199[/C][/ROW]
[ROW][C]2[/C][C]0.254803[/C][C]1.9405[/C][C]0.028591[/C][/ROW]
[ROW][C]3[/C][C]0.345618[/C][C]2.6321[/C][C]0.005427[/C][/ROW]
[ROW][C]4[/C][C]0.02247[/C][C]0.1711[/C][C]0.432361[/C][/ROW]
[ROW][C]5[/C][C]0.135045[/C][C]1.0285[/C][C]0.153998[/C][/ROW]
[ROW][C]6[/C][C]0.307349[/C][C]2.3407[/C][C]0.011354[/C][/ROW]
[ROW][C]7[/C][C]0.019913[/C][C]0.1517[/C][C]0.439992[/C][/ROW]
[ROW][C]8[/C][C]0.351018[/C][C]2.6733[/C][C]0.00487[/C][/ROW]
[ROW][C]9[/C][C]0.193454[/C][C]1.4733[/C][C]0.073038[/C][/ROW]
[ROW][C]10[/C][C]0.058341[/C][C]0.4443[/C][C]0.329235[/C][/ROW]
[ROW][C]11[/C][C]0.152443[/C][C]1.161[/C][C]0.125205[/C][/ROW]
[ROW][C]12[/C][C]-0.189828[/C][C]-1.4457[/C][C]0.076823[/C][/ROW]
[ROW][C]13[/C][C]-0.229277[/C][C]-1.7461[/C][C]0.043042[/C][/ROW]
[ROW][C]14[/C][C]0.112762[/C][C]0.8588[/C][C]0.197002[/C][/ROW]
[ROW][C]15[/C][C]-0.047441[/C][C]-0.3613[/C][C]0.359595[/C][/ROW]
[ROW][C]16[/C][C]-0.025248[/C][C]-0.1923[/C][C]0.424097[/C][/ROW]
[ROW][C]17[/C][C]0.129092[/C][C]0.9831[/C][C]0.164811[/C][/ROW]
[ROW][C]18[/C][C]-0.092227[/C][C]-0.7024[/C][C]0.242626[/C][/ROW]
[ROW][C]19[/C][C]-0.07734[/C][C]-0.589[/C][C]0.279072[/C][/ROW]
[ROW][C]20[/C][C]-0.004235[/C][C]-0.0323[/C][C]0.487191[/C][/ROW]
[ROW][C]21[/C][C]-0.169487[/C][C]-1.2908[/C][C]0.100951[/C][/ROW]
[ROW][C]22[/C][C]-0.182033[/C][C]-1.3863[/C][C]0.085478[/C][/ROW]
[ROW][C]23[/C][C]-0.08062[/C][C]-0.614[/C][C]0.270813[/C][/ROW]
[ROW][C]24[/C][C]-0.184791[/C][C]-1.4073[/C][C]0.082333[/C][/ROW]
[ROW][C]25[/C][C]-0.046804[/C][C]-0.3564[/C][C]0.3614[/C][/ROW]
[ROW][C]26[/C][C]-0.142198[/C][C]-1.0829[/C][C]0.141657[/C][/ROW]
[ROW][C]27[/C][C]-0.258789[/C][C]-1.9709[/C][C]0.026758[/C][/ROW]
[ROW][C]28[/C][C]-0.088195[/C][C]-0.6717[/C][C]0.25223[/C][/ROW]
[ROW][C]29[/C][C]-0.117982[/C][C]-0.8985[/C][C]0.186311[/C][/ROW]
[ROW][C]30[/C][C]-0.283816[/C][C]-2.1615[/C][C]0.017399[/C][/ROW]
[ROW][C]31[/C][C]-0.064417[/C][C]-0.4906[/C][C]0.312786[/C][/ROW]
[ROW][C]32[/C][C]-0.197447[/C][C]-1.5037[/C][C]0.06904[/C][/ROW]
[ROW][C]33[/C][C]-0.198922[/C][C]-1.5149[/C][C]0.067608[/C][/ROW]
[ROW][C]34[/C][C]-0.051776[/C][C]-0.3943[/C][C]0.347399[/C][/ROW]
[ROW][C]35[/C][C]-0.078321[/C][C]-0.5965[/C][C]0.27659[/C][/ROW]
[ROW][C]36[/C][C]-0.064923[/C][C]-0.4944[/C][C]0.311431[/C][/ROW]
[/TABLE]
Source: https://freestatistics.org/blog/index.php?pk=113335&T=1

Globally Unique Identifier (entire table): ba.freestatistics.org/blog/index.php?pk=113335&T=1

As an alternative you can also use a QR Code:  

The GUIDs for individual cells are displayed in the table below:

Autocorrelation Function
Time lag kACF(k)T-STATP-value
10.2951682.24790.014199
20.2548031.94050.028591
30.3456182.63210.005427
40.022470.17110.432361
50.1350451.02850.153998
60.3073492.34070.011354
70.0199130.15170.439992
80.3510182.67330.00487
90.1934541.47330.073038
100.0583410.44430.329235
110.1524431.1610.125205
12-0.189828-1.44570.076823
13-0.229277-1.74610.043042
140.1127620.85880.197002
15-0.047441-0.36130.359595
16-0.025248-0.19230.424097
170.1290920.98310.164811
18-0.092227-0.70240.242626
19-0.07734-0.5890.279072
20-0.004235-0.03230.487191
21-0.169487-1.29080.100951
22-0.182033-1.38630.085478
23-0.08062-0.6140.270813
24-0.184791-1.40730.082333
25-0.046804-0.35640.3614
26-0.142198-1.08290.141657
27-0.258789-1.97090.026758
28-0.088195-0.67170.25223
29-0.117982-0.89850.186311
30-0.283816-2.16150.017399
31-0.064417-0.49060.312786
32-0.197447-1.50370.06904
33-0.198922-1.51490.067608
34-0.051776-0.39430.347399
35-0.078321-0.59650.27659
36-0.064923-0.49440.311431


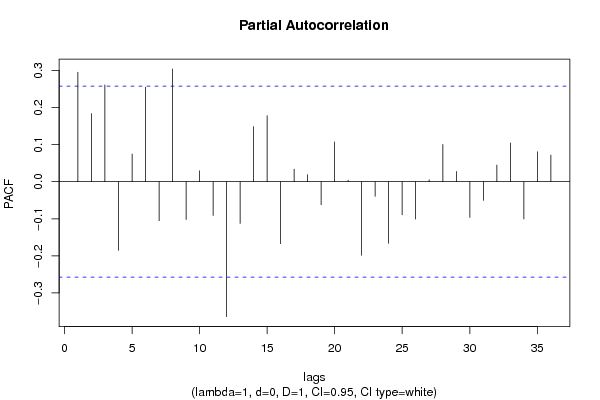
Partial Autocorrelation Function
Time lag kPACF(k)T-STATP-value
10.2951682.24790.014199
20.1836821.39890.083587
30.2607551.98590.025892
4-0.184909-1.40820.082201
50.0745280.56760.286254
60.2547081.93980.028636
7-0.105094-0.80040.213382
80.3038762.31420.012108
9-0.101838-0.77560.220575
100.0291830.22220.41245
11-0.090946-0.69260.245654
12-0.363774-2.77040.003755
13-0.112464-0.85650.197624
140.1482331.12890.131792
150.1779451.35520.090306
16-0.167243-1.27370.103928
170.033680.25650.399236
180.0188520.14360.443167
19-0.062369-0.4750.318288
200.1070350.81520.209159
210.0041820.03190.487349
22-0.198442-1.51130.068072
23-0.039384-0.29990.382646
24-0.166009-1.26430.105592
25-0.089246-0.67970.249706
26-0.100821-0.76780.222852
270.005120.0390.484515
280.1005050.76540.223561
290.0275910.21010.417154
30-0.096454-0.73460.232779
31-0.050381-0.38370.351305
320.0449670.34250.366621
330.1045330.79610.21461
34-0.100287-0.76380.224052
350.0806940.61450.27063
360.0718640.54730.293137

\begin{tabular}{lllllllll}
\hline
Partial Autocorrelation Function \tabularnewline
Time lag k & PACF(k) & T-STAT & P-value \tabularnewline
1 & 0.295168 & 2.2479 & 0.014199 \tabularnewline
2 & 0.183682 & 1.3989 & 0.083587 \tabularnewline
3 & 0.260755 & 1.9859 & 0.025892 \tabularnewline
4 & -0.184909 & -1.4082 & 0.082201 \tabularnewline
5 & 0.074528 & 0.5676 & 0.286254 \tabularnewline
6 & 0.254708 & 1.9398 & 0.028636 \tabularnewline
7 & -0.105094 & -0.8004 & 0.213382 \tabularnewline
8 & 0.303876 & 2.3142 & 0.012108 \tabularnewline
9 & -0.101838 & -0.7756 & 0.220575 \tabularnewline
10 & 0.029183 & 0.2222 & 0.41245 \tabularnewline
11 & -0.090946 & -0.6926 & 0.245654 \tabularnewline
12 & -0.363774 & -2.7704 & 0.003755 \tabularnewline
13 & -0.112464 & -0.8565 & 0.197624 \tabularnewline
14 & 0.148233 & 1.1289 & 0.131792 \tabularnewline
15 & 0.177945 & 1.3552 & 0.090306 \tabularnewline
16 & -0.167243 & -1.2737 & 0.103928 \tabularnewline
17 & 0.03368 & 0.2565 & 0.399236 \tabularnewline
18 & 0.018852 & 0.1436 & 0.443167 \tabularnewline
19 & -0.062369 & -0.475 & 0.318288 \tabularnewline
20 & 0.107035 & 0.8152 & 0.209159 \tabularnewline
21 & 0.004182 & 0.0319 & 0.487349 \tabularnewline
22 & -0.198442 & -1.5113 & 0.068072 \tabularnewline
23 & -0.039384 & -0.2999 & 0.382646 \tabularnewline
24 & -0.166009 & -1.2643 & 0.105592 \tabularnewline
25 & -0.089246 & -0.6797 & 0.249706 \tabularnewline
26 & -0.100821 & -0.7678 & 0.222852 \tabularnewline
27 & 0.00512 & 0.039 & 0.484515 \tabularnewline
28 & 0.100505 & 0.7654 & 0.223561 \tabularnewline
29 & 0.027591 & 0.2101 & 0.417154 \tabularnewline
30 & -0.096454 & -0.7346 & 0.232779 \tabularnewline
31 & -0.050381 & -0.3837 & 0.351305 \tabularnewline
32 & 0.044967 & 0.3425 & 0.366621 \tabularnewline
33 & 0.104533 & 0.7961 & 0.21461 \tabularnewline
34 & -0.100287 & -0.7638 & 0.224052 \tabularnewline
35 & 0.080694 & 0.6145 & 0.27063 \tabularnewline
36 & 0.071864 & 0.5473 & 0.293137 \tabularnewline
\hline
\end{tabular}
%Source: https://freestatistics.org/blog/index.php?pk=113335&T=2

[TABLE]
[ROW][C]Partial Autocorrelation Function[/C][/ROW]
[ROW][C]Time lag k[/C][C]PACF(k)[/C][C]T-STAT[/C][C]P-value[/C][/ROW]
[ROW][C]1[/C][C]0.295168[/C][C]2.2479[/C][C]0.014199[/C][/ROW]
[ROW][C]2[/C][C]0.183682[/C][C]1.3989[/C][C]0.083587[/C][/ROW]
[ROW][C]3[/C][C]0.260755[/C][C]1.9859[/C][C]0.025892[/C][/ROW]
[ROW][C]4[/C][C]-0.184909[/C][C]-1.4082[/C][C]0.082201[/C][/ROW]
[ROW][C]5[/C][C]0.074528[/C][C]0.5676[/C][C]0.286254[/C][/ROW]
[ROW][C]6[/C][C]0.254708[/C][C]1.9398[/C][C]0.028636[/C][/ROW]
[ROW][C]7[/C][C]-0.105094[/C][C]-0.8004[/C][C]0.213382[/C][/ROW]
[ROW][C]8[/C][C]0.303876[/C][C]2.3142[/C][C]0.012108[/C][/ROW]
[ROW][C]9[/C][C]-0.101838[/C][C]-0.7756[/C][C]0.220575[/C][/ROW]
[ROW][C]10[/C][C]0.029183[/C][C]0.2222[/C][C]0.41245[/C][/ROW]
[ROW][C]11[/C][C]-0.090946[/C][C]-0.6926[/C][C]0.245654[/C][/ROW]
[ROW][C]12[/C][C]-0.363774[/C][C]-2.7704[/C][C]0.003755[/C][/ROW]
[ROW][C]13[/C][C]-0.112464[/C][C]-0.8565[/C][C]0.197624[/C][/ROW]
[ROW][C]14[/C][C]0.148233[/C][C]1.1289[/C][C]0.131792[/C][/ROW]
[ROW][C]15[/C][C]0.177945[/C][C]1.3552[/C][C]0.090306[/C][/ROW]
[ROW][C]16[/C][C]-0.167243[/C][C]-1.2737[/C][C]0.103928[/C][/ROW]
[ROW][C]17[/C][C]0.03368[/C][C]0.2565[/C][C]0.399236[/C][/ROW]
[ROW][C]18[/C][C]0.018852[/C][C]0.1436[/C][C]0.443167[/C][/ROW]
[ROW][C]19[/C][C]-0.062369[/C][C]-0.475[/C][C]0.318288[/C][/ROW]
[ROW][C]20[/C][C]0.107035[/C][C]0.8152[/C][C]0.209159[/C][/ROW]
[ROW][C]21[/C][C]0.004182[/C][C]0.0319[/C][C]0.487349[/C][/ROW]
[ROW][C]22[/C][C]-0.198442[/C][C]-1.5113[/C][C]0.068072[/C][/ROW]
[ROW][C]23[/C][C]-0.039384[/C][C]-0.2999[/C][C]0.382646[/C][/ROW]
[ROW][C]24[/C][C]-0.166009[/C][C]-1.2643[/C][C]0.105592[/C][/ROW]
[ROW][C]25[/C][C]-0.089246[/C][C]-0.6797[/C][C]0.249706[/C][/ROW]
[ROW][C]26[/C][C]-0.100821[/C][C]-0.7678[/C][C]0.222852[/C][/ROW]
[ROW][C]27[/C][C]0.00512[/C][C]0.039[/C][C]0.484515[/C][/ROW]
[ROW][C]28[/C][C]0.100505[/C][C]0.7654[/C][C]0.223561[/C][/ROW]
[ROW][C]29[/C][C]0.027591[/C][C]0.2101[/C][C]0.417154[/C][/ROW]
[ROW][C]30[/C][C]-0.096454[/C][C]-0.7346[/C][C]0.232779[/C][/ROW]
[ROW][C]31[/C][C]-0.050381[/C][C]-0.3837[/C][C]0.351305[/C][/ROW]
[ROW][C]32[/C][C]0.044967[/C][C]0.3425[/C][C]0.366621[/C][/ROW]
[ROW][C]33[/C][C]0.104533[/C][C]0.7961[/C][C]0.21461[/C][/ROW]
[ROW][C]34[/C][C]-0.100287[/C][C]-0.7638[/C][C]0.224052[/C][/ROW]
[ROW][C]35[/C][C]0.080694[/C][C]0.6145[/C][C]0.27063[/C][/ROW]
[ROW][C]36[/C][C]0.071864[/C][C]0.5473[/C][C]0.293137[/C][/ROW]
[/TABLE]
Source: https://freestatistics.org/blog/index.php?pk=113335&T=2

Globally Unique Identifier (entire table): ba.freestatistics.org/blog/index.php?pk=113335&T=2

As an alternative you can also use a QR Code:  

The GUIDs for individual cells are displayed in the table below:

Partial Autocorrelation Function
Time lag kPACF(k)T-STATP-value
10.2951682.24790.014199
20.1836821.39890.083587
30.2607551.98590.025892
4-0.184909-1.40820.082201
50.0745280.56760.286254
60.2547081.93980.028636
7-0.105094-0.80040.213382
80.3038762.31420.012108
9-0.101838-0.77560.220575
100.0291830.22220.41245
11-0.090946-0.69260.245654
12-0.363774-2.77040.003755
13-0.112464-0.85650.197624
140.1482331.12890.131792
150.1779451.35520.090306
16-0.167243-1.27370.103928
170.033680.25650.399236
180.0188520.14360.443167
19-0.062369-0.4750.318288
200.1070350.81520.209159
210.0041820.03190.487349
22-0.198442-1.51130.068072
23-0.039384-0.29990.382646
24-0.166009-1.26430.105592
25-0.089246-0.67970.249706
26-0.100821-0.76780.222852
270.005120.0390.484515
280.1005050.76540.223561
290.0275910.21010.417154
30-0.096454-0.73460.232779
31-0.050381-0.38370.351305
320.0449670.34250.366621
330.1045330.79610.21461
34-0.100287-0.76380.224052
350.0806940.61450.27063
360.0718640.54730.293137


Parameters (Session):
par1 = 36 ; par2 = 1 ; par3 = 0 ; par4 = 1 ; par5 = 12 ; par6 = White Noise ; par7 = 0.95 ;
Parameters (R input):
par1 = 36 ; par2 = 1 ; par3 = 0 ; par4 = 1 ; par5 = 12 ; par6 = White Noise ; par7 = 0.95 ; par8 = ;
R code (references can be found in the software module):
if (par1 == 'Default') {
par1 = 10*log10(length(x))
} else {
par1 <- as.numeric(par1)
}
par2 <- as.numeric(par2)
par3 <- as.numeric(par3)
par4 <- as.numeric(par4)
par5 <- as.numeric(par5)
if (par6 == 'White Noise') par6 <- 'white' else par6 <- 'ma'
par7 <- as.numeric(par7)
if (par8 != '') par8 <- as.numeric(par8)
ox <- x
if (par8 == '') {
if (par2 == 0) {
x <- log(x)
} else {
x <- (x ^ par2 - 1) / par2
}
} else {
x <- log(x,base=par8)
}
if (par3 > 0) x <- diff(x,lag=1,difference=par3)
if (par4 > 0) x <- diff(x,lag=par5,difference=par4)
bitmap(file='picts.png')
op <- par(mfrow=c(2,1))
plot(ox,type='l',main='Original Time Series',xlab='time',ylab='value')
if (par8=='') {
mytitle <- paste('Working Time Series (lambda=',par2,', d=',par3,', D=',par4,')',sep='')
mysub <- paste('(lambda=',par2,', d=',par3,', D=',par4,', CI=', par7, ', CI type=',par6,')',sep='')
} else {
mytitle <- paste('Working Time Series (base=',par8,', d=',par3,', D=',par4,')',sep='')
mysub <- paste('(base=',par8,', d=',par3,', D=',par4,', CI=', par7, ', CI type=',par6,')',sep='')
}
plot(x,type='l', main=mytitle,xlab='time',ylab='value')
par(op)
dev.off()
bitmap(file='pic1.png')
racf <- acf(x, par1, main='Autocorrelation', xlab='time lag', ylab='ACF', ci.type=par6, ci=par7, sub=mysub)
dev.off()
bitmap(file='pic2.png')
rpacf <- pacf(x,par1,main='Partial Autocorrelation',xlab='lags',ylab='PACF',sub=mysub)
dev.off()
(myacf <- c(racf$acf))
(mypacf <- c(rpacf$acf))
lengthx <- length(x)
sqrtn <- sqrt(lengthx)
load(file='createtable')
a<-table.start()
a<-table.row.start(a)
a<-table.element(a,'Autocorrelation Function',4,TRUE)
a<-table.row.end(a)
a<-table.row.start(a)
a<-table.element(a,'Time lag k',header=TRUE)
a<-table.element(a,hyperlink('basics.htm','ACF(k)','click here for more information about the Autocorrelation Function'),header=TRUE)
a<-table.element(a,'T-STAT',header=TRUE)
a<-table.element(a,'P-value',header=TRUE)
a<-table.row.end(a)
for (i in 2:(par1+1)) {
a<-table.row.start(a)
a<-table.element(a,i-1,header=TRUE)
a<-table.element(a,round(myacf[i],6))
mytstat <- myacf[i]*sqrtn
a<-table.element(a,round(mytstat,4))
a<-table.element(a,round(1-pt(abs(mytstat),lengthx),6))
a<-table.row.end(a)
}
a<-table.end(a)
table.save(a,file='mytable.tab')
a<-table.start()
a<-table.row.start(a)
a<-table.element(a,'Partial Autocorrelation Function',4,TRUE)
a<-table.row.end(a)
a<-table.row.start(a)
a<-table.element(a,'Time lag k',header=TRUE)
a<-table.element(a,hyperlink('basics.htm','PACF(k)','click here for more information about the Partial Autocorrelation Function'),header=TRUE)
a<-table.element(a,'T-STAT',header=TRUE)
a<-table.element(a,'P-value',header=TRUE)
a<-table.row.end(a)
for (i in 1:par1) {
a<-table.row.start(a)
a<-table.element(a,i,header=TRUE)
a<-table.element(a,round(mypacf[i],6))
mytstat <- mypacf[i]*sqrtn
a<-table.element(a,round(mytstat,4))
a<-table.element(a,round(1-pt(abs(mytstat),lengthx),6))
a<-table.row.end(a)
}
a<-table.end(a)
table.save(a,file='mytable1.tab')