Free Statistics

of Irreproducible Research!

Author's title

Author*The author of this computation has been verified*
R Software Modulerwasp_arimabackwardselection.wasp
Title produced by softwareARIMA Backward Selection
Date of computationTue, 21 Dec 2010 11:51:09 +0000
Cite this page as followsStatistical Computations at FreeStatistics.org, Office for Research Development and Education, URL https://freestatistics.org/blog/index.php?v=date/2010/Dec/21/t1292932164rwwg8z1nb65kovu.htm/, Retrieved Thu, 09 May 2024 01:22:12 +0000
Statistical Computations at FreeStatistics.org, Office for Research Development and Education, URL https://freestatistics.org/blog/index.php?pk=113320, Retrieved Thu, 09 May 2024 01:22:12 +0000
QR Codes:

Original text written by user:
IsPrivate?No (this computation is public)
User-defined keywords
Estimated Impact150
Family? (F = Feedback message, R = changed R code, M = changed R Module, P = changed Parameters, D = changed Data)
-     [Univariate Data Series] [data set] [2008-12-01 19:54:57] [b98453cac15ba1066b407e146608df68]
- RMP   [Standard Deviation-Mean Plot] [Unemployment] [2010-11-29 10:34:47] [b98453cac15ba1066b407e146608df68]
- RMP     [ARIMA Backward Selection] [Unemployment] [2010-11-29 17:10:28] [b98453cac15ba1066b407e146608df68]
-   PD      [ARIMA Backward Selection] [ARIMA Backward Se...] [2010-12-03 13:31:09] [1429a1a14191a86916b95357f6de790b]
F   P         [ARIMA Backward Selection] [WS9 Arima Backwar...] [2010-12-07 17:58:14] [abf4ff90b26c6b37be4a30063b404639]
-    D            [ARIMA Backward Selection] [Paper Arima Backw...] [2010-12-21 11:51:09] [33ba4313a043c7c916d0d88da7cd101b] [Current]
Feedback Forum

Post a new message
Dataseries X:
5124
4742
5434
5684
6332
6334
5636
5940
6195
6022
4535
4320
4872
4662
4663
5491
6018
6393
5610
5777
6094
6478
5216
5201
4784
4205
4681
4896
5752
6452
5995
5601
6119
6569
5798
5492
5018
4773
5502
5908
5902
6125
5419
5559
5962
6023
5346
5379
4859
5156
5010
5508
6426
6043
5499
5191
5790
5949
5219
4729


Summary of computational transaction
Raw Inputview raw input (R code)
Raw Outputview raw output of R engine
Computing time10 seconds
R Server'RServer@AstonUniversity' @ vre.aston.ac.uk

\begin{tabular}{lllllllll}
\hline
Summary of computational transaction \tabularnewline
Raw Input & view raw input (R code)  \tabularnewline
Raw Output & view raw output of R engine  \tabularnewline
Computing time & 10 seconds \tabularnewline
R Server & 'RServer@AstonUniversity' @ vre.aston.ac.uk \tabularnewline
\hline
\end{tabular}
%Source: https://freestatistics.org/blog/index.php?pk=113320&T=0

[TABLE]
[ROW][C]Summary of computational transaction[/C][/ROW]
[ROW][C]Raw Input[/C][C]view raw input (R code) [/C][/ROW]
[ROW][C]Raw Output[/C][C]view raw output of R engine [/C][/ROW]
[ROW][C]Computing time[/C][C]10 seconds[/C][/ROW]
[ROW][C]R Server[/C][C]'RServer@AstonUniversity' @ vre.aston.ac.uk[/C][/ROW]
[/TABLE]
Source: https://freestatistics.org/blog/index.php?pk=113320&T=0

Globally Unique Identifier (entire table): ba.freestatistics.org/blog/index.php?pk=113320&T=0

As an alternative you can also use a QR Code:  

The GUIDs for individual cells are displayed in the table below:

Summary of computational transaction
Raw Inputview raw input (R code)
Raw Outputview raw output of R engine
Computing time10 seconds
R Server'RServer@AstonUniversity' @ vre.aston.ac.uk


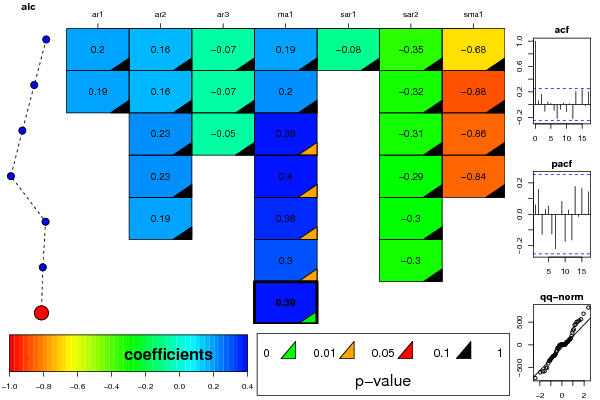
ARIMA Parameter Estimation and Backward Selection
Iterationar1ar2ar3ma1sar1sar2sma1
Estimates ( 1 )0.1980.1597-0.06860.1944-0.0763-0.3516-0.6816
(p-val)(0.8562 )(0.717 )(0.7011 )(0.8586 )(0.8797 )(0.2628 )(0.5144 )
Estimates ( 2 )0.18790.1615-0.0710.20450-0.3161-0.8789
(p-val)(0.8585 )(0.705 )(0.6874 )(0.8458 )(NA )(0.1583 )(0.5273 )
Estimates ( 3 )00.23-0.05260.39120-0.3131-0.8588
(p-val)(NA )(0.1365 )(0.74 )(0.0214 )(NA )(0.1622 )(0.4562 )
Estimates ( 4 )00.225300.39730-0.2863-0.8396
(p-val)(NA )(0.1484 )(NA )(0.0175 )(NA )(0.1766 )(0.363 )
Estimates ( 5 )00.194200.35590-0.29780
(p-val)(NA )(0.2254 )(NA )(0.0247 )(NA )(0.1526 )(NA )
Estimates ( 6 )0000.30030-0.30180
(p-val)(NA )(NA )(NA )(0.0277 )(NA )(0.1535 )(NA )
Estimates ( 7 )0000.3876000
(p-val)(NA )(NA )(NA )(0.0017 )(NA )(NA )(NA )
Estimates ( 8 )NANANANANANANA
(p-val)(NA )(NA )(NA )(NA )(NA )(NA )(NA )
Estimates ( 9 )NANANANANANANA
(p-val)(NA )(NA )(NA )(NA )(NA )(NA )(NA )
Estimates ( 10 )NANANANANANANA
(p-val)(NA )(NA )(NA )(NA )(NA )(NA )(NA )
Estimates ( 11 )NANANANANANANA
(p-val)(NA )(NA )(NA )(NA )(NA )(NA )(NA )
Estimates ( 12 )NANANANANANANA
(p-val)(NA )(NA )(NA )(NA )(NA )(NA )(NA )
Estimates ( 13 )NANANANANANANA
(p-val)(NA )(NA )(NA )(NA )(NA )(NA )(NA )

\begin{tabular}{lllllllll}
\hline
ARIMA Parameter Estimation and Backward Selection \tabularnewline
Iteration & ar1 & ar2 & ar3 & ma1 & sar1 & sar2 & sma1 \tabularnewline
Estimates ( 1 ) & 0.198 & 0.1597 & -0.0686 & 0.1944 & -0.0763 & -0.3516 & -0.6816 \tabularnewline
(p-val) & (0.8562 ) & (0.717 ) & (0.7011 ) & (0.8586 ) & (0.8797 ) & (0.2628 ) & (0.5144 ) \tabularnewline
Estimates ( 2 ) & 0.1879 & 0.1615 & -0.071 & 0.2045 & 0 & -0.3161 & -0.8789 \tabularnewline
(p-val) & (0.8585 ) & (0.705 ) & (0.6874 ) & (0.8458 ) & (NA ) & (0.1583 ) & (0.5273 ) \tabularnewline
Estimates ( 3 ) & 0 & 0.23 & -0.0526 & 0.3912 & 0 & -0.3131 & -0.8588 \tabularnewline
(p-val) & (NA ) & (0.1365 ) & (0.74 ) & (0.0214 ) & (NA ) & (0.1622 ) & (0.4562 ) \tabularnewline
Estimates ( 4 ) & 0 & 0.2253 & 0 & 0.3973 & 0 & -0.2863 & -0.8396 \tabularnewline
(p-val) & (NA ) & (0.1484 ) & (NA ) & (0.0175 ) & (NA ) & (0.1766 ) & (0.363 ) \tabularnewline
Estimates ( 5 ) & 0 & 0.1942 & 0 & 0.3559 & 0 & -0.2978 & 0 \tabularnewline
(p-val) & (NA ) & (0.2254 ) & (NA ) & (0.0247 ) & (NA ) & (0.1526 ) & (NA ) \tabularnewline
Estimates ( 6 ) & 0 & 0 & 0 & 0.3003 & 0 & -0.3018 & 0 \tabularnewline
(p-val) & (NA ) & (NA ) & (NA ) & (0.0277 ) & (NA ) & (0.1535 ) & (NA ) \tabularnewline
Estimates ( 7 ) & 0 & 0 & 0 & 0.3876 & 0 & 0 & 0 \tabularnewline
(p-val) & (NA ) & (NA ) & (NA ) & (0.0017 ) & (NA ) & (NA ) & (NA ) \tabularnewline
Estimates ( 8 ) & NA & NA & NA & NA & NA & NA & NA \tabularnewline
(p-val) & (NA ) & (NA ) & (NA ) & (NA ) & (NA ) & (NA ) & (NA ) \tabularnewline
Estimates ( 9 ) & NA & NA & NA & NA & NA & NA & NA \tabularnewline
(p-val) & (NA ) & (NA ) & (NA ) & (NA ) & (NA ) & (NA ) & (NA ) \tabularnewline
Estimates ( 10 ) & NA & NA & NA & NA & NA & NA & NA \tabularnewline
(p-val) & (NA ) & (NA ) & (NA ) & (NA ) & (NA ) & (NA ) & (NA ) \tabularnewline
Estimates ( 11 ) & NA & NA & NA & NA & NA & NA & NA \tabularnewline
(p-val) & (NA ) & (NA ) & (NA ) & (NA ) & (NA ) & (NA ) & (NA ) \tabularnewline
Estimates ( 12 ) & NA & NA & NA & NA & NA & NA & NA \tabularnewline
(p-val) & (NA ) & (NA ) & (NA ) & (NA ) & (NA ) & (NA ) & (NA ) \tabularnewline
Estimates ( 13 ) & NA & NA & NA & NA & NA & NA & NA \tabularnewline
(p-val) & (NA ) & (NA ) & (NA ) & (NA ) & (NA ) & (NA ) & (NA ) \tabularnewline
\hline
\end{tabular}
%Source: https://freestatistics.org/blog/index.php?pk=113320&T=1

[TABLE]
[ROW][C]ARIMA Parameter Estimation and Backward Selection[/C][/ROW]
[ROW][C]Iteration[/C][C]ar1[/C][C]ar2[/C][C]ar3[/C][C]ma1[/C][C]sar1[/C][C]sar2[/C][C]sma1[/C][/ROW]
[ROW][C]Estimates ( 1 )[/C][C]0.198[/C][C]0.1597[/C][C]-0.0686[/C][C]0.1944[/C][C]-0.0763[/C][C]-0.3516[/C][C]-0.6816[/C][/ROW]
[ROW][C](p-val)[/C][C](0.8562 )[/C][C](0.717 )[/C][C](0.7011 )[/C][C](0.8586 )[/C][C](0.8797 )[/C][C](0.2628 )[/C][C](0.5144 )[/C][/ROW]
[ROW][C]Estimates ( 2 )[/C][C]0.1879[/C][C]0.1615[/C][C]-0.071[/C][C]0.2045[/C][C]0[/C][C]-0.3161[/C][C]-0.8789[/C][/ROW]
[ROW][C](p-val)[/C][C](0.8585 )[/C][C](0.705 )[/C][C](0.6874 )[/C][C](0.8458 )[/C][C](NA )[/C][C](0.1583 )[/C][C](0.5273 )[/C][/ROW]
[ROW][C]Estimates ( 3 )[/C][C]0[/C][C]0.23[/C][C]-0.0526[/C][C]0.3912[/C][C]0[/C][C]-0.3131[/C][C]-0.8588[/C][/ROW]
[ROW][C](p-val)[/C][C](NA )[/C][C](0.1365 )[/C][C](0.74 )[/C][C](0.0214 )[/C][C](NA )[/C][C](0.1622 )[/C][C](0.4562 )[/C][/ROW]
[ROW][C]Estimates ( 4 )[/C][C]0[/C][C]0.2253[/C][C]0[/C][C]0.3973[/C][C]0[/C][C]-0.2863[/C][C]-0.8396[/C][/ROW]
[ROW][C](p-val)[/C][C](NA )[/C][C](0.1484 )[/C][C](NA )[/C][C](0.0175 )[/C][C](NA )[/C][C](0.1766 )[/C][C](0.363 )[/C][/ROW]
[ROW][C]Estimates ( 5 )[/C][C]0[/C][C]0.1942[/C][C]0[/C][C]0.3559[/C][C]0[/C][C]-0.2978[/C][C]0[/C][/ROW]
[ROW][C](p-val)[/C][C](NA )[/C][C](0.2254 )[/C][C](NA )[/C][C](0.0247 )[/C][C](NA )[/C][C](0.1526 )[/C][C](NA )[/C][/ROW]
[ROW][C]Estimates ( 6 )[/C][C]0[/C][C]0[/C][C]0[/C][C]0.3003[/C][C]0[/C][C]-0.3018[/C][C]0[/C][/ROW]
[ROW][C](p-val)[/C][C](NA )[/C][C](NA )[/C][C](NA )[/C][C](0.0277 )[/C][C](NA )[/C][C](0.1535 )[/C][C](NA )[/C][/ROW]
[ROW][C]Estimates ( 7 )[/C][C]0[/C][C]0[/C][C]0[/C][C]0.3876[/C][C]0[/C][C]0[/C][C]0[/C][/ROW]
[ROW][C](p-val)[/C][C](NA )[/C][C](NA )[/C][C](NA )[/C][C](0.0017 )[/C][C](NA )[/C][C](NA )[/C][C](NA )[/C][/ROW]
[ROW][C]Estimates ( 8 )[/C][C]NA[/C][C]NA[/C][C]NA[/C][C]NA[/C][C]NA[/C][C]NA[/C][C]NA[/C][/ROW]
[ROW][C](p-val)[/C][C](NA )[/C][C](NA )[/C][C](NA )[/C][C](NA )[/C][C](NA )[/C][C](NA )[/C][C](NA )[/C][/ROW]
[ROW][C]Estimates ( 9 )[/C][C]NA[/C][C]NA[/C][C]NA[/C][C]NA[/C][C]NA[/C][C]NA[/C][C]NA[/C][/ROW]
[ROW][C](p-val)[/C][C](NA )[/C][C](NA )[/C][C](NA )[/C][C](NA )[/C][C](NA )[/C][C](NA )[/C][C](NA )[/C][/ROW]
[ROW][C]Estimates ( 10 )[/C][C]NA[/C][C]NA[/C][C]NA[/C][C]NA[/C][C]NA[/C][C]NA[/C][C]NA[/C][/ROW]
[ROW][C](p-val)[/C][C](NA )[/C][C](NA )[/C][C](NA )[/C][C](NA )[/C][C](NA )[/C][C](NA )[/C][C](NA )[/C][/ROW]
[ROW][C]Estimates ( 11 )[/C][C]NA[/C][C]NA[/C][C]NA[/C][C]NA[/C][C]NA[/C][C]NA[/C][C]NA[/C][/ROW]
[ROW][C](p-val)[/C][C](NA )[/C][C](NA )[/C][C](NA )[/C][C](NA )[/C][C](NA )[/C][C](NA )[/C][C](NA )[/C][/ROW]
[ROW][C]Estimates ( 12 )[/C][C]NA[/C][C]NA[/C][C]NA[/C][C]NA[/C][C]NA[/C][C]NA[/C][C]NA[/C][/ROW]
[ROW][C](p-val)[/C][C](NA )[/C][C](NA )[/C][C](NA )[/C][C](NA )[/C][C](NA )[/C][C](NA )[/C][C](NA )[/C][/ROW]
[ROW][C]Estimates ( 13 )[/C][C]NA[/C][C]NA[/C][C]NA[/C][C]NA[/C][C]NA[/C][C]NA[/C][C]NA[/C][/ROW]
[ROW][C](p-val)[/C][C](NA )[/C][C](NA )[/C][C](NA )[/C][C](NA )[/C][C](NA )[/C][C](NA )[/C][C](NA )[/C][/ROW]
[/TABLE]
Source: https://freestatistics.org/blog/index.php?pk=113320&T=1

Globally Unique Identifier (entire table): ba.freestatistics.org/blog/index.php?pk=113320&T=1

As an alternative you can also use a QR Code:  

The GUIDs for individual cells are displayed in the table below:

ARIMA Parameter Estimation and Backward Selection
Iterationar1ar2ar3ma1sar1sar2sma1
Estimates ( 1 )0.1980.1597-0.06860.1944-0.0763-0.3516-0.6816
(p-val)(0.8562 )(0.717 )(0.7011 )(0.8586 )(0.8797 )(0.2628 )(0.5144 )
Estimates ( 2 )0.18790.1615-0.0710.20450-0.3161-0.8789
(p-val)(0.8585 )(0.705 )(0.6874 )(0.8458 )(NA )(0.1583 )(0.5273 )
Estimates ( 3 )00.23-0.05260.39120-0.3131-0.8588
(p-val)(NA )(0.1365 )(0.74 )(0.0214 )(NA )(0.1622 )(0.4562 )
Estimates ( 4 )00.225300.39730-0.2863-0.8396
(p-val)(NA )(0.1484 )(NA )(0.0175 )(NA )(0.1766 )(0.363 )
Estimates ( 5 )00.194200.35590-0.29780
(p-val)(NA )(0.2254 )(NA )(0.0247 )(NA )(0.1526 )(NA )
Estimates ( 6 )0000.30030-0.30180
(p-val)(NA )(NA )(NA )(0.0277 )(NA )(0.1535 )(NA )
Estimates ( 7 )0000.3876000
(p-val)(NA )(NA )(NA )(0.0017 )(NA )(NA )(NA )
Estimates ( 8 )NANANANANANANA
(p-val)(NA )(NA )(NA )(NA )(NA )(NA )(NA )
Estimates ( 9 )NANANANANANANA
(p-val)(NA )(NA )(NA )(NA )(NA )(NA )(NA )
Estimates ( 10 )NANANANANANANA
(p-val)(NA )(NA )(NA )(NA )(NA )(NA )(NA )
Estimates ( 11 )NANANANANANANA
(p-val)(NA )(NA )(NA )(NA )(NA )(NA )(NA )
Estimates ( 12 )NANANANANANANA
(p-val)(NA )(NA )(NA )(NA )(NA )(NA )(NA )
Estimates ( 13 )NANANANANANANA
(p-val)(NA )(NA )(NA )(NA )(NA )(NA )(NA )


Estimated ARIMA Residuals
Value
4.3199959111659
-230.103093973988
-10.0590002469472
-731.80035243483
35.6597612949004
-310.066687557149
149.35191010535
-69.6333174373496
-134.491829613721
-55.907550164984
451.527138843236
513.670811019043
685.686977200568
-289.784480404842
-348.677813697372
121.86026247368
-603.846951576562
-72.2793623054736
77.955707239468
343.645715921497
-270.976824754402
105.203235344117
55.1712969025676
538.301861680489
90.6913274339309
131.387768387676
504.383760610591
436.913898691769
822.566785732798
-191.748859831139
-251.618926056803
-508.293337397624
61.4335410616221
-205.926461870798
-346.554457369001
-142.427526106073
195.636152608492
-244.299983398158
318.441053594696
-582.185432408912
-404.74881326139
565.258955397677
-233.923776571492
266.425716917341
-501.112591375606
-13.9876193007694
-42.3378256770963
61.3496992112993
-580.602809369575

\begin{tabular}{lllllllll}
\hline
Estimated ARIMA Residuals \tabularnewline
Value \tabularnewline
4.3199959111659 \tabularnewline
-230.103093973988 \tabularnewline
-10.0590002469472 \tabularnewline
-731.80035243483 \tabularnewline
35.6597612949004 \tabularnewline
-310.066687557149 \tabularnewline
149.35191010535 \tabularnewline
-69.6333174373496 \tabularnewline
-134.491829613721 \tabularnewline
-55.907550164984 \tabularnewline
451.527138843236 \tabularnewline
513.670811019043 \tabularnewline
685.686977200568 \tabularnewline
-289.784480404842 \tabularnewline
-348.677813697372 \tabularnewline
121.86026247368 \tabularnewline
-603.846951576562 \tabularnewline
-72.2793623054736 \tabularnewline
77.955707239468 \tabularnewline
343.645715921497 \tabularnewline
-270.976824754402 \tabularnewline
105.203235344117 \tabularnewline
55.1712969025676 \tabularnewline
538.301861680489 \tabularnewline
90.6913274339309 \tabularnewline
131.387768387676 \tabularnewline
504.383760610591 \tabularnewline
436.913898691769 \tabularnewline
822.566785732798 \tabularnewline
-191.748859831139 \tabularnewline
-251.618926056803 \tabularnewline
-508.293337397624 \tabularnewline
61.4335410616221 \tabularnewline
-205.926461870798 \tabularnewline
-346.554457369001 \tabularnewline
-142.427526106073 \tabularnewline
195.636152608492 \tabularnewline
-244.299983398158 \tabularnewline
318.441053594696 \tabularnewline
-582.185432408912 \tabularnewline
-404.74881326139 \tabularnewline
565.258955397677 \tabularnewline
-233.923776571492 \tabularnewline
266.425716917341 \tabularnewline
-501.112591375606 \tabularnewline
-13.9876193007694 \tabularnewline
-42.3378256770963 \tabularnewline
61.3496992112993 \tabularnewline
-580.602809369575 \tabularnewline
\hline
\end{tabular}
%Source: https://freestatistics.org/blog/index.php?pk=113320&T=2

[TABLE]
[ROW][C]Estimated ARIMA Residuals[/C][/ROW]
[ROW][C]Value[/C][/ROW]
[ROW][C]4.3199959111659[/C][/ROW]
[ROW][C]-230.103093973988[/C][/ROW]
[ROW][C]-10.0590002469472[/C][/ROW]
[ROW][C]-731.80035243483[/C][/ROW]
[ROW][C]35.6597612949004[/C][/ROW]
[ROW][C]-310.066687557149[/C][/ROW]
[ROW][C]149.35191010535[/C][/ROW]
[ROW][C]-69.6333174373496[/C][/ROW]
[ROW][C]-134.491829613721[/C][/ROW]
[ROW][C]-55.907550164984[/C][/ROW]
[ROW][C]451.527138843236[/C][/ROW]
[ROW][C]513.670811019043[/C][/ROW]
[ROW][C]685.686977200568[/C][/ROW]
[ROW][C]-289.784480404842[/C][/ROW]
[ROW][C]-348.677813697372[/C][/ROW]
[ROW][C]121.86026247368[/C][/ROW]
[ROW][C]-603.846951576562[/C][/ROW]
[ROW][C]-72.2793623054736[/C][/ROW]
[ROW][C]77.955707239468[/C][/ROW]
[ROW][C]343.645715921497[/C][/ROW]
[ROW][C]-270.976824754402[/C][/ROW]
[ROW][C]105.203235344117[/C][/ROW]
[ROW][C]55.1712969025676[/C][/ROW]
[ROW][C]538.301861680489[/C][/ROW]
[ROW][C]90.6913274339309[/C][/ROW]
[ROW][C]131.387768387676[/C][/ROW]
[ROW][C]504.383760610591[/C][/ROW]
[ROW][C]436.913898691769[/C][/ROW]
[ROW][C]822.566785732798[/C][/ROW]
[ROW][C]-191.748859831139[/C][/ROW]
[ROW][C]-251.618926056803[/C][/ROW]
[ROW][C]-508.293337397624[/C][/ROW]
[ROW][C]61.4335410616221[/C][/ROW]
[ROW][C]-205.926461870798[/C][/ROW]
[ROW][C]-346.554457369001[/C][/ROW]
[ROW][C]-142.427526106073[/C][/ROW]
[ROW][C]195.636152608492[/C][/ROW]
[ROW][C]-244.299983398158[/C][/ROW]
[ROW][C]318.441053594696[/C][/ROW]
[ROW][C]-582.185432408912[/C][/ROW]
[ROW][C]-404.74881326139[/C][/ROW]
[ROW][C]565.258955397677[/C][/ROW]
[ROW][C]-233.923776571492[/C][/ROW]
[ROW][C]266.425716917341[/C][/ROW]
[ROW][C]-501.112591375606[/C][/ROW]
[ROW][C]-13.9876193007694[/C][/ROW]
[ROW][C]-42.3378256770963[/C][/ROW]
[ROW][C]61.3496992112993[/C][/ROW]
[ROW][C]-580.602809369575[/C][/ROW]
[/TABLE]
Source: https://freestatistics.org/blog/index.php?pk=113320&T=2

Globally Unique Identifier (entire table): ba.freestatistics.org/blog/index.php?pk=113320&T=2

As an alternative you can also use a QR Code:  

The GUIDs for individual cells are displayed in the table below:

Estimated ARIMA Residuals
Value
4.3199959111659
-230.103093973988
-10.0590002469472
-731.80035243483
35.6597612949004
-310.066687557149
149.35191010535
-69.6333174373496
-134.491829613721
-55.907550164984
451.527138843236
513.670811019043
685.686977200568
-289.784480404842
-348.677813697372
121.86026247368
-603.846951576562
-72.2793623054736
77.955707239468
343.645715921497
-270.976824754402
105.203235344117
55.1712969025676
538.301861680489
90.6913274339309
131.387768387676
504.383760610591
436.913898691769
822.566785732798
-191.748859831139
-251.618926056803
-508.293337397624
61.4335410616221
-205.926461870798
-346.554457369001
-142.427526106073
195.636152608492
-244.299983398158
318.441053594696
-582.185432408912
-404.74881326139
565.258955397677
-233.923776571492
266.425716917341
-501.112591375606
-13.9876193007694
-42.3378256770963
61.3496992112993
-580.602809369575


Parameters (Session):
par1 = FALSE ; par2 = 1 ; par3 = 0 ; par4 = 1 ; par5 = 12 ; par6 = 3 ; par7 = 1 ; par8 = 2 ; par9 = 1 ;
Parameters (R input):
par1 = FALSE ; par2 = 1 ; par3 = 0 ; par4 = 1 ; par5 = 12 ; par6 = 3 ; par7 = 1 ; par8 = 2 ; par9 = 1 ;
R code (references can be found in the software module):
library(lattice)
if (par1 == 'TRUE') par1 <- TRUE
if (par1 == 'FALSE') par1 <- FALSE
par2 <- as.numeric(par2) #Box-Cox lambda transformation parameter
par3 <- as.numeric(par3) #degree of non-seasonal differencing
par4 <- as.numeric(par4) #degree of seasonal differencing
par5 <- as.numeric(par5) #seasonal period
par6 <- as.numeric(par6) #degree (p) of the non-seasonal AR(p) polynomial
par7 <- as.numeric(par7) #degree (q) of the non-seasonal MA(q) polynomial
par8 <- as.numeric(par8) #degree (P) of the seasonal AR(P) polynomial
par9 <- as.numeric(par9) #degree (Q) of the seasonal MA(Q) polynomial
armaGR <- function(arima.out, names, n){
try1 <- arima.out$coef
try2 <- sqrt(diag(arima.out$var.coef))
try.data.frame <- data.frame(matrix(NA,ncol=4,nrow=length(names)))
dimnames(try.data.frame) <- list(names,c('coef','std','tstat','pv'))
try.data.frame[,1] <- try1
for(i in 1:length(try2)) try.data.frame[which(rownames(try.data.frame)==names(try2)[i]),2] <- try2[i]
try.data.frame[,3] <- try.data.frame[,1] / try.data.frame[,2]
try.data.frame[,4] <- round((1-pt(abs(try.data.frame[,3]),df=n-(length(try2)+1)))*2,5)
vector <- rep(NA,length(names))
vector[is.na(try.data.frame[,4])] <- 0
maxi <- which.max(try.data.frame[,4])
continue <- max(try.data.frame[,4],na.rm=TRUE) > .05
vector[maxi] <- 0
list(summary=try.data.frame,next.vector=vector,continue=continue)
}
arimaSelect <- function(series, order=c(13,0,0), seasonal=list(order=c(2,0,0),period=12), include.mean=F){
nrc <- order[1]+order[3]+seasonal$order[1]+seasonal$order[3]
coeff <- matrix(NA, nrow=nrc*2, ncol=nrc)
pval <- matrix(NA, nrow=nrc*2, ncol=nrc)
mylist <- rep(list(NULL), nrc)
names <- NULL
if(order[1] > 0) names <- paste('ar',1:order[1],sep='')
if(order[3] > 0) names <- c( names , paste('ma',1:order[3],sep='') )
if(seasonal$order[1] > 0) names <- c(names, paste('sar',1:seasonal$order[1],sep=''))
if(seasonal$order[3] > 0) names <- c(names, paste('sma',1:seasonal$order[3],sep=''))
arima.out <- arima(series, order=order, seasonal=seasonal, include.mean=include.mean, method='ML')
mylist[[1]] <- arima.out
last.arma <- armaGR(arima.out, names, length(series))
mystop <- FALSE
i <- 1
coeff[i,] <- last.arma[[1]][,1]
pval [i,] <- last.arma[[1]][,4]
i <- 2
aic <- arima.out$aic
while(!mystop){
mylist[[i]] <- arima.out
arima.out <- arima(series, order=order, seasonal=seasonal, include.mean=include.mean, method='ML', fixed=last.arma$next.vector)
aic <- c(aic, arima.out$aic)
last.arma <- armaGR(arima.out, names, length(series))
mystop <- !last.arma$continue
coeff[i,] <- last.arma[[1]][,1]
pval [i,] <- last.arma[[1]][,4]
i <- i+1
}
list(coeff, pval, mylist, aic=aic)
}
arimaSelectplot <- function(arimaSelect.out,noms,choix){
noms <- names(arimaSelect.out[[3]][[1]]$coef)
coeff <- arimaSelect.out[[1]]
k <- min(which(is.na(coeff[,1])))-1
coeff <- coeff[1:k,]
pval <- arimaSelect.out[[2]][1:k,]
aic <- arimaSelect.out$aic[1:k]
coeff[coeff==0] <- NA
n <- ncol(coeff)
if(missing(choix)) choix <- k
layout(matrix(c(1,1,1,2,
3,3,3,2,
3,3,3,4,
5,6,7,7),nr=4),
widths=c(10,35,45,15),
heights=c(30,30,15,15))
couleurs <- rainbow(75)[1:50]#(50)
ticks <- pretty(coeff)
par(mar=c(1,1,3,1))
plot(aic,k:1-.5,type='o',pch=21,bg='blue',cex=2,axes=F,lty=2,xpd=NA)
points(aic[choix],k-choix+.5,pch=21,cex=4,bg=2,xpd=NA)
title('aic',line=2)
par(mar=c(3,0,0,0))
plot(0,axes=F,xlab='',ylab='',xlim=range(ticks),ylim=c(.1,1))
rect(xleft = min(ticks) + (0:49)/50*(max(ticks)-min(ticks)),
xright = min(ticks) + (1:50)/50*(max(ticks)-min(ticks)),
ytop = rep(1,50),
ybottom= rep(0,50),col=couleurs,border=NA)
axis(1,ticks)
rect(xleft=min(ticks),xright=max(ticks),ytop=1,ybottom=0)
text(mean(coeff,na.rm=T),.5,'coefficients',cex=2,font=2)
par(mar=c(1,1,3,1))
image(1:n,1:k,t(coeff[k:1,]),axes=F,col=couleurs,zlim=range(ticks))
for(i in 1:n) for(j in 1:k) if(!is.na(coeff[j,i])) {
if(pval[j,i]<.01) symb = 'green'
else if( (pval[j,i]<.05) & (pval[j,i]>=.01)) symb = 'orange'
else if( (pval[j,i]<.1) & (pval[j,i]>=.05)) symb = 'red'
else symb = 'black'
polygon(c(i+.5 ,i+.2 ,i+.5 ,i+.5),
c(k-j+0.5,k-j+0.5,k-j+0.8,k-j+0.5),
col=symb)
if(j==choix) {
rect(xleft=i-.5,
xright=i+.5,
ybottom=k-j+1.5,
ytop=k-j+.5,
lwd=4)
text(i,
k-j+1,
round(coeff[j,i],2),
cex=1.2,
font=2)
}
else{
rect(xleft=i-.5,xright=i+.5,ybottom=k-j+1.5,ytop=k-j+.5)
text(i,k-j+1,round(coeff[j,i],2),cex=1.2,font=1)
}
}
axis(3,1:n,noms)
par(mar=c(0.5,0,0,0.5))
plot(0,axes=F,xlab='',ylab='',type='n',xlim=c(0,8),ylim=c(-.2,.8))
cols <- c('green','orange','red','black')
niv <- c('0','0.01','0.05','0.1')
for(i in 0:3){
polygon(c(1+2*i ,1+2*i ,1+2*i-.5 ,1+2*i),
c(.4 ,.7 , .4 , .4),
col=cols[i+1])
text(2*i,0.5,niv[i+1],cex=1.5)
}
text(8,.5,1,cex=1.5)
text(4,0,'p-value',cex=2)
box()
residus <- arimaSelect.out[[3]][[choix]]$res
par(mar=c(1,2,4,1))
acf(residus,main='')
title('acf',line=.5)
par(mar=c(1,2,4,1))
pacf(residus,main='')
title('pacf',line=.5)
par(mar=c(2,2,4,1))
qqnorm(residus,main='')
title('qq-norm',line=.5)
qqline(residus)
residus
}
if (par2 == 0) x <- log(x)
if (par2 != 0) x <- x^par2
(selection <- arimaSelect(x, order=c(par6,par3,par7), seasonal=list(order=c(par8,par4,par9), period=par5)))
bitmap(file='test1.png')
resid <- arimaSelectplot(selection)
dev.off()
resid
bitmap(file='test2.png')
acf(resid,length(resid)/2, main='Residual Autocorrelation Function')
dev.off()
bitmap(file='test3.png')
pacf(resid,length(resid)/2, main='Residual Partial Autocorrelation Function')
dev.off()
bitmap(file='test4.png')
cpgram(resid, main='Residual Cumulative Periodogram')
dev.off()
bitmap(file='test5.png')
hist(resid, main='Residual Histogram', xlab='values of Residuals')
dev.off()
bitmap(file='test6.png')
densityplot(~resid,col='black',main='Residual Density Plot', xlab='values of Residuals')
dev.off()
bitmap(file='test7.png')
qqnorm(resid, main='Residual Normal Q-Q Plot')
qqline(resid)
dev.off()
ncols <- length(selection[[1]][1,])
nrows <- length(selection[[2]][,1])-1
load(file='createtable')
a<-table.start()
a<-table.row.start(a)
a<-table.element(a,'ARIMA Parameter Estimation and Backward Selection', ncols+1,TRUE)
a<-table.row.end(a)
a<-table.row.start(a)
a<-table.element(a,'Iteration', header=TRUE)
for (i in 1:ncols) {
a<-table.element(a,names(selection[[3]][[1]]$coef)[i],header=TRUE)
}
a<-table.row.end(a)
for (j in 1:nrows) {
a<-table.row.start(a)
mydum <- 'Estimates ('
mydum <- paste(mydum,j)
mydum <- paste(mydum,')')
a<-table.element(a,mydum, header=TRUE)
for (i in 1:ncols) {
a<-table.element(a,round(selection[[1]][j,i],4))
}
a<-table.row.end(a)
a<-table.row.start(a)
a<-table.element(a,'(p-val)', header=TRUE)
for (i in 1:ncols) {
mydum <- '('
mydum <- paste(mydum,round(selection[[2]][j,i],4),sep='')
mydum <- paste(mydum,')')
a<-table.element(a,mydum)
}
a<-table.row.end(a)
}
a<-table.end(a)
table.save(a,file='mytable.tab')
a<-table.start()
a<-table.row.start(a)
a<-table.element(a,'Estimated ARIMA Residuals', 1,TRUE)
a<-table.row.end(a)
a<-table.row.start(a)
a<-table.element(a,'Value', 1,TRUE)
a<-table.row.end(a)
for (i in (par4*par5+par3):length(resid)) {
a<-table.row.start(a)
a<-table.element(a,resid[i])
a<-table.row.end(a)
}
a<-table.end(a)
table.save(a,file='mytable1.tab')