SMP BRU Passengers | ||||||||||||||||||||||||||||||||||||||||||||||||||||||||||||||||
| *The author of this computation has been verified* | ||||||||||||||||||||||||||||||||||||||||||||||||||||||||||||||||
| R Software Module: /rwasp_smp.wasp (opens new window with default values) | ||||||||||||||||||||||||||||||||||||||||||||||||||||||||||||||||
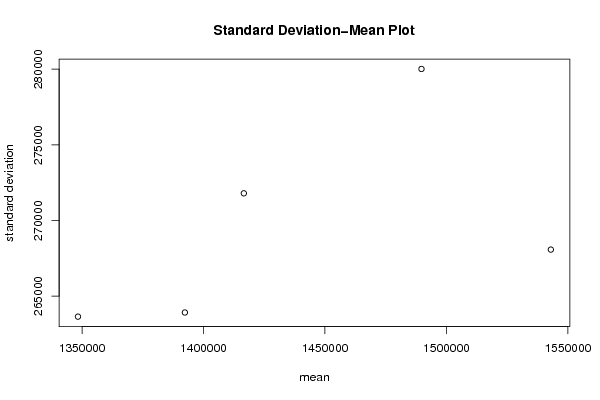
| Title produced by software: Standard Deviation-Mean Plot | ||||||||||||||||||||||||||||||||||||||||||||||||||||||||||||||||
| Date of computation: Sun, 19 Dec 2010 17:02:21 +0000 | ||||||||||||||||||||||||||||||||||||||||||||||||||||||||||||||||
| Cite this page as follows: | ||||||||||||||||||||||||||||||||||||||||||||||||||||||||||||||||
| Statistical Computations at FreeStatistics.org, Office for Research Development and Education, URL http://www.freestatistics.org/blog/date/2010/Dec/19/t12927782735bvu9dp2uptr8rp.htm/, Retrieved Sun, 19 Dec 2010 18:04:34 +0100 | ||||||||||||||||||||||||||||||||||||||||||||||||||||||||||||||||
| BibTeX entries for LaTeX users: | ||||||||||||||||||||||||||||||||||||||||||||||||||||||||||||||||
@Manual{KEY,
    author = {{YOUR NAME}},
    publisher = {Office for Research Development and Education},
    title = {Statistical Computations at FreeStatistics.org, URL http://www.freestatistics.org/blog/date/2010/Dec/19/t12927782735bvu9dp2uptr8rp.htm/},
    year = {2010},
}
@Manual{R,
    title = {R: A Language and Environment for Statistical Computing},
    author = {{R Development Core Team}},
    organization = {R Foundation for Statistical Computing},
    address = {Vienna, Austria},
    year = {2010},
    note = {{ISBN} 3-900051-07-0},
    url = {http://www.R-project.org},
}
| ||||||||||||||||||||||||||||||||||||||||||||||||||||||||||||||||
| Original text written by user: | ||||||||||||||||||||||||||||||||||||||||||||||||||||||||||||||||
| IsPrivate? | ||||||||||||||||||||||||||||||||||||||||||||||||||||||||||||||||
| No (this computation is public) | ||||||||||||||||||||||||||||||||||||||||||||||||||||||||||||||||
| User-defined keywords: | ||||||||||||||||||||||||||||||||||||||||||||||||||||||||||||||||
| Dataseries X: | ||||||||||||||||||||||||||||||||||||||||||||||||||||||||||||||||
| » Textbox « » Textfile « » CSV « | ||||||||||||||||||||||||||||||||||||||||||||||||||||||||||||||||
| 989236 1008380 1207763 1368839 1469798 1498721 1761769 1653214 1599104 1421179 1163995 1037735 1015407 1039210 1258049 1469445 1552346 1549144 1785895 1662335 1629440 1467430 1202209 1076982 1039367 1063449 1335135 1491602 1591972 1641248 1898849 1798580 1762444 1622044 1368955 1262973 1195650 1269530 1479279 1607819 1712466 1721766 1949843 1821326 1757802 1590367 1260647 1149235 1016367 1027885 1262159 1520854 1544144 1564709 1821776 1741365 1623386 1498658 1241822 1136029 | ||||||||||||||||||||||||||||||||||||||||||||||||||||||||||||||||
| Output produced by software: | ||||||||||||||||||||||||||||||||||||||||||||||||||||||||||||||||
| ||||||||||||||||||||||||||||||||||||||||||||||||||||||||||||||||
| Charts produced by software: | ||||||||||||||||||||||||||||||||||||||||||||||||||||||||||||||||
| ||||||||||||||||||||||||||||||||||||||||||||||||||||||||||||||||
| Parameters (Session): | ||||||||||||||||||||||||||||||||||||||||||||||||||||||||||||||||
| par1 = 12 ; | ||||||||||||||||||||||||||||||||||||||||||||||||||||||||||||||||
| Parameters (R input): | ||||||||||||||||||||||||||||||||||||||||||||||||||||||||||||||||
| par1 = 12 ; | ||||||||||||||||||||||||||||||||||||||||||||||||||||||||||||||||
| R code (references can be found in the software module): | ||||||||||||||||||||||||||||||||||||||||||||||||||||||||||||||||
| par1 <- as.numeric(par1)
(n <- length(x)) (np <- floor(n / par1)) arr <- array(NA,dim=c(par1,np)) j <- 0 k <- 1 for (i in 1:(np*par1)) { j = j + 1 arr[j,k] <- x[i] if (j == par1) { j = 0 k=k+1 } } arr arr.mean <- array(NA,dim=np) arr.sd <- array(NA,dim=np) arr.range <- array(NA,dim=np) for (j in 1:np) { arr.mean[j] <- mean(arr[,j],na.rm=TRUE) arr.sd[j] <- sd(arr[,j],na.rm=TRUE) arr.range[j] <- max(arr[,j],na.rm=TRUE) - min(arr[,j],na.rm=TRUE) } arr.mean arr.sd arr.range (lm1 <- lm(arr.sd~arr.mean)) (lnlm1 <- lm(log(arr.sd)~log(arr.mean))) (lm2 <- lm(arr.range~arr.mean)) bitmap(file='test1.png') plot(arr.mean,arr.sd,main='Standard Deviation-Mean Plot',xlab='mean',ylab='standard deviation') dev.off() bitmap(file='test2.png') plot(arr.mean,arr.range,main='Range-Mean Plot',xlab='mean',ylab='range') dev.off() load(file='createtable') a<-table.start() a<-table.row.start(a) a<-table.element(a,'Standard Deviation-Mean Plot',4,TRUE) a<-table.row.end(a) a<-table.row.start(a) a<-table.element(a,'Section',header=TRUE) a<-table.element(a,'Mean',header=TRUE) a<-table.element(a,'Standard Deviation',header=TRUE) a<-table.element(a,'Range',header=TRUE) a<-table.row.end(a) for (j in 1:np) { a<-table.row.start(a) a<-table.element(a,j,header=TRUE) a<-table.element(a,arr.mean[j]) a<-table.element(a,arr.sd[j] ) a<-table.element(a,arr.range[j] ) a<-table.row.end(a) } a<-table.end(a) table.save(a,file='mytable.tab') a<-table.start() a<-table.row.start(a) a<-table.element(a,'Regression: S.E.(k) = alpha + beta * Mean(k)',2,TRUE) a<-table.row.end(a) a<-table.row.start(a) a<-table.element(a,'alpha',header=TRUE) a<-table.element(a,lm1$coefficients[[1]]) a<-table.row.end(a) a<-table.row.start(a) a<-table.element(a,'beta',header=TRUE) a<-table.element(a,lm1$coefficients[[2]]) a<-table.row.end(a) a<-table.row.start(a) a<-table.element(a,'S.D.',header=TRUE) a<-table.element(a,summary(lm1)$coefficients[2,2]) a<-table.row.end(a) a<-table.row.start(a) a<-table.element(a,'T-STAT',header=TRUE) a<-table.element(a,summary(lm1)$coefficients[2,3]) a<-table.row.end(a) a<-table.row.start(a) a<-table.element(a,'p-value',header=TRUE) a<-table.element(a,summary(lm1)$coefficients[2,4]) a<-table.row.end(a) a<-table.end(a) table.save(a,file='mytable1.tab') a<-table.start() a<-table.row.start(a) a<-table.element(a,'Regression: ln S.E.(k) = alpha + beta * ln Mean(k)',2,TRUE) a<-table.row.end(a) a<-table.row.start(a) a<-table.element(a,'alpha',header=TRUE) a<-table.element(a,lnlm1$coefficients[[1]]) a<-table.row.end(a) a<-table.row.start(a) a<-table.element(a,'beta',header=TRUE) a<-table.element(a,lnlm1$coefficients[[2]]) a<-table.row.end(a) a<-table.row.start(a) a<-table.element(a,'S.D.',header=TRUE) a<-table.element(a,summary(lnlm1)$coefficients[2,2]) a<-table.row.end(a) a<-table.row.start(a) a<-table.element(a,'T-STAT',header=TRUE) a<-table.element(a,summary(lnlm1)$coefficients[2,3]) a<-table.row.end(a) a<-table.row.start(a) a<-table.element(a,'p-value',header=TRUE) a<-table.element(a,summary(lnlm1)$coefficients[2,4]) a<-table.row.end(a) a<-table.row.start(a) a<-table.element(a,'Lambda',header=TRUE) a<-table.element(a,1-lnlm1$coefficients[[2]]) a<-table.row.end(a) a<-table.end(a) table.save(a,file='mytable2.tab') | ||||||||||||||||||||||||||||||||||||||||||||||||||||||||||||||||

Copyright

This work is licensed under a
Creative Commons Attribution-Noncommercial-Share Alike 3.0 License.
Software written by Ed van Stee & Patrick Wessa
Disclaimer
Information provided on this web site is provided "AS IS" without warranty of any kind, either express or implied, including, without limitation, warranties of merchantability, fitness for a particular purpose, and noninfringement. We use reasonable efforts to include accurate and timely information and periodically update the information, and software without notice. However, we make no warranties or representations as to the accuracy or completeness of such information (or software), and we assume no liability or responsibility for errors or omissions in the content of this web site, or any software bugs in online applications. Your use of this web site is AT YOUR OWN RISK. Under no circumstances and under no legal theory shall we be liable to you or any other person for any direct, indirect, special, incidental, exemplary, or consequential damages arising from your access to, or use of, this web site.
Privacy Policy
We may request personal information to be submitted to our servers in order to be able to:
- personalize online software applications according to your needs
- enforce strict security rules with respect to the data that you upload (e.g. statistical data)
- manage user sessions of online applications
- alert you about important changes or upgrades in resources or applications
We NEVER allow other companies to directly offer registered users information about their products and services. Banner references and hyperlinks of third parties NEVER contain any personal data of the visitor.
We do NOT sell, nor transmit by any means, personal information, nor statistical data series uploaded by you to third parties.
We carefully protect your data from loss, misuse, alteration,
and destruction. However, at any time, and under any circumstance you
are solely responsible for managing your passwords, and keeping them
secret.
We store a unique ANONYMOUS USER ID in the form of a small 'Cookie' on your computer. This allows us to track your progress when using this website which is necessary to create state-dependent features. The cookie is used for NO OTHER PURPOSE. At any time you may opt to disallow cookies from this website - this will not affect other features of this website.
We examine cookies that are used by third-parties (banner and online ads) very closely: abuse from third-parties automatically results in termination of the advertising contract without refund. We have very good reason to believe that the cookies that are produced by third parties (banner ads) do NOT cause any privacy or security risk.
FreeStatistics.org is safe. There is no need to download any software to use the applications and services contained in this website. Hence, your system's security is not compromised by their use, and your personal data - other than data you submit in the account application form, and the user-agent information that is transmitted by your browser - is never transmitted to our servers.
As a general rule, we do not log on-line behavior of individuals (other than normal logging of webserver 'hits'). However, in cases of abuse, hacking, unauthorized access, Denial of Service attacks, illegal copying, hotlinking, non-compliance with international webstandards (such as robots.txt), or any other harmful behavior, our system engineers are empowered to log, track, identify, publish, and ban misbehaving individuals - even if this leads to ban entire blocks of IP addresses, or disclosing user's identity.