| *The author of this computation has been verified* | |||||||||||||||||||||||||||||||||||||||||||||||||
| R Software Module: /rwasp_correlation.wasp (opens new window with default values) | |||||||||||||||||||||||||||||||||||||||||||||||||
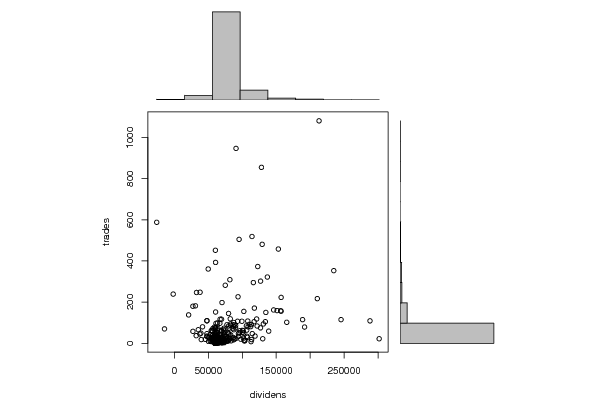
| Title produced by software: Pearson Correlation | |||||||||||||||||||||||||||||||||||||||||||||||||
| Date of computation: Sun, 19 Dec 2010 16:08:24 +0000 | |||||||||||||||||||||||||||||||||||||||||||||||||
| Cite this page as follows: | |||||||||||||||||||||||||||||||||||||||||||||||||
| Statistical Computations at FreeStatistics.org, Office for Research Development and Education, URL http://www.freestatistics.org/blog/date/2010/Dec/19/t12927747724j53bmnka8cn1a7.htm/, Retrieved Sun, 19 Dec 2010 17:06:12 +0100 | |||||||||||||||||||||||||||||||||||||||||||||||||
| BibTeX entries for LaTeX users: | |||||||||||||||||||||||||||||||||||||||||||||||||
@Manual{KEY,
    author = {{YOUR NAME}},
    publisher = {Office for Research Development and Education},
    title = {Statistical Computations at FreeStatistics.org, URL http://www.freestatistics.org/blog/date/2010/Dec/19/t12927747724j53bmnka8cn1a7.htm/},
    year = {2010},
}
@Manual{R,
    title = {R: A Language and Environment for Statistical Computing},
    author = {{R Development Core Team}},
    organization = {R Foundation for Statistical Computing},
    address = {Vienna, Austria},
    year = {2010},
    note = {{ISBN} 3-900051-07-0},
    url = {http://www.R-project.org},
}
| |||||||||||||||||||||||||||||||||||||||||||||||||
| Original text written by user: | |||||||||||||||||||||||||||||||||||||||||||||||||
| IsPrivate? | |||||||||||||||||||||||||||||||||||||||||||||||||
| No (this computation is public) | |||||||||||||||||||||||||||||||||||||||||||||||||
| User-defined keywords: | |||||||||||||||||||||||||||||||||||||||||||||||||
| Dataseries X: | |||||||||||||||||||||||||||||||||||||||||||||||||
| » Textbox « » Textfile « » CSV « | |||||||||||||||||||||||||||||||||||||||||||||||||
| 213118 81767 153198 -26007 126942 157214 129352 234817 60448 47818 245546 48020 -1710 32648 95350 151352 288170 114337 37884 122844 82340 79801 165548 116384 134028 63838 74996 31080 32168 49857 87161 106113 80570 102129 301670 102313 88577 112477 191778 79804 128294 96448 93811 117520 69159 101792 210568 136996 121920 76403 108094 134759 188873 146216 156608 61348 50350 87720 99489 87419 94355 60326 94670 82425 59017 90829 80791 100423 131116 100269 27330 39039 106885 79285 118881 77623 114768 74015 69465 117869 60982 90131 138971 39625 102725 64239 90262 103960 106611 103345 95551 82903 63593 126910 37527 60247 112995 70184 130140 73221 76114 90534 108479 113761 68696 71561 59831 97890 101481 72954 67939 48022 86111 74020 57530 56364 84990 88590 77200 61262 110309 67000 93099 107577 62920 75832 60720 60793 57935 60720 60630 55637 60720 60887 60720 60505 60945 60720 60720 etc... | |||||||||||||||||||||||||||||||||||||||||||||||||
| Dataseries Y: | |||||||||||||||||||||||||||||||||||||||||||||||||
| » Textbox « » Textfile « » CSV « | |||||||||||||||||||||||||||||||||||||||||||||||||
| 1081 309 458 588 302 156 481 353 452 109 115 110 239 247 505 159 109 519 248 373 119 84 102 295 105 64 282 182 37 361 28 85 45 49 22 155 91 81 79 145 855 61 226 105 62 25 217 322 84 33 108 150 115 162 158 97 9 66 107 101 47 38 34 87 79 947 74 53 94 63 58 49 34 11 35 20 47 43 117 171 26 75 59 18 15 72 86 14 64 11 52 41 99 75 45 43 8 198 22 11 33 23 80 18 40 23 60 20 61 36 30 47 71 14 9 39 26 21 16 69 92 14 107 29 37 23 0 7 28 0 8 63 0 3 5 9 13 2 5 0 14 0 15 3 15 11 0 6 2 1 10 73 0 11 3 0 0 2 7 0 0 0 0 27 51 3 0 19 393 0 0 4 0 9 0 10 152 1 0 0 34 10 57 52 5 14 29 5 5 0 4 0 6 0 2 0 91 0 0 20 0 0 0 27 17 2 4 0 32 31 0 0 32 20 7 0 8 28 0 29 4 0 2 21 2 26 14 0 4 0 9 10 0 17 0 1 0 6 0 0 0 3 0 8 4 0 0 11 0 0 9 0 2 73 94 0 8 35 0 0 0 0 12 15 0 0 0 11 0 6 etc... | |||||||||||||||||||||||||||||||||||||||||||||||||
| Output produced by software: | |||||||||||||||||||||||||||||||||||||||||||||||||
| |||||||||||||||||||||||||||||||||||||||||||||||||
| Charts produced by software: | |||||||||||||||||||||||||||||||||||||||||||||||||
| |||||||||||||||||||||||||||||||||||||||||||||||||
| Parameters (Session): | |||||||||||||||||||||||||||||||||||||||||||||||||
| Parameters (R input): | |||||||||||||||||||||||||||||||||||||||||||||||||
| R code (references can be found in the software module): | |||||||||||||||||||||||||||||||||||||||||||||||||
| bitmap(file='test1.png')
histx <- hist(x, plot=FALSE) histy <- hist(y, plot=FALSE) maxcounts <- max(c(histx$counts, histx$counts)) xrange <- c(min(x),max(x)) yrange <- c(min(y),max(y)) nf <- layout(matrix(c(2,0,1,3),2,2,byrow=TRUE), c(3,1), c(1,3), TRUE) par(mar=c(4,4,1,1)) plot(x, y, xlim=xrange, ylim=yrange, xlab=xlab, ylab=ylab) par(mar=c(0,4,1,1)) barplot(histx$counts, axes=FALSE, ylim=c(0, maxcounts), space=0) par(mar=c(4,0,1,1)) barplot(histy$counts, axes=FALSE, xlim=c(0, maxcounts), space=0, horiz=TRUE) dev.off() lx = length(x) makebiased = (lx-1)/lx varx = var(x)*makebiased vary = var(y)*makebiased corxy <- cor.test(x,y,method='pearson') cxy <- as.matrix(corxy$estimate)[1,1] load(file='createtable') a<-table.start() a<-table.row.start(a) a<-table.element(a,'Pearson Product Moment Correlation - Ungrouped Data',3,TRUE) a<-table.row.end(a) a<-table.row.start(a) a<-table.element(a,'Statistic',1,TRUE) a<-table.element(a,'Variable X',1,TRUE) a<-table.element(a,'Variable Y',1,TRUE) a<-table.row.end(a) a<-table.row.start(a) a<-table.element(a,hyperlink('http://www.xycoon.com/arithmetic_mean.htm','Mean',''),header=TRUE) a<-table.element(a,mean(x)) a<-table.element(a,mean(y)) a<-table.row.end(a) a<-table.row.start(a) a<-table.element(a,hyperlink('http://www.xycoon.com/biased.htm','Biased Variance',''),header=TRUE) a<-table.element(a,varx) a<-table.element(a,vary) a<-table.row.end(a) a<-table.row.start(a) a<-table.element(a,hyperlink('http://www.xycoon.com/biased1.htm','Biased Standard Deviation',''),header=TRUE) a<-table.element(a,sqrt(varx)) a<-table.element(a,sqrt(vary)) a<-table.row.end(a) a<-table.row.start(a) a<-table.element(a,hyperlink('http://www.xycoon.com/covariance.htm','Covariance',''),header=TRUE) a<-table.element(a,cov(x,y),2) a<-table.row.end(a) a<-table.row.start(a) a<-table.element(a,hyperlink('http://www.xycoon.com/pearson_correlation.htm','Correlation',''),header=TRUE) a<-table.element(a,cxy,2) a<-table.row.end(a) a<-table.row.start(a) a<-table.element(a,hyperlink('http://www.xycoon.com/coeff_of_determination.htm','Determination',''),header=TRUE) a<-table.element(a,cxy*cxy,2) a<-table.row.end(a) a<-table.row.start(a) a<-table.element(a,hyperlink('http://www.xycoon.com/ttest_statistic.htm','T-Test',''),header=TRUE) a<-table.element(a,as.matrix(corxy$statistic)[1,1],2) a<-table.row.end(a) a<-table.row.start(a) a<-table.element(a,'p-value (2 sided)',header=TRUE) a<-table.element(a,(p2 <- as.matrix(corxy$p.value)[1,1]),2) a<-table.row.end(a) a<-table.row.start(a) a<-table.element(a,'p-value (1 sided)',header=TRUE) a<-table.element(a,p2/2,2) a<-table.row.end(a) a<-table.row.start(a) a<-table.element(a,'Degrees of Freedom',header=TRUE) a<-table.element(a,lx-2,2) a<-table.row.end(a) a<-table.row.start(a) a<-table.element(a,'Number of Observations',header=TRUE) a<-table.element(a,lx,2) a<-table.row.end(a) a<-table.end(a) table.save(a,file='mytable.tab') | |||||||||||||||||||||||||||||||||||||||||||||||||
Copyright

This work is licensed under a
Creative Commons Attribution-Noncommercial-Share Alike 3.0 License.
Software written by Ed van Stee & Patrick Wessa
Disclaimer
Information provided on this web site is provided "AS IS" without warranty of any kind, either express or implied, including, without limitation, warranties of merchantability, fitness for a particular purpose, and noninfringement. We use reasonable efforts to include accurate and timely information and periodically update the information, and software without notice. However, we make no warranties or representations as to the accuracy or completeness of such information (or software), and we assume no liability or responsibility for errors or omissions in the content of this web site, or any software bugs in online applications. Your use of this web site is AT YOUR OWN RISK. Under no circumstances and under no legal theory shall we be liable to you or any other person for any direct, indirect, special, incidental, exemplary, or consequential damages arising from your access to, or use of, this web site.
Privacy Policy
We may request personal information to be submitted to our servers in order to be able to:
- personalize online software applications according to your needs
- enforce strict security rules with respect to the data that you upload (e.g. statistical data)
- manage user sessions of online applications
- alert you about important changes or upgrades in resources or applications
We NEVER allow other companies to directly offer registered users information about their products and services. Banner references and hyperlinks of third parties NEVER contain any personal data of the visitor.
We do NOT sell, nor transmit by any means, personal information, nor statistical data series uploaded by you to third parties.
We carefully protect your data from loss, misuse, alteration,
and destruction. However, at any time, and under any circumstance you
are solely responsible for managing your passwords, and keeping them
secret.
We store a unique ANONYMOUS USER ID in the form of a small 'Cookie' on your computer. This allows us to track your progress when using this website which is necessary to create state-dependent features. The cookie is used for NO OTHER PURPOSE. At any time you may opt to disallow cookies from this website - this will not affect other features of this website.
We examine cookies that are used by third-parties (banner and online ads) very closely: abuse from third-parties automatically results in termination of the advertising contract without refund. We have very good reason to believe that the cookies that are produced by third parties (banner ads) do NOT cause any privacy or security risk.
FreeStatistics.org is safe. There is no need to download any software to use the applications and services contained in this website. Hence, your system's security is not compromised by their use, and your personal data - other than data you submit in the account application form, and the user-agent information that is transmitted by your browser - is never transmitted to our servers.
As a general rule, we do not log on-line behavior of individuals (other than normal logging of webserver 'hits'). However, in cases of abuse, hacking, unauthorized access, Denial of Service attacks, illegal copying, hotlinking, non-compliance with international webstandards (such as robots.txt), or any other harmful behavior, our system engineers are empowered to log, track, identify, publish, and ban misbehaving individuals - even if this leads to ban entire blocks of IP addresses, or disclosing user's identity.