Free Statistics

of Irreproducible Research!

Author's title

Author*The author of this computation has been verified*
R Software Modulerwasp_multipleregression.wasp
Title produced by softwareMultiple Regression
Date of computationSat, 18 Dec 2010 23:41:03 +0000
Cite this page as followsStatistical Computations at FreeStatistics.org, Office for Research Development and Education, URL https://freestatistics.org/blog/index.php?v=date/2010/Dec/19/t1292715626t619neqw96j8iwn.htm/, Retrieved Fri, 26 Apr 2024 20:08:51 +0000
Statistical Computations at FreeStatistics.org, Office for Research Development and Education, URL https://freestatistics.org/blog/index.php?pk=112216, Retrieved Fri, 26 Apr 2024 20:08:51 +0000
QR Codes:

Original text written by user:
IsPrivate?No (this computation is public)
User-defined keywords
Estimated Impact173
Family? (F = Feedback message, R = changed R code, M = changed R Module, P = changed Parameters, D = changed Data)
-     [Multiple Regression] [] [2010-11-17 09:55:05] [b98453cac15ba1066b407e146608df68]
-   PD  [Multiple Regression] [Multiple Regressi...] [2010-11-23 23:46:10] [b8e188bcc949964bed729335b3416734]
-   PD    [Multiple Regression] [Werkloosheid] [2010-11-29 23:29:58] [b8e188bcc949964bed729335b3416734]
-    D        [Multiple Regression] [ACF Nieuwbouw] [2010-12-18 23:41:03] [278a0539dc236556c5f30b5bc56ff9eb] [Current]
-   P           [Multiple Regression] [Regression Analys...] [2010-12-20 22:02:17] [b8e188bcc949964bed729335b3416734]
Feedback Forum

Post a new message
Dataseries X:
4143
4429
5219
4929
5761
5592
4163
4962
5208
4755
4491
5732
5731
5040
6102
4904
5369
5578
4619
4731
5011
5299
4146
4625
4736
4219
5116
4205
4121
5103
4300
4578
3809
5657
4248
3830
4736
4839
4411
4570
4104
4801
3953
3828
4440
4026
4109
4785
3224
3552
3940
3913
3681
4309
3830
4143
4087
3818
3380
3430
3458
3970
5260
5024
5634
6549
4676


Summary of computational transaction
Raw Inputview raw input (R code)
Raw Outputview raw output of R engine
Computing time5 seconds
R Server'RServer@AstonUniversity' @ vre.aston.ac.uk

\begin{tabular}{lllllllll}
\hline
Summary of computational transaction \tabularnewline
Raw Input & view raw input (R code)  \tabularnewline
Raw Output & view raw output of R engine  \tabularnewline
Computing time & 5 seconds \tabularnewline
R Server & 'RServer@AstonUniversity' @ vre.aston.ac.uk \tabularnewline
\hline
\end{tabular}
%Source: https://freestatistics.org/blog/index.php?pk=112216&T=0

[TABLE]
[ROW][C]Summary of computational transaction[/C][/ROW]
[ROW][C]Raw Input[/C][C]view raw input (R code) [/C][/ROW]
[ROW][C]Raw Output[/C][C]view raw output of R engine [/C][/ROW]
[ROW][C]Computing time[/C][C]5 seconds[/C][/ROW]
[ROW][C]R Server[/C][C]'RServer@AstonUniversity' @ vre.aston.ac.uk[/C][/ROW]
[/TABLE]
Source: https://freestatistics.org/blog/index.php?pk=112216&T=0

Globally Unique Identifier (entire table): ba.freestatistics.org/blog/index.php?pk=112216&T=0

As an alternative you can also use a QR Code:  

The GUIDs for individual cells are displayed in the table below:

Summary of computational transaction
Raw Inputview raw input (R code)
Raw Outputview raw output of R engine
Computing time5 seconds
R Server'RServer@AstonUniversity' @ vre.aston.ac.uk


Multiple Linear Regression - Estimated Regression Equation
nb[t] = + 4480.4 -142.400000000001M1[t] -138.9M2[t] + 527.6M3[t] + 110.433333333333M4[t] + 297.933333333333M5[t] + 841.6M6[t] -223.566666666667M7[t] -32M8[t] + 30.5999999999999M9[t] + 230.6M10[t] -405.6M11[t] + e[t]

\begin{tabular}{lllllllll}
\hline
Multiple Linear Regression - Estimated Regression Equation \tabularnewline
nb[t] =  +  4480.4 -142.400000000001M1[t] -138.9M2[t] +  527.6M3[t] +  110.433333333333M4[t] +  297.933333333333M5[t] +  841.6M6[t] -223.566666666667M7[t] -32M8[t] +  30.5999999999999M9[t] +  230.6M10[t] -405.6M11[t]  + e[t] \tabularnewline
\hline
\end{tabular}
%Source: https://freestatistics.org/blog/index.php?pk=112216&T=1

[TABLE]
[ROW][C]Multiple Linear Regression - Estimated Regression Equation[/C][/ROW]
[ROW][C]nb[t] =  +  4480.4 -142.400000000001M1[t] -138.9M2[t] +  527.6M3[t] +  110.433333333333M4[t] +  297.933333333333M5[t] +  841.6M6[t] -223.566666666667M7[t] -32M8[t] +  30.5999999999999M9[t] +  230.6M10[t] -405.6M11[t]  + e[t][/C][/ROW]
[/TABLE]
Source: https://freestatistics.org/blog/index.php?pk=112216&T=1

Globally Unique Identifier (entire table): ba.freestatistics.org/blog/index.php?pk=112216&T=1

As an alternative you can also use a QR Code:  

The GUIDs for individual cells are displayed in the table below:

Multiple Linear Regression - Estimated Regression Equation
nb[t] = + 4480.4 -142.400000000001M1[t] -138.9M2[t] + 527.6M3[t] + 110.433333333333M4[t] + 297.933333333333M5[t] + 841.6M6[t] -223.566666666667M7[t] -32M8[t] + 30.5999999999999M9[t] + 230.6M10[t] -405.6M11[t] + e[t]


Multiple Linear Regression - Ordinary Least Squares
VariableParameterS.D.T-STATH0: parameter = 02-tail p-value1-tail p-value
(Intercept)4480.4307.67002214.562400
M1-142.400000000001416.587179-0.34180.7337850.366893
M2-138.9416.587179-0.33340.7400820.370041
M3527.6416.5871791.26650.2106780.105339
M4110.433333333333416.5871790.26510.7919310.395965
M5297.933333333333416.5871790.71520.4775250.238763
M6841.6416.5871792.02020.0482410.024121
M7-223.566666666667416.587179-0.53670.5936650.296833
M8-32435.111118-0.07350.941640.47082
M930.5999999999999435.1111180.07030.9441890.472094
M10230.6435.1111180.530.5982590.29913
M11-405.6435.111118-0.93220.355320.17766

\begin{tabular}{lllllllll}
\hline
Multiple Linear Regression - Ordinary Least Squares \tabularnewline
Variable & Parameter & S.D. & T-STATH0: parameter = 0 & 2-tail p-value & 1-tail p-value \tabularnewline
(Intercept) & 4480.4 & 307.670022 & 14.5624 & 0 & 0 \tabularnewline
M1 & -142.400000000001 & 416.587179 & -0.3418 & 0.733785 & 0.366893 \tabularnewline
M2 & -138.9 & 416.587179 & -0.3334 & 0.740082 & 0.370041 \tabularnewline
M3 & 527.6 & 416.587179 & 1.2665 & 0.210678 & 0.105339 \tabularnewline
M4 & 110.433333333333 & 416.587179 & 0.2651 & 0.791931 & 0.395965 \tabularnewline
M5 & 297.933333333333 & 416.587179 & 0.7152 & 0.477525 & 0.238763 \tabularnewline
M6 & 841.6 & 416.587179 & 2.0202 & 0.048241 & 0.024121 \tabularnewline
M7 & -223.566666666667 & 416.587179 & -0.5367 & 0.593665 & 0.296833 \tabularnewline
M8 & -32 & 435.111118 & -0.0735 & 0.94164 & 0.47082 \tabularnewline
M9 & 30.5999999999999 & 435.111118 & 0.0703 & 0.944189 & 0.472094 \tabularnewline
M10 & 230.6 & 435.111118 & 0.53 & 0.598259 & 0.29913 \tabularnewline
M11 & -405.6 & 435.111118 & -0.9322 & 0.35532 & 0.17766 \tabularnewline
\hline
\end{tabular}
%Source: https://freestatistics.org/blog/index.php?pk=112216&T=2

[TABLE]
[ROW][C]Multiple Linear Regression - Ordinary Least Squares[/C][/ROW]
[ROW][C]Variable[/C][C]Parameter[/C][C]S.D.[/C][C]T-STATH0: parameter = 0[/C][C]2-tail p-value[/C][C]1-tail p-value[/C][/ROW]
[ROW][C](Intercept)[/C][C]4480.4[/C][C]307.670022[/C][C]14.5624[/C][C]0[/C][C]0[/C][/ROW]
[ROW][C]M1[/C][C]-142.400000000001[/C][C]416.587179[/C][C]-0.3418[/C][C]0.733785[/C][C]0.366893[/C][/ROW]
[ROW][C]M2[/C][C]-138.9[/C][C]416.587179[/C][C]-0.3334[/C][C]0.740082[/C][C]0.370041[/C][/ROW]
[ROW][C]M3[/C][C]527.6[/C][C]416.587179[/C][C]1.2665[/C][C]0.210678[/C][C]0.105339[/C][/ROW]
[ROW][C]M4[/C][C]110.433333333333[/C][C]416.587179[/C][C]0.2651[/C][C]0.791931[/C][C]0.395965[/C][/ROW]
[ROW][C]M5[/C][C]297.933333333333[/C][C]416.587179[/C][C]0.7152[/C][C]0.477525[/C][C]0.238763[/C][/ROW]
[ROW][C]M6[/C][C]841.6[/C][C]416.587179[/C][C]2.0202[/C][C]0.048241[/C][C]0.024121[/C][/ROW]
[ROW][C]M7[/C][C]-223.566666666667[/C][C]416.587179[/C][C]-0.5367[/C][C]0.593665[/C][C]0.296833[/C][/ROW]
[ROW][C]M8[/C][C]-32[/C][C]435.111118[/C][C]-0.0735[/C][C]0.94164[/C][C]0.47082[/C][/ROW]
[ROW][C]M9[/C][C]30.5999999999999[/C][C]435.111118[/C][C]0.0703[/C][C]0.944189[/C][C]0.472094[/C][/ROW]
[ROW][C]M10[/C][C]230.6[/C][C]435.111118[/C][C]0.53[/C][C]0.598259[/C][C]0.29913[/C][/ROW]
[ROW][C]M11[/C][C]-405.6[/C][C]435.111118[/C][C]-0.9322[/C][C]0.35532[/C][C]0.17766[/C][/ROW]
[/TABLE]
Source: https://freestatistics.org/blog/index.php?pk=112216&T=2

Globally Unique Identifier (entire table): ba.freestatistics.org/blog/index.php?pk=112216&T=2

As an alternative you can also use a QR Code:  

The GUIDs for individual cells are displayed in the table below:

Multiple Linear Regression - Ordinary Least Squares
VariableParameterS.D.T-STATH0: parameter = 02-tail p-value1-tail p-value
(Intercept)4480.4307.67002214.562400
M1-142.400000000001416.587179-0.34180.7337850.366893
M2-138.9416.587179-0.33340.7400820.370041
M3527.6416.5871791.26650.2106780.105339
M4110.433333333333416.5871790.26510.7919310.395965
M5297.933333333333416.5871790.71520.4775250.238763
M6841.6416.5871792.02020.0482410.024121
M7-223.566666666667416.587179-0.53670.5936650.296833
M8-32435.111118-0.07350.941640.47082
M930.5999999999999435.1111180.07030.9441890.472094
M10230.6435.1111180.530.5982590.29913
M11-405.6435.111118-0.93220.355320.17766


Multiple Linear Regression - Regression Statistics
Multiple R0.472454725383456
R-squared0.223213467537157
Adjusted R-squared0.0678561610445886
F-TEST (value)1.43677482943382
F-TEST (DF numerator)11
F-TEST (DF denominator)55
p-value0.183209866296029
Multiple Linear Regression - Residual Statistics
Residual Standard Deviation687.97108422322
Sum Squared Residuals26031731.7

\begin{tabular}{lllllllll}
\hline
Multiple Linear Regression - Regression Statistics \tabularnewline
Multiple R & 0.472454725383456 \tabularnewline
R-squared & 0.223213467537157 \tabularnewline
Adjusted R-squared & 0.0678561610445886 \tabularnewline
F-TEST (value) & 1.43677482943382 \tabularnewline
F-TEST (DF numerator) & 11 \tabularnewline
F-TEST (DF denominator) & 55 \tabularnewline
p-value & 0.183209866296029 \tabularnewline
Multiple Linear Regression - Residual Statistics \tabularnewline
Residual Standard Deviation & 687.97108422322 \tabularnewline
Sum Squared Residuals & 26031731.7 \tabularnewline
\hline
\end{tabular}
%Source: https://freestatistics.org/blog/index.php?pk=112216&T=3

[TABLE]
[ROW][C]Multiple Linear Regression - Regression Statistics[/C][/ROW]
[ROW][C]Multiple R[/C][C]0.472454725383456[/C][/ROW]
[ROW][C]R-squared[/C][C]0.223213467537157[/C][/ROW]
[ROW][C]Adjusted R-squared[/C][C]0.0678561610445886[/C][/ROW]
[ROW][C]F-TEST (value)[/C][C]1.43677482943382[/C][/ROW]
[ROW][C]F-TEST (DF numerator)[/C][C]11[/C][/ROW]
[ROW][C]F-TEST (DF denominator)[/C][C]55[/C][/ROW]
[ROW][C]p-value[/C][C]0.183209866296029[/C][/ROW]
[ROW][C]Multiple Linear Regression - Residual Statistics[/C][/ROW]
[ROW][C]Residual Standard Deviation[/C][C]687.97108422322[/C][/ROW]
[ROW][C]Sum Squared Residuals[/C][C]26031731.7[/C][/ROW]
[/TABLE]
Source: https://freestatistics.org/blog/index.php?pk=112216&T=3

Globally Unique Identifier (entire table): ba.freestatistics.org/blog/index.php?pk=112216&T=3

As an alternative you can also use a QR Code:  

The GUIDs for individual cells are displayed in the table below:

Multiple Linear Regression - Regression Statistics
Multiple R0.472454725383456
R-squared0.223213467537157
Adjusted R-squared0.0678561610445886
F-TEST (value)1.43677482943382
F-TEST (DF numerator)11
F-TEST (DF denominator)55
p-value0.183209866296029
Multiple Linear Regression - Residual Statistics
Residual Standard Deviation687.97108422322
Sum Squared Residuals26031731.7


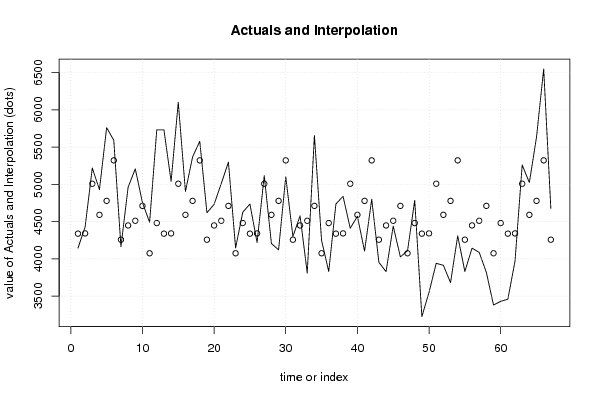
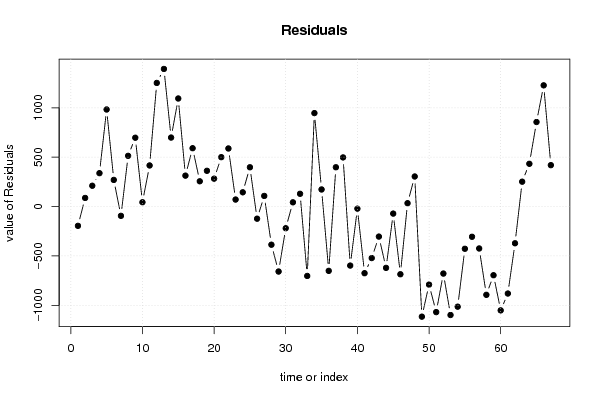
Multiple Linear Regression - Actuals, Interpolation, and Residuals
Time or IndexActualsInterpolationForecastResidualsPrediction Error
141434338-195.000000000004
244294341.587.5
352195008211
449294590.83333333333338.166666666667
557614778.33333333333982.666666666667
655925322270
741634256.83333333333-93.8333333333334
849624448.4513.6
952084511697
104755471144.0000000000001
1144914074.8416.2
1257324480.41251.6
13573143381393
1450404341.5698.5
15610250081094
1649044590.83333333333313.166666666667
1753694778.33333333333590.666666666667
1855785322256
1946194256.83333333333362.166666666667
2047314448.4282.6
2150114511500
2252994711588
2341464074.871.2
2446254480.4144.6
2547364338398.000000000001
2642194341.5-122.5
2751165008108
2842054590.83333333333-385.833333333333
2941214778.33333333333-657.333333333333
3051035322-219
3143004256.8333333333343.1666666666667
3245784448.4129.6
3338094511-702
3456574711946
3542484074.8173.2
3638304480.4-650.4
3747364338398.000000000001
3848394341.5497.5
3944115008-597
4045704590.83333333333-20.8333333333333
4141044778.33333333333-674.333333333333
4248015322-521
4339534256.83333333333-303.833333333333
4438284448.4-620.4
4544404511-71
4640264711-685
4741094074.834.2
4847854480.4304.6
4932244338-1114
5035524341.5-789.5
5139405008-1068
5239134590.83333333333-677.833333333333
5336814778.33333333333-1097.33333333333
5443095322-1013
5538304256.83333333333-426.833333333333
5641434448.4-305.4
5740874511-424
5838184711-893
5933804074.8-694.8
6034304480.4-1050.4
6134584338-879.999999999999
6239704341.5-371.5
6352605008252
6450244590.83333333333433.166666666667
6556344778.33333333333855.666666666667
66654953221227
6746764256.83333333333419.166666666667

\begin{tabular}{lllllllll}
\hline
Multiple Linear Regression - Actuals, Interpolation, and Residuals \tabularnewline
Time or Index & Actuals & InterpolationForecast & ResidualsPrediction Error \tabularnewline
1 & 4143 & 4338 & -195.000000000004 \tabularnewline
2 & 4429 & 4341.5 & 87.5 \tabularnewline
3 & 5219 & 5008 & 211 \tabularnewline
4 & 4929 & 4590.83333333333 & 338.166666666667 \tabularnewline
5 & 5761 & 4778.33333333333 & 982.666666666667 \tabularnewline
6 & 5592 & 5322 & 270 \tabularnewline
7 & 4163 & 4256.83333333333 & -93.8333333333334 \tabularnewline
8 & 4962 & 4448.4 & 513.6 \tabularnewline
9 & 5208 & 4511 & 697 \tabularnewline
10 & 4755 & 4711 & 44.0000000000001 \tabularnewline
11 & 4491 & 4074.8 & 416.2 \tabularnewline
12 & 5732 & 4480.4 & 1251.6 \tabularnewline
13 & 5731 & 4338 & 1393 \tabularnewline
14 & 5040 & 4341.5 & 698.5 \tabularnewline
15 & 6102 & 5008 & 1094 \tabularnewline
16 & 4904 & 4590.83333333333 & 313.166666666667 \tabularnewline
17 & 5369 & 4778.33333333333 & 590.666666666667 \tabularnewline
18 & 5578 & 5322 & 256 \tabularnewline
19 & 4619 & 4256.83333333333 & 362.166666666667 \tabularnewline
20 & 4731 & 4448.4 & 282.6 \tabularnewline
21 & 5011 & 4511 & 500 \tabularnewline
22 & 5299 & 4711 & 588 \tabularnewline
23 & 4146 & 4074.8 & 71.2 \tabularnewline
24 & 4625 & 4480.4 & 144.6 \tabularnewline
25 & 4736 & 4338 & 398.000000000001 \tabularnewline
26 & 4219 & 4341.5 & -122.5 \tabularnewline
27 & 5116 & 5008 & 108 \tabularnewline
28 & 4205 & 4590.83333333333 & -385.833333333333 \tabularnewline
29 & 4121 & 4778.33333333333 & -657.333333333333 \tabularnewline
30 & 5103 & 5322 & -219 \tabularnewline
31 & 4300 & 4256.83333333333 & 43.1666666666667 \tabularnewline
32 & 4578 & 4448.4 & 129.6 \tabularnewline
33 & 3809 & 4511 & -702 \tabularnewline
34 & 5657 & 4711 & 946 \tabularnewline
35 & 4248 & 4074.8 & 173.2 \tabularnewline
36 & 3830 & 4480.4 & -650.4 \tabularnewline
37 & 4736 & 4338 & 398.000000000001 \tabularnewline
38 & 4839 & 4341.5 & 497.5 \tabularnewline
39 & 4411 & 5008 & -597 \tabularnewline
40 & 4570 & 4590.83333333333 & -20.8333333333333 \tabularnewline
41 & 4104 & 4778.33333333333 & -674.333333333333 \tabularnewline
42 & 4801 & 5322 & -521 \tabularnewline
43 & 3953 & 4256.83333333333 & -303.833333333333 \tabularnewline
44 & 3828 & 4448.4 & -620.4 \tabularnewline
45 & 4440 & 4511 & -71 \tabularnewline
46 & 4026 & 4711 & -685 \tabularnewline
47 & 4109 & 4074.8 & 34.2 \tabularnewline
48 & 4785 & 4480.4 & 304.6 \tabularnewline
49 & 3224 & 4338 & -1114 \tabularnewline
50 & 3552 & 4341.5 & -789.5 \tabularnewline
51 & 3940 & 5008 & -1068 \tabularnewline
52 & 3913 & 4590.83333333333 & -677.833333333333 \tabularnewline
53 & 3681 & 4778.33333333333 & -1097.33333333333 \tabularnewline
54 & 4309 & 5322 & -1013 \tabularnewline
55 & 3830 & 4256.83333333333 & -426.833333333333 \tabularnewline
56 & 4143 & 4448.4 & -305.4 \tabularnewline
57 & 4087 & 4511 & -424 \tabularnewline
58 & 3818 & 4711 & -893 \tabularnewline
59 & 3380 & 4074.8 & -694.8 \tabularnewline
60 & 3430 & 4480.4 & -1050.4 \tabularnewline
61 & 3458 & 4338 & -879.999999999999 \tabularnewline
62 & 3970 & 4341.5 & -371.5 \tabularnewline
63 & 5260 & 5008 & 252 \tabularnewline
64 & 5024 & 4590.83333333333 & 433.166666666667 \tabularnewline
65 & 5634 & 4778.33333333333 & 855.666666666667 \tabularnewline
66 & 6549 & 5322 & 1227 \tabularnewline
67 & 4676 & 4256.83333333333 & 419.166666666667 \tabularnewline
\hline
\end{tabular}
%Source: https://freestatistics.org/blog/index.php?pk=112216&T=4

[TABLE]
[ROW][C]Multiple Linear Regression - Actuals, Interpolation, and Residuals[/C][/ROW]
[ROW][C]Time or Index[/C][C]Actuals[/C][C]InterpolationForecast[/C][C]ResidualsPrediction Error[/C][/ROW]
[ROW][C]1[/C][C]4143[/C][C]4338[/C][C]-195.000000000004[/C][/ROW]
[ROW][C]2[/C][C]4429[/C][C]4341.5[/C][C]87.5[/C][/ROW]
[ROW][C]3[/C][C]5219[/C][C]5008[/C][C]211[/C][/ROW]
[ROW][C]4[/C][C]4929[/C][C]4590.83333333333[/C][C]338.166666666667[/C][/ROW]
[ROW][C]5[/C][C]5761[/C][C]4778.33333333333[/C][C]982.666666666667[/C][/ROW]
[ROW][C]6[/C][C]5592[/C][C]5322[/C][C]270[/C][/ROW]
[ROW][C]7[/C][C]4163[/C][C]4256.83333333333[/C][C]-93.8333333333334[/C][/ROW]
[ROW][C]8[/C][C]4962[/C][C]4448.4[/C][C]513.6[/C][/ROW]
[ROW][C]9[/C][C]5208[/C][C]4511[/C][C]697[/C][/ROW]
[ROW][C]10[/C][C]4755[/C][C]4711[/C][C]44.0000000000001[/C][/ROW]
[ROW][C]11[/C][C]4491[/C][C]4074.8[/C][C]416.2[/C][/ROW]
[ROW][C]12[/C][C]5732[/C][C]4480.4[/C][C]1251.6[/C][/ROW]
[ROW][C]13[/C][C]5731[/C][C]4338[/C][C]1393[/C][/ROW]
[ROW][C]14[/C][C]5040[/C][C]4341.5[/C][C]698.5[/C][/ROW]
[ROW][C]15[/C][C]6102[/C][C]5008[/C][C]1094[/C][/ROW]
[ROW][C]16[/C][C]4904[/C][C]4590.83333333333[/C][C]313.166666666667[/C][/ROW]
[ROW][C]17[/C][C]5369[/C][C]4778.33333333333[/C][C]590.666666666667[/C][/ROW]
[ROW][C]18[/C][C]5578[/C][C]5322[/C][C]256[/C][/ROW]
[ROW][C]19[/C][C]4619[/C][C]4256.83333333333[/C][C]362.166666666667[/C][/ROW]
[ROW][C]20[/C][C]4731[/C][C]4448.4[/C][C]282.6[/C][/ROW]
[ROW][C]21[/C][C]5011[/C][C]4511[/C][C]500[/C][/ROW]
[ROW][C]22[/C][C]5299[/C][C]4711[/C][C]588[/C][/ROW]
[ROW][C]23[/C][C]4146[/C][C]4074.8[/C][C]71.2[/C][/ROW]
[ROW][C]24[/C][C]4625[/C][C]4480.4[/C][C]144.6[/C][/ROW]
[ROW][C]25[/C][C]4736[/C][C]4338[/C][C]398.000000000001[/C][/ROW]
[ROW][C]26[/C][C]4219[/C][C]4341.5[/C][C]-122.5[/C][/ROW]
[ROW][C]27[/C][C]5116[/C][C]5008[/C][C]108[/C][/ROW]
[ROW][C]28[/C][C]4205[/C][C]4590.83333333333[/C][C]-385.833333333333[/C][/ROW]
[ROW][C]29[/C][C]4121[/C][C]4778.33333333333[/C][C]-657.333333333333[/C][/ROW]
[ROW][C]30[/C][C]5103[/C][C]5322[/C][C]-219[/C][/ROW]
[ROW][C]31[/C][C]4300[/C][C]4256.83333333333[/C][C]43.1666666666667[/C][/ROW]
[ROW][C]32[/C][C]4578[/C][C]4448.4[/C][C]129.6[/C][/ROW]
[ROW][C]33[/C][C]3809[/C][C]4511[/C][C]-702[/C][/ROW]
[ROW][C]34[/C][C]5657[/C][C]4711[/C][C]946[/C][/ROW]
[ROW][C]35[/C][C]4248[/C][C]4074.8[/C][C]173.2[/C][/ROW]
[ROW][C]36[/C][C]3830[/C][C]4480.4[/C][C]-650.4[/C][/ROW]
[ROW][C]37[/C][C]4736[/C][C]4338[/C][C]398.000000000001[/C][/ROW]
[ROW][C]38[/C][C]4839[/C][C]4341.5[/C][C]497.5[/C][/ROW]
[ROW][C]39[/C][C]4411[/C][C]5008[/C][C]-597[/C][/ROW]
[ROW][C]40[/C][C]4570[/C][C]4590.83333333333[/C][C]-20.8333333333333[/C][/ROW]
[ROW][C]41[/C][C]4104[/C][C]4778.33333333333[/C][C]-674.333333333333[/C][/ROW]
[ROW][C]42[/C][C]4801[/C][C]5322[/C][C]-521[/C][/ROW]
[ROW][C]43[/C][C]3953[/C][C]4256.83333333333[/C][C]-303.833333333333[/C][/ROW]
[ROW][C]44[/C][C]3828[/C][C]4448.4[/C][C]-620.4[/C][/ROW]
[ROW][C]45[/C][C]4440[/C][C]4511[/C][C]-71[/C][/ROW]
[ROW][C]46[/C][C]4026[/C][C]4711[/C][C]-685[/C][/ROW]
[ROW][C]47[/C][C]4109[/C][C]4074.8[/C][C]34.2[/C][/ROW]
[ROW][C]48[/C][C]4785[/C][C]4480.4[/C][C]304.6[/C][/ROW]
[ROW][C]49[/C][C]3224[/C][C]4338[/C][C]-1114[/C][/ROW]
[ROW][C]50[/C][C]3552[/C][C]4341.5[/C][C]-789.5[/C][/ROW]
[ROW][C]51[/C][C]3940[/C][C]5008[/C][C]-1068[/C][/ROW]
[ROW][C]52[/C][C]3913[/C][C]4590.83333333333[/C][C]-677.833333333333[/C][/ROW]
[ROW][C]53[/C][C]3681[/C][C]4778.33333333333[/C][C]-1097.33333333333[/C][/ROW]
[ROW][C]54[/C][C]4309[/C][C]5322[/C][C]-1013[/C][/ROW]
[ROW][C]55[/C][C]3830[/C][C]4256.83333333333[/C][C]-426.833333333333[/C][/ROW]
[ROW][C]56[/C][C]4143[/C][C]4448.4[/C][C]-305.4[/C][/ROW]
[ROW][C]57[/C][C]4087[/C][C]4511[/C][C]-424[/C][/ROW]
[ROW][C]58[/C][C]3818[/C][C]4711[/C][C]-893[/C][/ROW]
[ROW][C]59[/C][C]3380[/C][C]4074.8[/C][C]-694.8[/C][/ROW]
[ROW][C]60[/C][C]3430[/C][C]4480.4[/C][C]-1050.4[/C][/ROW]
[ROW][C]61[/C][C]3458[/C][C]4338[/C][C]-879.999999999999[/C][/ROW]
[ROW][C]62[/C][C]3970[/C][C]4341.5[/C][C]-371.5[/C][/ROW]
[ROW][C]63[/C][C]5260[/C][C]5008[/C][C]252[/C][/ROW]
[ROW][C]64[/C][C]5024[/C][C]4590.83333333333[/C][C]433.166666666667[/C][/ROW]
[ROW][C]65[/C][C]5634[/C][C]4778.33333333333[/C][C]855.666666666667[/C][/ROW]
[ROW][C]66[/C][C]6549[/C][C]5322[/C][C]1227[/C][/ROW]
[ROW][C]67[/C][C]4676[/C][C]4256.83333333333[/C][C]419.166666666667[/C][/ROW]
[/TABLE]
Source: https://freestatistics.org/blog/index.php?pk=112216&T=4

Globally Unique Identifier (entire table): ba.freestatistics.org/blog/index.php?pk=112216&T=4

As an alternative you can also use a QR Code:  

The GUIDs for individual cells are displayed in the table below:

Multiple Linear Regression - Actuals, Interpolation, and Residuals
Time or IndexActualsInterpolationForecastResidualsPrediction Error
141434338-195.000000000004
244294341.587.5
352195008211
449294590.83333333333338.166666666667
557614778.33333333333982.666666666667
655925322270
741634256.83333333333-93.8333333333334
849624448.4513.6
952084511697
104755471144.0000000000001
1144914074.8416.2
1257324480.41251.6
13573143381393
1450404341.5698.5
15610250081094
1649044590.83333333333313.166666666667
1753694778.33333333333590.666666666667
1855785322256
1946194256.83333333333362.166666666667
2047314448.4282.6
2150114511500
2252994711588
2341464074.871.2
2446254480.4144.6
2547364338398.000000000001
2642194341.5-122.5
2751165008108
2842054590.83333333333-385.833333333333
2941214778.33333333333-657.333333333333
3051035322-219
3143004256.8333333333343.1666666666667
3245784448.4129.6
3338094511-702
3456574711946
3542484074.8173.2
3638304480.4-650.4
3747364338398.000000000001
3848394341.5497.5
3944115008-597
4045704590.83333333333-20.8333333333333
4141044778.33333333333-674.333333333333
4248015322-521
4339534256.83333333333-303.833333333333
4438284448.4-620.4
4544404511-71
4640264711-685
4741094074.834.2
4847854480.4304.6
4932244338-1114
5035524341.5-789.5
5139405008-1068
5239134590.83333333333-677.833333333333
5336814778.33333333333-1097.33333333333
5443095322-1013
5538304256.83333333333-426.833333333333
5641434448.4-305.4
5740874511-424
5838184711-893
5933804074.8-694.8
6034304480.4-1050.4
6134584338-879.999999999999
6239704341.5-371.5
6352605008252
6450244590.83333333333433.166666666667
6556344778.33333333333855.666666666667
66654953221227
6746764256.83333333333419.166666666667


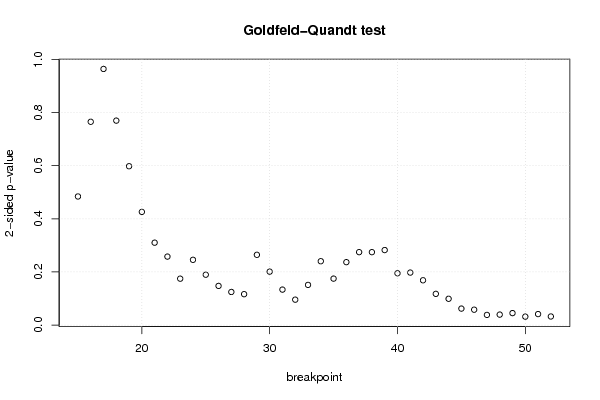
Goldfeld-Quandt test for Heteroskedasticity
p-valuesAlternative Hypothesis
breakpoint indexgreater2-sidedless
150.7579464060217560.4841071879564890.242053593978244
160.6173581908556510.7652836182886980.382641809144349
170.5178722746242570.9642554507514860.482127725375743
180.3848564121637380.7697128243274750.615143587836263
190.2989778640517470.5979557281034950.701022135948253
200.2130207594750130.4260415189500250.786979240524987
210.155072798755350.3101455975106990.84492720124465
220.1288834558719860.2577669117439710.871116544128014
230.08730327514531110.1746065502906220.912696724854689
240.1227749945458260.2455499890916510.877225005454174
250.09477161294390950.1895432258878190.90522838705609
260.07370042209794050.1474008441958810.92629957790206
270.06227505082047390.1245501016409480.937724949179526
280.05811622817775920.1162324563555180.94188377182224
290.1322266217840060.2644532435680130.867773378215994
300.100548684090750.2010973681815010.89945131590925
310.0667193593268690.1334387186537380.933280640673131
320.04779400338704750.0955880067740950.952205996612952
330.07553782942393920.1510756588478780.924462170576061
340.1201545998239380.2403091996478760.879845400176062
350.08738317568259760.1747663513651950.912616824317402
360.1183872808096840.2367745616193680.881612719190316
370.1372364251188250.274472850237650.862763574881175
380.137246827295120.274493654590240.86275317270488
390.1411534379359250.2823068758718490.858846562064075
400.09746562367865710.1949312473573140.902534376321343
410.09878172443623070.1975634488724610.90121827556377
420.08429901663821170.1685980332764230.915700983361788
430.05873565349887460.1174713069977490.941264346501125
440.04947901134381210.09895802268762430.950520988656188
450.03096910723883910.06193821447767820.96903089276116
460.02891663275444020.05783326550888030.97108336724556
470.01906339303736730.03812678607473450.980936606962633
480.01967351397086620.03934702794173240.980326486029134
490.02249686810741260.04499373621482530.977503131892587
500.01581009646243810.03162019292487620.984189903537562
510.02069118131872520.04138236263745040.979308818681275
520.01612042815637270.03224085631274540.983879571843627

\begin{tabular}{lllllllll}
\hline
Goldfeld-Quandt test for Heteroskedasticity \tabularnewline
p-values & Alternative Hypothesis \tabularnewline
breakpoint index & greater & 2-sided & less \tabularnewline
15 & 0.757946406021756 & 0.484107187956489 & 0.242053593978244 \tabularnewline
16 & 0.617358190855651 & 0.765283618288698 & 0.382641809144349 \tabularnewline
17 & 0.517872274624257 & 0.964255450751486 & 0.482127725375743 \tabularnewline
18 & 0.384856412163738 & 0.769712824327475 & 0.615143587836263 \tabularnewline
19 & 0.298977864051747 & 0.597955728103495 & 0.701022135948253 \tabularnewline
20 & 0.213020759475013 & 0.426041518950025 & 0.786979240524987 \tabularnewline
21 & 0.15507279875535 & 0.310145597510699 & 0.84492720124465 \tabularnewline
22 & 0.128883455871986 & 0.257766911743971 & 0.871116544128014 \tabularnewline
23 & 0.0873032751453111 & 0.174606550290622 & 0.912696724854689 \tabularnewline
24 & 0.122774994545826 & 0.245549989091651 & 0.877225005454174 \tabularnewline
25 & 0.0947716129439095 & 0.189543225887819 & 0.90522838705609 \tabularnewline
26 & 0.0737004220979405 & 0.147400844195881 & 0.92629957790206 \tabularnewline
27 & 0.0622750508204739 & 0.124550101640948 & 0.937724949179526 \tabularnewline
28 & 0.0581162281777592 & 0.116232456355518 & 0.94188377182224 \tabularnewline
29 & 0.132226621784006 & 0.264453243568013 & 0.867773378215994 \tabularnewline
30 & 0.10054868409075 & 0.201097368181501 & 0.89945131590925 \tabularnewline
31 & 0.066719359326869 & 0.133438718653738 & 0.933280640673131 \tabularnewline
32 & 0.0477940033870475 & 0.095588006774095 & 0.952205996612952 \tabularnewline
33 & 0.0755378294239392 & 0.151075658847878 & 0.924462170576061 \tabularnewline
34 & 0.120154599823938 & 0.240309199647876 & 0.879845400176062 \tabularnewline
35 & 0.0873831756825976 & 0.174766351365195 & 0.912616824317402 \tabularnewline
36 & 0.118387280809684 & 0.236774561619368 & 0.881612719190316 \tabularnewline
37 & 0.137236425118825 & 0.27447285023765 & 0.862763574881175 \tabularnewline
38 & 0.13724682729512 & 0.27449365459024 & 0.86275317270488 \tabularnewline
39 & 0.141153437935925 & 0.282306875871849 & 0.858846562064075 \tabularnewline
40 & 0.0974656236786571 & 0.194931247357314 & 0.902534376321343 \tabularnewline
41 & 0.0987817244362307 & 0.197563448872461 & 0.90121827556377 \tabularnewline
42 & 0.0842990166382117 & 0.168598033276423 & 0.915700983361788 \tabularnewline
43 & 0.0587356534988746 & 0.117471306997749 & 0.941264346501125 \tabularnewline
44 & 0.0494790113438121 & 0.0989580226876243 & 0.950520988656188 \tabularnewline
45 & 0.0309691072388391 & 0.0619382144776782 & 0.96903089276116 \tabularnewline
46 & 0.0289166327544402 & 0.0578332655088803 & 0.97108336724556 \tabularnewline
47 & 0.0190633930373673 & 0.0381267860747345 & 0.980936606962633 \tabularnewline
48 & 0.0196735139708662 & 0.0393470279417324 & 0.980326486029134 \tabularnewline
49 & 0.0224968681074126 & 0.0449937362148253 & 0.977503131892587 \tabularnewline
50 & 0.0158100964624381 & 0.0316201929248762 & 0.984189903537562 \tabularnewline
51 & 0.0206911813187252 & 0.0413823626374504 & 0.979308818681275 \tabularnewline
52 & 0.0161204281563727 & 0.0322408563127454 & 0.983879571843627 \tabularnewline
\hline
\end{tabular}
%Source: https://freestatistics.org/blog/index.php?pk=112216&T=5

[TABLE]
[ROW][C]Goldfeld-Quandt test for Heteroskedasticity[/C][/ROW]
[ROW][C]p-values[/C][C]Alternative Hypothesis[/C][/ROW]
[ROW][C]breakpoint index[/C][C]greater[/C][C]2-sided[/C][C]less[/C][/ROW]
[ROW][C]15[/C][C]0.757946406021756[/C][C]0.484107187956489[/C][C]0.242053593978244[/C][/ROW]
[ROW][C]16[/C][C]0.617358190855651[/C][C]0.765283618288698[/C][C]0.382641809144349[/C][/ROW]
[ROW][C]17[/C][C]0.517872274624257[/C][C]0.964255450751486[/C][C]0.482127725375743[/C][/ROW]
[ROW][C]18[/C][C]0.384856412163738[/C][C]0.769712824327475[/C][C]0.615143587836263[/C][/ROW]
[ROW][C]19[/C][C]0.298977864051747[/C][C]0.597955728103495[/C][C]0.701022135948253[/C][/ROW]
[ROW][C]20[/C][C]0.213020759475013[/C][C]0.426041518950025[/C][C]0.786979240524987[/C][/ROW]
[ROW][C]21[/C][C]0.15507279875535[/C][C]0.310145597510699[/C][C]0.84492720124465[/C][/ROW]
[ROW][C]22[/C][C]0.128883455871986[/C][C]0.257766911743971[/C][C]0.871116544128014[/C][/ROW]
[ROW][C]23[/C][C]0.0873032751453111[/C][C]0.174606550290622[/C][C]0.912696724854689[/C][/ROW]
[ROW][C]24[/C][C]0.122774994545826[/C][C]0.245549989091651[/C][C]0.877225005454174[/C][/ROW]
[ROW][C]25[/C][C]0.0947716129439095[/C][C]0.189543225887819[/C][C]0.90522838705609[/C][/ROW]
[ROW][C]26[/C][C]0.0737004220979405[/C][C]0.147400844195881[/C][C]0.92629957790206[/C][/ROW]
[ROW][C]27[/C][C]0.0622750508204739[/C][C]0.124550101640948[/C][C]0.937724949179526[/C][/ROW]
[ROW][C]28[/C][C]0.0581162281777592[/C][C]0.116232456355518[/C][C]0.94188377182224[/C][/ROW]
[ROW][C]29[/C][C]0.132226621784006[/C][C]0.264453243568013[/C][C]0.867773378215994[/C][/ROW]
[ROW][C]30[/C][C]0.10054868409075[/C][C]0.201097368181501[/C][C]0.89945131590925[/C][/ROW]
[ROW][C]31[/C][C]0.066719359326869[/C][C]0.133438718653738[/C][C]0.933280640673131[/C][/ROW]
[ROW][C]32[/C][C]0.0477940033870475[/C][C]0.095588006774095[/C][C]0.952205996612952[/C][/ROW]
[ROW][C]33[/C][C]0.0755378294239392[/C][C]0.151075658847878[/C][C]0.924462170576061[/C][/ROW]
[ROW][C]34[/C][C]0.120154599823938[/C][C]0.240309199647876[/C][C]0.879845400176062[/C][/ROW]
[ROW][C]35[/C][C]0.0873831756825976[/C][C]0.174766351365195[/C][C]0.912616824317402[/C][/ROW]
[ROW][C]36[/C][C]0.118387280809684[/C][C]0.236774561619368[/C][C]0.881612719190316[/C][/ROW]
[ROW][C]37[/C][C]0.137236425118825[/C][C]0.27447285023765[/C][C]0.862763574881175[/C][/ROW]
[ROW][C]38[/C][C]0.13724682729512[/C][C]0.27449365459024[/C][C]0.86275317270488[/C][/ROW]
[ROW][C]39[/C][C]0.141153437935925[/C][C]0.282306875871849[/C][C]0.858846562064075[/C][/ROW]
[ROW][C]40[/C][C]0.0974656236786571[/C][C]0.194931247357314[/C][C]0.902534376321343[/C][/ROW]
[ROW][C]41[/C][C]0.0987817244362307[/C][C]0.197563448872461[/C][C]0.90121827556377[/C][/ROW]
[ROW][C]42[/C][C]0.0842990166382117[/C][C]0.168598033276423[/C][C]0.915700983361788[/C][/ROW]
[ROW][C]43[/C][C]0.0587356534988746[/C][C]0.117471306997749[/C][C]0.941264346501125[/C][/ROW]
[ROW][C]44[/C][C]0.0494790113438121[/C][C]0.0989580226876243[/C][C]0.950520988656188[/C][/ROW]
[ROW][C]45[/C][C]0.0309691072388391[/C][C]0.0619382144776782[/C][C]0.96903089276116[/C][/ROW]
[ROW][C]46[/C][C]0.0289166327544402[/C][C]0.0578332655088803[/C][C]0.97108336724556[/C][/ROW]
[ROW][C]47[/C][C]0.0190633930373673[/C][C]0.0381267860747345[/C][C]0.980936606962633[/C][/ROW]
[ROW][C]48[/C][C]0.0196735139708662[/C][C]0.0393470279417324[/C][C]0.980326486029134[/C][/ROW]
[ROW][C]49[/C][C]0.0224968681074126[/C][C]0.0449937362148253[/C][C]0.977503131892587[/C][/ROW]
[ROW][C]50[/C][C]0.0158100964624381[/C][C]0.0316201929248762[/C][C]0.984189903537562[/C][/ROW]
[ROW][C]51[/C][C]0.0206911813187252[/C][C]0.0413823626374504[/C][C]0.979308818681275[/C][/ROW]
[ROW][C]52[/C][C]0.0161204281563727[/C][C]0.0322408563127454[/C][C]0.983879571843627[/C][/ROW]
[/TABLE]
Source: https://freestatistics.org/blog/index.php?pk=112216&T=5

Globally Unique Identifier (entire table): ba.freestatistics.org/blog/index.php?pk=112216&T=5

As an alternative you can also use a QR Code:  

The GUIDs for individual cells are displayed in the table below:

Goldfeld-Quandt test for Heteroskedasticity
p-valuesAlternative Hypothesis
breakpoint indexgreater2-sidedless
150.7579464060217560.4841071879564890.242053593978244
160.6173581908556510.7652836182886980.382641809144349
170.5178722746242570.9642554507514860.482127725375743
180.3848564121637380.7697128243274750.615143587836263
190.2989778640517470.5979557281034950.701022135948253
200.2130207594750130.4260415189500250.786979240524987
210.155072798755350.3101455975106990.84492720124465
220.1288834558719860.2577669117439710.871116544128014
230.08730327514531110.1746065502906220.912696724854689
240.1227749945458260.2455499890916510.877225005454174
250.09477161294390950.1895432258878190.90522838705609
260.07370042209794050.1474008441958810.92629957790206
270.06227505082047390.1245501016409480.937724949179526
280.05811622817775920.1162324563555180.94188377182224
290.1322266217840060.2644532435680130.867773378215994
300.100548684090750.2010973681815010.89945131590925
310.0667193593268690.1334387186537380.933280640673131
320.04779400338704750.0955880067740950.952205996612952
330.07553782942393920.1510756588478780.924462170576061
340.1201545998239380.2403091996478760.879845400176062
350.08738317568259760.1747663513651950.912616824317402
360.1183872808096840.2367745616193680.881612719190316
370.1372364251188250.274472850237650.862763574881175
380.137246827295120.274493654590240.86275317270488
390.1411534379359250.2823068758718490.858846562064075
400.09746562367865710.1949312473573140.902534376321343
410.09878172443623070.1975634488724610.90121827556377
420.08429901663821170.1685980332764230.915700983361788
430.05873565349887460.1174713069977490.941264346501125
440.04947901134381210.09895802268762430.950520988656188
450.03096910723883910.06193821447767820.96903089276116
460.02891663275444020.05783326550888030.97108336724556
470.01906339303736730.03812678607473450.980936606962633
480.01967351397086620.03934702794173240.980326486029134
490.02249686810741260.04499373621482530.977503131892587
500.01581009646243810.03162019292487620.984189903537562
510.02069118131872520.04138236263745040.979308818681275
520.01612042815637270.03224085631274540.983879571843627


Meta Analysis of Goldfeld-Quandt test for Heteroskedasticity
Description# significant tests% significant testsOK/NOK
1% type I error level00OK
5% type I error level60.157894736842105NOK
10% type I error level100.263157894736842NOK

\begin{tabular}{lllllllll}
\hline
Meta Analysis of Goldfeld-Quandt test for Heteroskedasticity \tabularnewline
Description & # significant tests & % significant tests & OK/NOK \tabularnewline
1% type I error level & 0 & 0 & OK \tabularnewline
5% type I error level & 6 & 0.157894736842105 & NOK \tabularnewline
10% type I error level & 10 & 0.263157894736842 & NOK \tabularnewline
\hline
\end{tabular}
%Source: https://freestatistics.org/blog/index.php?pk=112216&T=6

[TABLE]
[ROW][C]Meta Analysis of Goldfeld-Quandt test for Heteroskedasticity[/C][/ROW]
[ROW][C]Description[/C][C]# significant tests[/C][C]% significant tests[/C][C]OK/NOK[/C][/ROW]
[ROW][C]1% type I error level[/C][C]0[/C][C]0[/C][C]OK[/C][/ROW]
[ROW][C]5% type I error level[/C][C]6[/C][C]0.157894736842105[/C][C]NOK[/C][/ROW]
[ROW][C]10% type I error level[/C][C]10[/C][C]0.263157894736842[/C][C]NOK[/C][/ROW]
[/TABLE]
Source: https://freestatistics.org/blog/index.php?pk=112216&T=6

Globally Unique Identifier (entire table): ba.freestatistics.org/blog/index.php?pk=112216&T=6

As an alternative you can also use a QR Code:  

The GUIDs for individual cells are displayed in the table below:

Meta Analysis of Goldfeld-Quandt test for Heteroskedasticity
Description# significant tests% significant testsOK/NOK
1% type I error level00OK
5% type I error level60.157894736842105NOK
10% type I error level100.263157894736842NOK


Parameters (Session):
par1 = 1 ; par2 = Include Monthly Dummies ; par3 = No Linear Trend ;
Parameters (R input):
par1 = 1 ; par2 = Include Monthly Dummies ; par3 = No Linear Trend ;
R code (references can be found in the software module):
library(lattice)
library(lmtest)
n25 <- 25 #minimum number of obs. for Goldfeld-Quandt test
par1 <- as.numeric(par1)
x <- t(y)
k <- length(x[1,])
n <- length(x[,1])
x1 <- cbind(x[,par1], x[,1:k!=par1])
mycolnames <- c(colnames(x)[par1], colnames(x)[1:k!=par1])
colnames(x1) <- mycolnames #colnames(x)[par1]
x <- x1
if (par3 == 'First Differences'){
x2 <- array(0, dim=c(n-1,k), dimnames=list(1:(n-1), paste('(1-B)',colnames(x),sep='')))
for (i in 1:n-1) {
for (j in 1:k) {
x2[i,j] <- x[i+1,j] - x[i,j]
}
}
x <- x2
}
if (par2 == 'Include Monthly Dummies'){
x2 <- array(0, dim=c(n,11), dimnames=list(1:n, paste('M', seq(1:11), sep ='')))
for (i in 1:11){
x2[seq(i,n,12),i] <- 1
}
x <- cbind(x, x2)
}
if (par2 == 'Include Quarterly Dummies'){
x2 <- array(0, dim=c(n,3), dimnames=list(1:n, paste('Q', seq(1:3), sep ='')))
for (i in 1:3){
x2[seq(i,n,4),i] <- 1
}
x <- cbind(x, x2)
}
k <- length(x[1,])
if (par3 == 'Linear Trend'){
x <- cbind(x, c(1:n))
colnames(x)[k+1] <- 't'
}
x
k <- length(x[1,])
df <- as.data.frame(x)
(mylm <- lm(df))
(mysum <- summary(mylm))
if (n > n25) {
kp3 <- k + 3
nmkm3 <- n - k - 3
gqarr <- array(NA, dim=c(nmkm3-kp3+1,3))
numgqtests <- 0
numsignificant1 <- 0
numsignificant5 <- 0
numsignificant10 <- 0
for (mypoint in kp3:nmkm3) {
j <- 0
numgqtests <- numgqtests + 1
for (myalt in c('greater', 'two.sided', 'less')) {
j <- j + 1
gqarr[mypoint-kp3+1,j] <- gqtest(mylm, point=mypoint, alternative=myalt)$p.value
}
if (gqarr[mypoint-kp3+1,2] < 0.01) numsignificant1 <- numsignificant1 + 1
if (gqarr[mypoint-kp3+1,2] < 0.05) numsignificant5 <- numsignificant5 + 1
if (gqarr[mypoint-kp3+1,2] < 0.10) numsignificant10 <- numsignificant10 + 1
}
gqarr
}
bitmap(file='test0.png')
plot(x[,1], type='l', main='Actuals and Interpolation', ylab='value of Actuals and Interpolation (dots)', xlab='time or index')
points(x[,1]-mysum$resid)
grid()
dev.off()
bitmap(file='test1.png')
plot(mysum$resid, type='b', pch=19, main='Residuals', ylab='value of Residuals', xlab='time or index')
grid()
dev.off()
bitmap(file='test2.png')
hist(mysum$resid, main='Residual Histogram', xlab='values of Residuals')
grid()
dev.off()
bitmap(file='test3.png')
densityplot(~mysum$resid,col='black',main='Residual Density Plot', xlab='values of Residuals')
dev.off()
bitmap(file='test4.png')
qqnorm(mysum$resid, main='Residual Normal Q-Q Plot')
qqline(mysum$resid)
grid()
dev.off()
(myerror <- as.ts(mysum$resid))
bitmap(file='test5.png')
dum <- cbind(lag(myerror,k=1),myerror)
dum
dum1 <- dum[2:length(myerror),]
dum1
z <- as.data.frame(dum1)
z
plot(z,main=paste('Residual Lag plot, lowess, and regression line'), ylab='values of Residuals', xlab='lagged values of Residuals')
lines(lowess(z))
abline(lm(z))
grid()
dev.off()
bitmap(file='test6.png')
acf(mysum$resid, lag.max=length(mysum$resid)/2, main='Residual Autocorrelation Function')
grid()
dev.off()
bitmap(file='test7.png')
pacf(mysum$resid, lag.max=length(mysum$resid)/2, main='Residual Partial Autocorrelation Function')
grid()
dev.off()
bitmap(file='test8.png')
opar <- par(mfrow = c(2,2), oma = c(0, 0, 1.1, 0))
plot(mylm, las = 1, sub='Residual Diagnostics')
par(opar)
dev.off()
if (n > n25) {
bitmap(file='test9.png')
plot(kp3:nmkm3,gqarr[,2], main='Goldfeld-Quandt test',ylab='2-sided p-value',xlab='breakpoint')
grid()
dev.off()
}
load(file='createtable')
a<-table.start()
a<-table.row.start(a)
a<-table.element(a, 'Multiple Linear Regression - Estimated Regression Equation', 1, TRUE)
a<-table.row.end(a)
myeq <- colnames(x)[1]
myeq <- paste(myeq, '[t] = ', sep='')
for (i in 1:k){
if (mysum$coefficients[i,1] > 0) myeq <- paste(myeq, '+', '')
myeq <- paste(myeq, mysum$coefficients[i,1], sep=' ')
if (rownames(mysum$coefficients)[i] != '(Intercept)') {
myeq <- paste(myeq, rownames(mysum$coefficients)[i], sep='')
if (rownames(mysum$coefficients)[i] != 't') myeq <- paste(myeq, '[t]', sep='')
}
}
myeq <- paste(myeq, ' + e[t]')
a<-table.row.start(a)
a<-table.element(a, myeq)
a<-table.row.end(a)
a<-table.end(a)
table.save(a,file='mytable1.tab')
a<-table.start()
a<-table.row.start(a)
a<-table.element(a,hyperlink('ols1.htm','Multiple Linear Regression - Ordinary Least Squares',''), 6, TRUE)
a<-table.row.end(a)
a<-table.row.start(a)
a<-table.element(a,'Variable',header=TRUE)
a<-table.element(a,'Parameter',header=TRUE)
a<-table.element(a,'S.D.',header=TRUE)
a<-table.element(a,'T-STAT
H0: parameter = 0',header=TRUE)
a<-table.element(a,'2-tail p-value',header=TRUE)
a<-table.element(a,'1-tail p-value',header=TRUE)
a<-table.row.end(a)
for (i in 1:k){
a<-table.row.start(a)
a<-table.element(a,rownames(mysum$coefficients)[i],header=TRUE)
a<-table.element(a,mysum$coefficients[i,1])
a<-table.element(a, round(mysum$coefficients[i,2],6))
a<-table.element(a, round(mysum$coefficients[i,3],4))
a<-table.element(a, round(mysum$coefficients[i,4],6))
a<-table.element(a, round(mysum$coefficients[i,4]/2,6))
a<-table.row.end(a)
}
a<-table.end(a)
table.save(a,file='mytable2.tab')
a<-table.start()
a<-table.row.start(a)
a<-table.element(a, 'Multiple Linear Regression - Regression Statistics', 2, TRUE)
a<-table.row.end(a)
a<-table.row.start(a)
a<-table.element(a, 'Multiple R',1,TRUE)
a<-table.element(a, sqrt(mysum$r.squared))
a<-table.row.end(a)
a<-table.row.start(a)
a<-table.element(a, 'R-squared',1,TRUE)
a<-table.element(a, mysum$r.squared)
a<-table.row.end(a)
a<-table.row.start(a)
a<-table.element(a, 'Adjusted R-squared',1,TRUE)
a<-table.element(a, mysum$adj.r.squared)
a<-table.row.end(a)
a<-table.row.start(a)
a<-table.element(a, 'F-TEST (value)',1,TRUE)
a<-table.element(a, mysum$fstatistic[1])
a<-table.row.end(a)
a<-table.row.start(a)
a<-table.element(a, 'F-TEST (DF numerator)',1,TRUE)
a<-table.element(a, mysum$fstatistic[2])
a<-table.row.end(a)
a<-table.row.start(a)
a<-table.element(a, 'F-TEST (DF denominator)',1,TRUE)
a<-table.element(a, mysum$fstatistic[3])
a<-table.row.end(a)
a<-table.row.start(a)
a<-table.element(a, 'p-value',1,TRUE)
a<-table.element(a, 1-pf(mysum$fstatistic[1],mysum$fstatistic[2],mysum$fstatistic[3]))
a<-table.row.end(a)
a<-table.row.start(a)
a<-table.element(a, 'Multiple Linear Regression - Residual Statistics', 2, TRUE)
a<-table.row.end(a)
a<-table.row.start(a)
a<-table.element(a, 'Residual Standard Deviation',1,TRUE)
a<-table.element(a, mysum$sigma)
a<-table.row.end(a)
a<-table.row.start(a)
a<-table.element(a, 'Sum Squared Residuals',1,TRUE)
a<-table.element(a, sum(myerror*myerror))
a<-table.row.end(a)
a<-table.end(a)
table.save(a,file='mytable3.tab')
a<-table.start()
a<-table.row.start(a)
a<-table.element(a, 'Multiple Linear Regression - Actuals, Interpolation, and Residuals', 4, TRUE)
a<-table.row.end(a)
a<-table.row.start(a)
a<-table.element(a, 'Time or Index', 1, TRUE)
a<-table.element(a, 'Actuals', 1, TRUE)
a<-table.element(a, 'Interpolation
Forecast', 1, TRUE)
a<-table.element(a, 'Residuals
Prediction Error', 1, TRUE)
a<-table.row.end(a)
for (i in 1:n) {
a<-table.row.start(a)
a<-table.element(a,i, 1, TRUE)
a<-table.element(a,x[i])
a<-table.element(a,x[i]-mysum$resid[i])
a<-table.element(a,mysum$resid[i])
a<-table.row.end(a)
}
a<-table.end(a)
table.save(a,file='mytable4.tab')
if (n > n25) {
a<-table.start()
a<-table.row.start(a)
a<-table.element(a,'Goldfeld-Quandt test for Heteroskedasticity',4,TRUE)
a<-table.row.end(a)
a<-table.row.start(a)
a<-table.element(a,'p-values',header=TRUE)
a<-table.element(a,'Alternative Hypothesis',3,header=TRUE)
a<-table.row.end(a)
a<-table.row.start(a)
a<-table.element(a,'breakpoint index',header=TRUE)
a<-table.element(a,'greater',header=TRUE)
a<-table.element(a,'2-sided',header=TRUE)
a<-table.element(a,'less',header=TRUE)
a<-table.row.end(a)
for (mypoint in kp3:nmkm3) {
a<-table.row.start(a)
a<-table.element(a,mypoint,header=TRUE)
a<-table.element(a,gqarr[mypoint-kp3+1,1])
a<-table.element(a,gqarr[mypoint-kp3+1,2])
a<-table.element(a,gqarr[mypoint-kp3+1,3])
a<-table.row.end(a)
}
a<-table.end(a)
table.save(a,file='mytable5.tab')
a<-table.start()
a<-table.row.start(a)
a<-table.element(a,'Meta Analysis of Goldfeld-Quandt test for Heteroskedasticity',4,TRUE)
a<-table.row.end(a)
a<-table.row.start(a)
a<-table.element(a,'Description',header=TRUE)
a<-table.element(a,'# significant tests',header=TRUE)
a<-table.element(a,'% significant tests',header=TRUE)
a<-table.element(a,'OK/NOK',header=TRUE)
a<-table.row.end(a)
a<-table.row.start(a)
a<-table.element(a,'1% type I error level',header=TRUE)
a<-table.element(a,numsignificant1)
a<-table.element(a,numsignificant1/numgqtests)
if (numsignificant1/numgqtests < 0.01) dum <- 'OK' else dum <- 'NOK'
a<-table.element(a,dum)
a<-table.row.end(a)
a<-table.row.start(a)
a<-table.element(a,'5% type I error level',header=TRUE)
a<-table.element(a,numsignificant5)
a<-table.element(a,numsignificant5/numgqtests)
if (numsignificant5/numgqtests < 0.05) dum <- 'OK' else dum <- 'NOK'
a<-table.element(a,dum)
a<-table.row.end(a)
a<-table.row.start(a)
a<-table.element(a,'10% type I error level',header=TRUE)
a<-table.element(a,numsignificant10)
a<-table.element(a,numsignificant10/numgqtests)
if (numsignificant10/numgqtests < 0.1) dum <- 'OK' else dum <- 'NOK'
a<-table.element(a,dum)
a<-table.row.end(a)
a<-table.end(a)
table.save(a,file='mytable6.tab')
}