Free Statistics

of Irreproducible Research!

Author's title

Author*The author of this computation has been verified*
R Software Modulerwasp_multipleregression.wasp
Title produced by softwareMultiple Regression
Date of computationSat, 18 Dec 2010 12:25:58 +0000
Cite this page as followsStatistical Computations at FreeStatistics.org, Office for Research Development and Education, URL https://freestatistics.org/blog/index.php?v=date/2010/Dec/18/t1292675056dbbjaxypxzovu4z.htm/, Retrieved Mon, 29 Apr 2024 14:29:48 +0000
Statistical Computations at FreeStatistics.org, Office for Research Development and Education, URL https://freestatistics.org/blog/index.php?pk=111886, Retrieved Mon, 29 Apr 2024 14:29:48 +0000
QR Codes:

Original text written by user:
IsPrivate?No (this computation is public)
User-defined keywords
Estimated Impact194
Family? (F = Feedback message, R = changed R code, M = changed R Module, P = changed Parameters, D = changed Data)
-     [Multiple Regression] [] [2009-11-24 11:34:57] [f57b281e621ed7dff28b90886f5aa97c]
-   PD  [Multiple Regression] [] [2009-11-24 12:09:41] [f57b281e621ed7dff28b90886f5aa97c]
-    D    [Multiple Regression] [] [2009-11-24 12:16:30] [f57b281e621ed7dff28b90886f5aa97c]
-    D        [Multiple Regression] [2 vertragingen] [2010-12-18 12:25:58] [19046f4a6967f3fb6f5f17d42e7d38f2] [Current]
Feedback Forum

Post a new message
Dataseries X:
102.8	112.5	116.7	116.1
98.1	113	112.5	107.5
113.9	126.4	113	116.7
80.9	114.1	126.4	112.5
95.7	112.5	114.1	113
113.2	112.4	112.5	126.4
105.9	113.1	112.4	114.1
108.8	116.3	113.1	112.5
102.3	111.7	116.3	112.4
99	118.8	111.7	113.1
100.7	116.5	118.8	116.3
115.5	125.1	116.5	111.7
100.7	113.1	125.1	118.8
109.9	119.6	113.1	116.5
114.6	114.4	119.6	125.1
85.4	114	114.4	113.1
100.5	117.8	114	119.6
114.8	117	117.8	114.4
116.5	120.9	117	114
112.9	115	120.9	117.8
102	117.3	115	117
106	119.4	117.3	120.9
105.3	114.9	119.4	115
118.8	125.8	114.9	117.3
106.1	117.6	125.8	119.4
109.3	117.6	117.6	114.9
117.2	114.9	117.6	125.8
92.5	121.9	114.9	117.6
104.2	117	121.9	117.6
112.5	106.4	117	114.9
122.4	110.5	106.4	121.9
113.3	113.6	110.5	117
100	114.2	113.6	106.4
110.7	125.4	114.2	110.5
112.8	124.6	125.4	113.6
109.8	120.2	124.6	114.2
117.3	120.8	120.2	125.4
109.1	111.4	120.8	124.6
115.9	124.1	111.4	120.2
96	120.2	124.1	120.8
99.8	125.5	120.2	111.4
116.8	116	125.5	124.1
115.7	117	116	120.2
99.4	105.7	117	125.5
94.3	102	105.7	116
91	106.4	102	117
93.2	96.9	106.4	105.7
103.1	107.6	96.9	102
94.1	98.8	107.6	106.4
91.8	101.1	98.8	96.9
102.7	105.7	101.1	107.6
82.6	104.6	105.7	98.8
89.1	103.2	104.6	101.1
104.5	101.6	103.2	105.7
105.1	106.7	101.6	104.6
95.1	99.5	106.7	103.2
88.7	101	99.5	101.6


Summary of computational transaction
Raw Inputview raw input (R code)
Raw Outputview raw output of R engine
Computing time5 seconds
R Server'Sir Ronald Aylmer Fisher' @ 193.190.124.24

\begin{tabular}{lllllllll}
\hline
Summary of computational transaction \tabularnewline
Raw Input & view raw input (R code)  \tabularnewline
Raw Output & view raw output of R engine  \tabularnewline
Computing time & 5 seconds \tabularnewline
R Server & 'Sir Ronald Aylmer Fisher' @ 193.190.124.24 \tabularnewline
\hline
\end{tabular}
%Source: https://freestatistics.org/blog/index.php?pk=111886&T=0

[TABLE]
[ROW][C]Summary of computational transaction[/C][/ROW]
[ROW][C]Raw Input[/C][C]view raw input (R code) [/C][/ROW]
[ROW][C]Raw Output[/C][C]view raw output of R engine [/C][/ROW]
[ROW][C]Computing time[/C][C]5 seconds[/C][/ROW]
[ROW][C]R Server[/C][C]'Sir Ronald Aylmer Fisher' @ 193.190.124.24[/C][/ROW]
[/TABLE]
Source: https://freestatistics.org/blog/index.php?pk=111886&T=0

Globally Unique Identifier (entire table): ba.freestatistics.org/blog/index.php?pk=111886&T=0

As an alternative you can also use a QR Code:  

The GUIDs for individual cells are displayed in the table below:

Summary of computational transaction
Raw Inputview raw input (R code)
Raw Outputview raw output of R engine
Computing time5 seconds
R Server'Sir Ronald Aylmer Fisher' @ 193.190.124.24


Multiple Linear Regression - Estimated Regression Equation
Y(t)[t] = + 27.5646541936156 + 0.719237622037051T.I.P.[t] + 0.351615816868488`Y(t-1)`[t] -0.225481858966781`Y(t-3)`[t] -2.87531712508168M1[t] -1.25845267587132M2[t] -1.64388521197177M3[t] + 11.4973887999212M4[t] + 5.12018350407216M5[t] -8.78441952464868M6[t] -5.16373479336386M7[t] -4.47697332405873M8[t] + 1.16759647044438M9[t] + 6.50191392593397M10[t] -1.4199990435579M11[t] -0.100533009976323t + e[t]

\begin{tabular}{lllllllll}
\hline
Multiple Linear Regression - Estimated Regression Equation \tabularnewline
Y(t)[t] =  +  27.5646541936156 +  0.719237622037051T.I.P.[t] +  0.351615816868488`Y(t-1)`[t] -0.225481858966781`Y(t-3)`[t] -2.87531712508168M1[t] -1.25845267587132M2[t] -1.64388521197177M3[t] +  11.4973887999212M4[t] +  5.12018350407216M5[t] -8.78441952464868M6[t] -5.16373479336386M7[t] -4.47697332405873M8[t] +  1.16759647044438M9[t] +  6.50191392593397M10[t] -1.4199990435579M11[t] -0.100533009976323t  + e[t] \tabularnewline
\hline
\end{tabular}
%Source: https://freestatistics.org/blog/index.php?pk=111886&T=1

[TABLE]
[ROW][C]Multiple Linear Regression - Estimated Regression Equation[/C][/ROW]
[ROW][C]Y(t)[t] =  +  27.5646541936156 +  0.719237622037051T.I.P.[t] +  0.351615816868488`Y(t-1)`[t] -0.225481858966781`Y(t-3)`[t] -2.87531712508168M1[t] -1.25845267587132M2[t] -1.64388521197177M3[t] +  11.4973887999212M4[t] +  5.12018350407216M5[t] -8.78441952464868M6[t] -5.16373479336386M7[t] -4.47697332405873M8[t] +  1.16759647044438M9[t] +  6.50191392593397M10[t] -1.4199990435579M11[t] -0.100533009976323t  + e[t][/C][/ROW]
[/TABLE]
Source: https://freestatistics.org/blog/index.php?pk=111886&T=1

Globally Unique Identifier (entire table): ba.freestatistics.org/blog/index.php?pk=111886&T=1

As an alternative you can also use a QR Code:  

The GUIDs for individual cells are displayed in the table below:

Multiple Linear Regression - Estimated Regression Equation
Y(t)[t] = + 27.5646541936156 + 0.719237622037051T.I.P.[t] + 0.351615816868488`Y(t-1)`[t] -0.225481858966781`Y(t-3)`[t] -2.87531712508168M1[t] -1.25845267587132M2[t] -1.64388521197177M3[t] + 11.4973887999212M4[t] + 5.12018350407216M5[t] -8.78441952464868M6[t] -5.16373479336386M7[t] -4.47697332405873M8[t] + 1.16759647044438M9[t] + 6.50191392593397M10[t] -1.4199990435579M11[t] -0.100533009976323t + e[t]


Multiple Linear Regression - Ordinary Least Squares
VariableParameterS.D.T-STATH0: parameter = 02-tail p-value1-tail p-value
(Intercept)27.564654193615611.1542382.47120.017710.008855
T.I.P.0.7192376220370510.1105766.504400
`Y(t-1)`0.3516158168684880.1115723.15150.0030330.001516
`Y(t-3)`-0.2254818589667810.111906-2.01490.0505010.025251
M1-2.875317125081682.810467-1.02310.3122710.156136
M2-1.258452675871322.606872-0.48270.6318450.315922
M3-1.643885211971772.585307-0.63590.5284030.264202
M411.49738879992123.7932593.0310.004210.002105
M55.120183504072162.9508221.73520.0902230.045111
M6-8.784419524648682.498781-3.51550.0010870.000543
M7-5.163734793363862.503896-2.06230.0455560.022778
M8-4.476973324058732.606334-1.71770.0933920.046696
M91.167596470444382.8413130.41090.683260.34163
M106.501913925933972.9025032.24010.0305670.015283
M11-1.41999904355792.854385-0.49750.6215080.310754
t-0.1005330099763230.034392-2.92310.0056180.002809

\begin{tabular}{lllllllll}
\hline
Multiple Linear Regression - Ordinary Least Squares \tabularnewline
Variable & Parameter & S.D. & T-STATH0: parameter = 0 & 2-tail p-value & 1-tail p-value \tabularnewline
(Intercept) & 27.5646541936156 & 11.154238 & 2.4712 & 0.01771 & 0.008855 \tabularnewline
T.I.P. & 0.719237622037051 & 0.110576 & 6.5044 & 0 & 0 \tabularnewline
`Y(t-1)` & 0.351615816868488 & 0.111572 & 3.1515 & 0.003033 & 0.001516 \tabularnewline
`Y(t-3)` & -0.225481858966781 & 0.111906 & -2.0149 & 0.050501 & 0.025251 \tabularnewline
M1 & -2.87531712508168 & 2.810467 & -1.0231 & 0.312271 & 0.156136 \tabularnewline
M2 & -1.25845267587132 & 2.606872 & -0.4827 & 0.631845 & 0.315922 \tabularnewline
M3 & -1.64388521197177 & 2.585307 & -0.6359 & 0.528403 & 0.264202 \tabularnewline
M4 & 11.4973887999212 & 3.793259 & 3.031 & 0.00421 & 0.002105 \tabularnewline
M5 & 5.12018350407216 & 2.950822 & 1.7352 & 0.090223 & 0.045111 \tabularnewline
M6 & -8.78441952464868 & 2.498781 & -3.5155 & 0.001087 & 0.000543 \tabularnewline
M7 & -5.16373479336386 & 2.503896 & -2.0623 & 0.045556 & 0.022778 \tabularnewline
M8 & -4.47697332405873 & 2.606334 & -1.7177 & 0.093392 & 0.046696 \tabularnewline
M9 & 1.16759647044438 & 2.841313 & 0.4109 & 0.68326 & 0.34163 \tabularnewline
M10 & 6.50191392593397 & 2.902503 & 2.2401 & 0.030567 & 0.015283 \tabularnewline
M11 & -1.4199990435579 & 2.854385 & -0.4975 & 0.621508 & 0.310754 \tabularnewline
t & -0.100533009976323 & 0.034392 & -2.9231 & 0.005618 & 0.002809 \tabularnewline
\hline
\end{tabular}
%Source: https://freestatistics.org/blog/index.php?pk=111886&T=2

[TABLE]
[ROW][C]Multiple Linear Regression - Ordinary Least Squares[/C][/ROW]
[ROW][C]Variable[/C][C]Parameter[/C][C]S.D.[/C][C]T-STATH0: parameter = 0[/C][C]2-tail p-value[/C][C]1-tail p-value[/C][/ROW]
[ROW][C](Intercept)[/C][C]27.5646541936156[/C][C]11.154238[/C][C]2.4712[/C][C]0.01771[/C][C]0.008855[/C][/ROW]
[ROW][C]T.I.P.[/C][C]0.719237622037051[/C][C]0.110576[/C][C]6.5044[/C][C]0[/C][C]0[/C][/ROW]
[ROW][C]`Y(t-1)`[/C][C]0.351615816868488[/C][C]0.111572[/C][C]3.1515[/C][C]0.003033[/C][C]0.001516[/C][/ROW]
[ROW][C]`Y(t-3)`[/C][C]-0.225481858966781[/C][C]0.111906[/C][C]-2.0149[/C][C]0.050501[/C][C]0.025251[/C][/ROW]
[ROW][C]M1[/C][C]-2.87531712508168[/C][C]2.810467[/C][C]-1.0231[/C][C]0.312271[/C][C]0.156136[/C][/ROW]
[ROW][C]M2[/C][C]-1.25845267587132[/C][C]2.606872[/C][C]-0.4827[/C][C]0.631845[/C][C]0.315922[/C][/ROW]
[ROW][C]M3[/C][C]-1.64388521197177[/C][C]2.585307[/C][C]-0.6359[/C][C]0.528403[/C][C]0.264202[/C][/ROW]
[ROW][C]M4[/C][C]11.4973887999212[/C][C]3.793259[/C][C]3.031[/C][C]0.00421[/C][C]0.002105[/C][/ROW]
[ROW][C]M5[/C][C]5.12018350407216[/C][C]2.950822[/C][C]1.7352[/C][C]0.090223[/C][C]0.045111[/C][/ROW]
[ROW][C]M6[/C][C]-8.78441952464868[/C][C]2.498781[/C][C]-3.5155[/C][C]0.001087[/C][C]0.000543[/C][/ROW]
[ROW][C]M7[/C][C]-5.16373479336386[/C][C]2.503896[/C][C]-2.0623[/C][C]0.045556[/C][C]0.022778[/C][/ROW]
[ROW][C]M8[/C][C]-4.47697332405873[/C][C]2.606334[/C][C]-1.7177[/C][C]0.093392[/C][C]0.046696[/C][/ROW]
[ROW][C]M9[/C][C]1.16759647044438[/C][C]2.841313[/C][C]0.4109[/C][C]0.68326[/C][C]0.34163[/C][/ROW]
[ROW][C]M10[/C][C]6.50191392593397[/C][C]2.902503[/C][C]2.2401[/C][C]0.030567[/C][C]0.015283[/C][/ROW]
[ROW][C]M11[/C][C]-1.4199990435579[/C][C]2.854385[/C][C]-0.4975[/C][C]0.621508[/C][C]0.310754[/C][/ROW]
[ROW][C]t[/C][C]-0.100533009976323[/C][C]0.034392[/C][C]-2.9231[/C][C]0.005618[/C][C]0.002809[/C][/ROW]
[/TABLE]
Source: https://freestatistics.org/blog/index.php?pk=111886&T=2

Globally Unique Identifier (entire table): ba.freestatistics.org/blog/index.php?pk=111886&T=2

As an alternative you can also use a QR Code:  

The GUIDs for individual cells are displayed in the table below:

Multiple Linear Regression - Ordinary Least Squares
VariableParameterS.D.T-STATH0: parameter = 02-tail p-value1-tail p-value
(Intercept)27.564654193615611.1542382.47120.017710.008855
T.I.P.0.7192376220370510.1105766.504400
`Y(t-1)`0.3516158168684880.1115723.15150.0030330.001516
`Y(t-3)`-0.2254818589667810.111906-2.01490.0505010.025251
M1-2.875317125081682.810467-1.02310.3122710.156136
M2-1.258452675871322.606872-0.48270.6318450.315922
M3-1.643885211971772.585307-0.63590.5284030.264202
M411.49738879992123.7932593.0310.004210.002105
M55.120183504072162.9508221.73520.0902230.045111
M6-8.784419524648682.498781-3.51550.0010870.000543
M7-5.163734793363862.503896-2.06230.0455560.022778
M8-4.476973324058732.606334-1.71770.0933920.046696
M91.167596470444382.8413130.41090.683260.34163
M106.501913925933972.9025032.24010.0305670.015283
M11-1.41999904355792.854385-0.49750.6215080.310754
t-0.1005330099763230.034392-2.92310.0056180.002809


Multiple Linear Regression - Regression Statistics
Multiple R0.913268637606618
R-squared0.834059604435848
Adjusted R-squared0.773349703619695
F-TEST (value)13.7384445242568
F-TEST (DF numerator)15
F-TEST (DF denominator)41
p-value1.75230940868687e-11
Multiple Linear Regression - Residual Statistics
Residual Standard Deviation3.62948298030304
Sum Squared Residuals540.099014876688

\begin{tabular}{lllllllll}
\hline
Multiple Linear Regression - Regression Statistics \tabularnewline
Multiple R & 0.913268637606618 \tabularnewline
R-squared & 0.834059604435848 \tabularnewline
Adjusted R-squared & 0.773349703619695 \tabularnewline
F-TEST (value) & 13.7384445242568 \tabularnewline
F-TEST (DF numerator) & 15 \tabularnewline
F-TEST (DF denominator) & 41 \tabularnewline
p-value & 1.75230940868687e-11 \tabularnewline
Multiple Linear Regression - Residual Statistics \tabularnewline
Residual Standard Deviation & 3.62948298030304 \tabularnewline
Sum Squared Residuals & 540.099014876688 \tabularnewline
\hline
\end{tabular}
%Source: https://freestatistics.org/blog/index.php?pk=111886&T=3

[TABLE]
[ROW][C]Multiple Linear Regression - Regression Statistics[/C][/ROW]
[ROW][C]Multiple R[/C][C]0.913268637606618[/C][/ROW]
[ROW][C]R-squared[/C][C]0.834059604435848[/C][/ROW]
[ROW][C]Adjusted R-squared[/C][C]0.773349703619695[/C][/ROW]
[ROW][C]F-TEST (value)[/C][C]13.7384445242568[/C][/ROW]
[ROW][C]F-TEST (DF numerator)[/C][C]15[/C][/ROW]
[ROW][C]F-TEST (DF denominator)[/C][C]41[/C][/ROW]
[ROW][C]p-value[/C][C]1.75230940868687e-11[/C][/ROW]
[ROW][C]Multiple Linear Regression - Residual Statistics[/C][/ROW]
[ROW][C]Residual Standard Deviation[/C][C]3.62948298030304[/C][/ROW]
[ROW][C]Sum Squared Residuals[/C][C]540.099014876688[/C][/ROW]
[/TABLE]
Source: https://freestatistics.org/blog/index.php?pk=111886&T=3

Globally Unique Identifier (entire table): ba.freestatistics.org/blog/index.php?pk=111886&T=3

As an alternative you can also use a QR Code:  

The GUIDs for individual cells are displayed in the table below:

Multiple Linear Regression - Regression Statistics
Multiple R0.913268637606618
R-squared0.834059604435848
Adjusted R-squared0.773349703619695
F-TEST (value)13.7384445242568
F-TEST (DF numerator)15
F-TEST (DF denominator)41
p-value1.75230940868687e-11
Multiple Linear Regression - Residual Statistics
Residual Standard Deviation3.62948298030304
Sum Squared Residuals540.099014876688


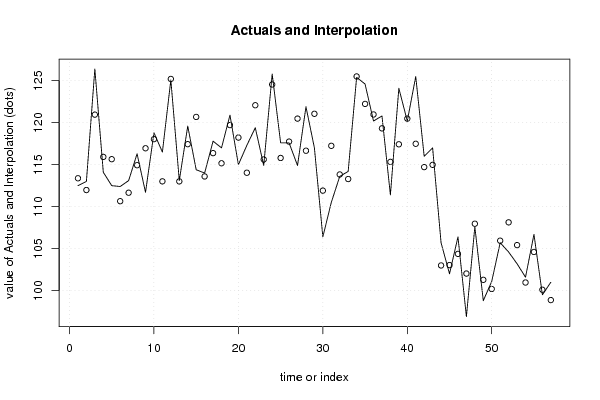
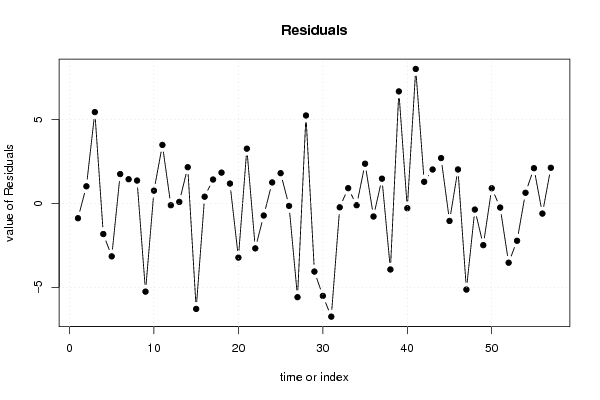
Multiple Linear Regression - Actuals, Interpolation, and Residuals
Time or IndexActualsInterpolationForecastResidualsPrediction Error
1112.5113.381553606476-0.881553606475701
2113111.9798257784021.02017422159778
3126.4120.9591894664515.44081053354928
4114.1115.923764694843-1.82376469484289
5112.5115.6531277182-3.15312771820009
6112.4110.6506078480071.74939215199312
7113.1111.6585902120491.44140978795053
8116.3114.9375098214411.36249017855949
9111.7116.954220862602-5.2542208626023
10118.8118.0392510965220.760748903478475
11116.5113.0144394255893.48556057441113
12125.1125.207122437768-0.107122437768481
13113.1113.0095303229670.0904696770330307
14119.6117.4420663581442.15793364185637
15114.4120.682876458172-6.28287645817183
16114113.5992589564920.40074104350817
17117.8116.3757303333941.42426966660554
18117115.1643380605551.83566193944535
19120.9119.7160938294181.18390617058195
20115118.227537471127-3.22753747112682
21117.3114.0377363430993.26226365690091
22119.4122.077808405588-2.67780840558763
23114.9115.620632274021-0.720632274021336
24125.8124.5489267535711.25107324642868
25117.6115.7978593186791.80214068132096
26117.6117.747169815461-0.147169815460565
27114.9120.485429220739-5.58542922073857
28121.9116.6605894963235.23941050367726
29117121.059242086410-4.0592420864103
30106.4111.909661827175-5.50966182717538
31110.5117.244765335077-6.74476533507725
32113.6113.832417391967-0.232417391966923
33114.2113.2907105407410.909289459258885
34125.4125.506831410408-0.106831410408123
35124.6122.2338878233482.36611217665222
36120.2120.979059221943-0.779059221943333
37120.8119.3249848375141.47501516248608
38111.4115.334922753339-3.93492275333866
39124.1117.4267045380046.67329546199609
40120.2120.484848620233-0.284848620232935
41125.5117.4884410666498.01155893335099
42116114.7102888231071.28971117689341
43117114.9783081498942.02169185010586
44105.7102.9975253343642.70247466563643
45102103.042269176072-1.04226917607191
46106.4104.3761090874832.02389091251728
4796.9102.031040477042-5.13104047704201
48107.6107.964891586717-0.364891586716859
4998.8101.286071914364-2.48607191436437
50101.1100.1960152946550.903984705345068
51105.7105.945800316635-0.245800316634972
52104.6108.131538232110-3.5315382321096
53103.2105.423458795346-2.22345879534613
54101.6100.9651034411570.634896558843497
55106.7104.6022424735612.09775752643891
5699.5100.105009981102-0.605009981102175
5710198.87506307748562.12493692251442

\begin{tabular}{lllllllll}
\hline
Multiple Linear Regression - Actuals, Interpolation, and Residuals \tabularnewline
Time or Index & Actuals & InterpolationForecast & ResidualsPrediction Error \tabularnewline
1 & 112.5 & 113.381553606476 & -0.881553606475701 \tabularnewline
2 & 113 & 111.979825778402 & 1.02017422159778 \tabularnewline
3 & 126.4 & 120.959189466451 & 5.44081053354928 \tabularnewline
4 & 114.1 & 115.923764694843 & -1.82376469484289 \tabularnewline
5 & 112.5 & 115.6531277182 & -3.15312771820009 \tabularnewline
6 & 112.4 & 110.650607848007 & 1.74939215199312 \tabularnewline
7 & 113.1 & 111.658590212049 & 1.44140978795053 \tabularnewline
8 & 116.3 & 114.937509821441 & 1.36249017855949 \tabularnewline
9 & 111.7 & 116.954220862602 & -5.2542208626023 \tabularnewline
10 & 118.8 & 118.039251096522 & 0.760748903478475 \tabularnewline
11 & 116.5 & 113.014439425589 & 3.48556057441113 \tabularnewline
12 & 125.1 & 125.207122437768 & -0.107122437768481 \tabularnewline
13 & 113.1 & 113.009530322967 & 0.0904696770330307 \tabularnewline
14 & 119.6 & 117.442066358144 & 2.15793364185637 \tabularnewline
15 & 114.4 & 120.682876458172 & -6.28287645817183 \tabularnewline
16 & 114 & 113.599258956492 & 0.40074104350817 \tabularnewline
17 & 117.8 & 116.375730333394 & 1.42426966660554 \tabularnewline
18 & 117 & 115.164338060555 & 1.83566193944535 \tabularnewline
19 & 120.9 & 119.716093829418 & 1.18390617058195 \tabularnewline
20 & 115 & 118.227537471127 & -3.22753747112682 \tabularnewline
21 & 117.3 & 114.037736343099 & 3.26226365690091 \tabularnewline
22 & 119.4 & 122.077808405588 & -2.67780840558763 \tabularnewline
23 & 114.9 & 115.620632274021 & -0.720632274021336 \tabularnewline
24 & 125.8 & 124.548926753571 & 1.25107324642868 \tabularnewline
25 & 117.6 & 115.797859318679 & 1.80214068132096 \tabularnewline
26 & 117.6 & 117.747169815461 & -0.147169815460565 \tabularnewline
27 & 114.9 & 120.485429220739 & -5.58542922073857 \tabularnewline
28 & 121.9 & 116.660589496323 & 5.23941050367726 \tabularnewline
29 & 117 & 121.059242086410 & -4.0592420864103 \tabularnewline
30 & 106.4 & 111.909661827175 & -5.50966182717538 \tabularnewline
31 & 110.5 & 117.244765335077 & -6.74476533507725 \tabularnewline
32 & 113.6 & 113.832417391967 & -0.232417391966923 \tabularnewline
33 & 114.2 & 113.290710540741 & 0.909289459258885 \tabularnewline
34 & 125.4 & 125.506831410408 & -0.106831410408123 \tabularnewline
35 & 124.6 & 122.233887823348 & 2.36611217665222 \tabularnewline
36 & 120.2 & 120.979059221943 & -0.779059221943333 \tabularnewline
37 & 120.8 & 119.324984837514 & 1.47501516248608 \tabularnewline
38 & 111.4 & 115.334922753339 & -3.93492275333866 \tabularnewline
39 & 124.1 & 117.426704538004 & 6.67329546199609 \tabularnewline
40 & 120.2 & 120.484848620233 & -0.284848620232935 \tabularnewline
41 & 125.5 & 117.488441066649 & 8.01155893335099 \tabularnewline
42 & 116 & 114.710288823107 & 1.28971117689341 \tabularnewline
43 & 117 & 114.978308149894 & 2.02169185010586 \tabularnewline
44 & 105.7 & 102.997525334364 & 2.70247466563643 \tabularnewline
45 & 102 & 103.042269176072 & -1.04226917607191 \tabularnewline
46 & 106.4 & 104.376109087483 & 2.02389091251728 \tabularnewline
47 & 96.9 & 102.031040477042 & -5.13104047704201 \tabularnewline
48 & 107.6 & 107.964891586717 & -0.364891586716859 \tabularnewline
49 & 98.8 & 101.286071914364 & -2.48607191436437 \tabularnewline
50 & 101.1 & 100.196015294655 & 0.903984705345068 \tabularnewline
51 & 105.7 & 105.945800316635 & -0.245800316634972 \tabularnewline
52 & 104.6 & 108.131538232110 & -3.5315382321096 \tabularnewline
53 & 103.2 & 105.423458795346 & -2.22345879534613 \tabularnewline
54 & 101.6 & 100.965103441157 & 0.634896558843497 \tabularnewline
55 & 106.7 & 104.602242473561 & 2.09775752643891 \tabularnewline
56 & 99.5 & 100.105009981102 & -0.605009981102175 \tabularnewline
57 & 101 & 98.8750630774856 & 2.12493692251442 \tabularnewline
\hline
\end{tabular}
%Source: https://freestatistics.org/blog/index.php?pk=111886&T=4

[TABLE]
[ROW][C]Multiple Linear Regression - Actuals, Interpolation, and Residuals[/C][/ROW]
[ROW][C]Time or Index[/C][C]Actuals[/C][C]InterpolationForecast[/C][C]ResidualsPrediction Error[/C][/ROW]
[ROW][C]1[/C][C]112.5[/C][C]113.381553606476[/C][C]-0.881553606475701[/C][/ROW]
[ROW][C]2[/C][C]113[/C][C]111.979825778402[/C][C]1.02017422159778[/C][/ROW]
[ROW][C]3[/C][C]126.4[/C][C]120.959189466451[/C][C]5.44081053354928[/C][/ROW]
[ROW][C]4[/C][C]114.1[/C][C]115.923764694843[/C][C]-1.82376469484289[/C][/ROW]
[ROW][C]5[/C][C]112.5[/C][C]115.6531277182[/C][C]-3.15312771820009[/C][/ROW]
[ROW][C]6[/C][C]112.4[/C][C]110.650607848007[/C][C]1.74939215199312[/C][/ROW]
[ROW][C]7[/C][C]113.1[/C][C]111.658590212049[/C][C]1.44140978795053[/C][/ROW]
[ROW][C]8[/C][C]116.3[/C][C]114.937509821441[/C][C]1.36249017855949[/C][/ROW]
[ROW][C]9[/C][C]111.7[/C][C]116.954220862602[/C][C]-5.2542208626023[/C][/ROW]
[ROW][C]10[/C][C]118.8[/C][C]118.039251096522[/C][C]0.760748903478475[/C][/ROW]
[ROW][C]11[/C][C]116.5[/C][C]113.014439425589[/C][C]3.48556057441113[/C][/ROW]
[ROW][C]12[/C][C]125.1[/C][C]125.207122437768[/C][C]-0.107122437768481[/C][/ROW]
[ROW][C]13[/C][C]113.1[/C][C]113.009530322967[/C][C]0.0904696770330307[/C][/ROW]
[ROW][C]14[/C][C]119.6[/C][C]117.442066358144[/C][C]2.15793364185637[/C][/ROW]
[ROW][C]15[/C][C]114.4[/C][C]120.682876458172[/C][C]-6.28287645817183[/C][/ROW]
[ROW][C]16[/C][C]114[/C][C]113.599258956492[/C][C]0.40074104350817[/C][/ROW]
[ROW][C]17[/C][C]117.8[/C][C]116.375730333394[/C][C]1.42426966660554[/C][/ROW]
[ROW][C]18[/C][C]117[/C][C]115.164338060555[/C][C]1.83566193944535[/C][/ROW]
[ROW][C]19[/C][C]120.9[/C][C]119.716093829418[/C][C]1.18390617058195[/C][/ROW]
[ROW][C]20[/C][C]115[/C][C]118.227537471127[/C][C]-3.22753747112682[/C][/ROW]
[ROW][C]21[/C][C]117.3[/C][C]114.037736343099[/C][C]3.26226365690091[/C][/ROW]
[ROW][C]22[/C][C]119.4[/C][C]122.077808405588[/C][C]-2.67780840558763[/C][/ROW]
[ROW][C]23[/C][C]114.9[/C][C]115.620632274021[/C][C]-0.720632274021336[/C][/ROW]
[ROW][C]24[/C][C]125.8[/C][C]124.548926753571[/C][C]1.25107324642868[/C][/ROW]
[ROW][C]25[/C][C]117.6[/C][C]115.797859318679[/C][C]1.80214068132096[/C][/ROW]
[ROW][C]26[/C][C]117.6[/C][C]117.747169815461[/C][C]-0.147169815460565[/C][/ROW]
[ROW][C]27[/C][C]114.9[/C][C]120.485429220739[/C][C]-5.58542922073857[/C][/ROW]
[ROW][C]28[/C][C]121.9[/C][C]116.660589496323[/C][C]5.23941050367726[/C][/ROW]
[ROW][C]29[/C][C]117[/C][C]121.059242086410[/C][C]-4.0592420864103[/C][/ROW]
[ROW][C]30[/C][C]106.4[/C][C]111.909661827175[/C][C]-5.50966182717538[/C][/ROW]
[ROW][C]31[/C][C]110.5[/C][C]117.244765335077[/C][C]-6.74476533507725[/C][/ROW]
[ROW][C]32[/C][C]113.6[/C][C]113.832417391967[/C][C]-0.232417391966923[/C][/ROW]
[ROW][C]33[/C][C]114.2[/C][C]113.290710540741[/C][C]0.909289459258885[/C][/ROW]
[ROW][C]34[/C][C]125.4[/C][C]125.506831410408[/C][C]-0.106831410408123[/C][/ROW]
[ROW][C]35[/C][C]124.6[/C][C]122.233887823348[/C][C]2.36611217665222[/C][/ROW]
[ROW][C]36[/C][C]120.2[/C][C]120.979059221943[/C][C]-0.779059221943333[/C][/ROW]
[ROW][C]37[/C][C]120.8[/C][C]119.324984837514[/C][C]1.47501516248608[/C][/ROW]
[ROW][C]38[/C][C]111.4[/C][C]115.334922753339[/C][C]-3.93492275333866[/C][/ROW]
[ROW][C]39[/C][C]124.1[/C][C]117.426704538004[/C][C]6.67329546199609[/C][/ROW]
[ROW][C]40[/C][C]120.2[/C][C]120.484848620233[/C][C]-0.284848620232935[/C][/ROW]
[ROW][C]41[/C][C]125.5[/C][C]117.488441066649[/C][C]8.01155893335099[/C][/ROW]
[ROW][C]42[/C][C]116[/C][C]114.710288823107[/C][C]1.28971117689341[/C][/ROW]
[ROW][C]43[/C][C]117[/C][C]114.978308149894[/C][C]2.02169185010586[/C][/ROW]
[ROW][C]44[/C][C]105.7[/C][C]102.997525334364[/C][C]2.70247466563643[/C][/ROW]
[ROW][C]45[/C][C]102[/C][C]103.042269176072[/C][C]-1.04226917607191[/C][/ROW]
[ROW][C]46[/C][C]106.4[/C][C]104.376109087483[/C][C]2.02389091251728[/C][/ROW]
[ROW][C]47[/C][C]96.9[/C][C]102.031040477042[/C][C]-5.13104047704201[/C][/ROW]
[ROW][C]48[/C][C]107.6[/C][C]107.964891586717[/C][C]-0.364891586716859[/C][/ROW]
[ROW][C]49[/C][C]98.8[/C][C]101.286071914364[/C][C]-2.48607191436437[/C][/ROW]
[ROW][C]50[/C][C]101.1[/C][C]100.196015294655[/C][C]0.903984705345068[/C][/ROW]
[ROW][C]51[/C][C]105.7[/C][C]105.945800316635[/C][C]-0.245800316634972[/C][/ROW]
[ROW][C]52[/C][C]104.6[/C][C]108.131538232110[/C][C]-3.5315382321096[/C][/ROW]
[ROW][C]53[/C][C]103.2[/C][C]105.423458795346[/C][C]-2.22345879534613[/C][/ROW]
[ROW][C]54[/C][C]101.6[/C][C]100.965103441157[/C][C]0.634896558843497[/C][/ROW]
[ROW][C]55[/C][C]106.7[/C][C]104.602242473561[/C][C]2.09775752643891[/C][/ROW]
[ROW][C]56[/C][C]99.5[/C][C]100.105009981102[/C][C]-0.605009981102175[/C][/ROW]
[ROW][C]57[/C][C]101[/C][C]98.8750630774856[/C][C]2.12493692251442[/C][/ROW]
[/TABLE]
Source: https://freestatistics.org/blog/index.php?pk=111886&T=4

Globally Unique Identifier (entire table): ba.freestatistics.org/blog/index.php?pk=111886&T=4

As an alternative you can also use a QR Code:  

The GUIDs for individual cells are displayed in the table below:

Multiple Linear Regression - Actuals, Interpolation, and Residuals
Time or IndexActualsInterpolationForecastResidualsPrediction Error
1112.5113.381553606476-0.881553606475701
2113111.9798257784021.02017422159778
3126.4120.9591894664515.44081053354928
4114.1115.923764694843-1.82376469484289
5112.5115.6531277182-3.15312771820009
6112.4110.6506078480071.74939215199312
7113.1111.6585902120491.44140978795053
8116.3114.9375098214411.36249017855949
9111.7116.954220862602-5.2542208626023
10118.8118.0392510965220.760748903478475
11116.5113.0144394255893.48556057441113
12125.1125.207122437768-0.107122437768481
13113.1113.0095303229670.0904696770330307
14119.6117.4420663581442.15793364185637
15114.4120.682876458172-6.28287645817183
16114113.5992589564920.40074104350817
17117.8116.3757303333941.42426966660554
18117115.1643380605551.83566193944535
19120.9119.7160938294181.18390617058195
20115118.227537471127-3.22753747112682
21117.3114.0377363430993.26226365690091
22119.4122.077808405588-2.67780840558763
23114.9115.620632274021-0.720632274021336
24125.8124.5489267535711.25107324642868
25117.6115.7978593186791.80214068132096
26117.6117.747169815461-0.147169815460565
27114.9120.485429220739-5.58542922073857
28121.9116.6605894963235.23941050367726
29117121.059242086410-4.0592420864103
30106.4111.909661827175-5.50966182717538
31110.5117.244765335077-6.74476533507725
32113.6113.832417391967-0.232417391966923
33114.2113.2907105407410.909289459258885
34125.4125.506831410408-0.106831410408123
35124.6122.2338878233482.36611217665222
36120.2120.979059221943-0.779059221943333
37120.8119.3249848375141.47501516248608
38111.4115.334922753339-3.93492275333866
39124.1117.4267045380046.67329546199609
40120.2120.484848620233-0.284848620232935
41125.5117.4884410666498.01155893335099
42116114.7102888231071.28971117689341
43117114.9783081498942.02169185010586
44105.7102.9975253343642.70247466563643
45102103.042269176072-1.04226917607191
46106.4104.3761090874832.02389091251728
4796.9102.031040477042-5.13104047704201
48107.6107.964891586717-0.364891586716859
4998.8101.286071914364-2.48607191436437
50101.1100.1960152946550.903984705345068
51105.7105.945800316635-0.245800316634972
52104.6108.131538232110-3.5315382321096
53103.2105.423458795346-2.22345879534613
54101.6100.9651034411570.634896558843497
55106.7104.6022424735612.09775752643891
5699.5100.105009981102-0.605009981102175
5710198.87506307748562.12493692251442


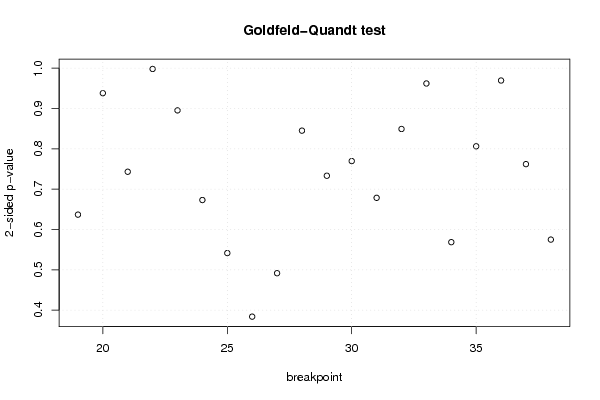
Goldfeld-Quandt test for Heteroskedasticity
p-valuesAlternative Hypothesis
breakpoint indexgreater2-sidedless
190.6816132087120210.6367735825759580.318386791287979
200.5310042878508660.9379914242982680.468995712149134
210.6284291597652470.7431416804695070.371570840234753
220.4990385844221850.998077168844370.500961415577815
230.447666255007480.895332510014960.55233374499252
240.3365006136590020.6730012273180040.663499386340998
250.27071391460650.5414278292130.7292860853935
260.1918915978727080.3837831957454150.808108402127293
270.2457544180302070.4915088360604130.754245581969793
280.422530022808630.845060045617260.57746997719137
290.3666107884563090.7332215769126180.633389211543691
300.38479177421070.76958354842140.6152082257893
310.6607694539564950.6784610920870090.339230546043505
320.5754092178729040.8491815642541920.424590782127096
330.4810182042250570.9620364084501140.518981795774943
340.7157539490594220.5684921018811560.284246050940578
350.5968694110930250.8062611778139510.403130588906975
360.515315625563610.969368748872780.48468437443639
370.38103557304720.76207114609440.6189644269528
380.2874165261213090.5748330522426180.71258347387869

\begin{tabular}{lllllllll}
\hline
Goldfeld-Quandt test for Heteroskedasticity \tabularnewline
p-values & Alternative Hypothesis \tabularnewline
breakpoint index & greater & 2-sided & less \tabularnewline
19 & 0.681613208712021 & 0.636773582575958 & 0.318386791287979 \tabularnewline
20 & 0.531004287850866 & 0.937991424298268 & 0.468995712149134 \tabularnewline
21 & 0.628429159765247 & 0.743141680469507 & 0.371570840234753 \tabularnewline
22 & 0.499038584422185 & 0.99807716884437 & 0.500961415577815 \tabularnewline
23 & 0.44766625500748 & 0.89533251001496 & 0.55233374499252 \tabularnewline
24 & 0.336500613659002 & 0.673001227318004 & 0.663499386340998 \tabularnewline
25 & 0.2707139146065 & 0.541427829213 & 0.7292860853935 \tabularnewline
26 & 0.191891597872708 & 0.383783195745415 & 0.808108402127293 \tabularnewline
27 & 0.245754418030207 & 0.491508836060413 & 0.754245581969793 \tabularnewline
28 & 0.42253002280863 & 0.84506004561726 & 0.57746997719137 \tabularnewline
29 & 0.366610788456309 & 0.733221576912618 & 0.633389211543691 \tabularnewline
30 & 0.3847917742107 & 0.7695835484214 & 0.6152082257893 \tabularnewline
31 & 0.660769453956495 & 0.678461092087009 & 0.339230546043505 \tabularnewline
32 & 0.575409217872904 & 0.849181564254192 & 0.424590782127096 \tabularnewline
33 & 0.481018204225057 & 0.962036408450114 & 0.518981795774943 \tabularnewline
34 & 0.715753949059422 & 0.568492101881156 & 0.284246050940578 \tabularnewline
35 & 0.596869411093025 & 0.806261177813951 & 0.403130588906975 \tabularnewline
36 & 0.51531562556361 & 0.96936874887278 & 0.48468437443639 \tabularnewline
37 & 0.3810355730472 & 0.7620711460944 & 0.6189644269528 \tabularnewline
38 & 0.287416526121309 & 0.574833052242618 & 0.71258347387869 \tabularnewline
\hline
\end{tabular}
%Source: https://freestatistics.org/blog/index.php?pk=111886&T=5

[TABLE]
[ROW][C]Goldfeld-Quandt test for Heteroskedasticity[/C][/ROW]
[ROW][C]p-values[/C][C]Alternative Hypothesis[/C][/ROW]
[ROW][C]breakpoint index[/C][C]greater[/C][C]2-sided[/C][C]less[/C][/ROW]
[ROW][C]19[/C][C]0.681613208712021[/C][C]0.636773582575958[/C][C]0.318386791287979[/C][/ROW]
[ROW][C]20[/C][C]0.531004287850866[/C][C]0.937991424298268[/C][C]0.468995712149134[/C][/ROW]
[ROW][C]21[/C][C]0.628429159765247[/C][C]0.743141680469507[/C][C]0.371570840234753[/C][/ROW]
[ROW][C]22[/C][C]0.499038584422185[/C][C]0.99807716884437[/C][C]0.500961415577815[/C][/ROW]
[ROW][C]23[/C][C]0.44766625500748[/C][C]0.89533251001496[/C][C]0.55233374499252[/C][/ROW]
[ROW][C]24[/C][C]0.336500613659002[/C][C]0.673001227318004[/C][C]0.663499386340998[/C][/ROW]
[ROW][C]25[/C][C]0.2707139146065[/C][C]0.541427829213[/C][C]0.7292860853935[/C][/ROW]
[ROW][C]26[/C][C]0.191891597872708[/C][C]0.383783195745415[/C][C]0.808108402127293[/C][/ROW]
[ROW][C]27[/C][C]0.245754418030207[/C][C]0.491508836060413[/C][C]0.754245581969793[/C][/ROW]
[ROW][C]28[/C][C]0.42253002280863[/C][C]0.84506004561726[/C][C]0.57746997719137[/C][/ROW]
[ROW][C]29[/C][C]0.366610788456309[/C][C]0.733221576912618[/C][C]0.633389211543691[/C][/ROW]
[ROW][C]30[/C][C]0.3847917742107[/C][C]0.7695835484214[/C][C]0.6152082257893[/C][/ROW]
[ROW][C]31[/C][C]0.660769453956495[/C][C]0.678461092087009[/C][C]0.339230546043505[/C][/ROW]
[ROW][C]32[/C][C]0.575409217872904[/C][C]0.849181564254192[/C][C]0.424590782127096[/C][/ROW]
[ROW][C]33[/C][C]0.481018204225057[/C][C]0.962036408450114[/C][C]0.518981795774943[/C][/ROW]
[ROW][C]34[/C][C]0.715753949059422[/C][C]0.568492101881156[/C][C]0.284246050940578[/C][/ROW]
[ROW][C]35[/C][C]0.596869411093025[/C][C]0.806261177813951[/C][C]0.403130588906975[/C][/ROW]
[ROW][C]36[/C][C]0.51531562556361[/C][C]0.96936874887278[/C][C]0.48468437443639[/C][/ROW]
[ROW][C]37[/C][C]0.3810355730472[/C][C]0.7620711460944[/C][C]0.6189644269528[/C][/ROW]
[ROW][C]38[/C][C]0.287416526121309[/C][C]0.574833052242618[/C][C]0.71258347387869[/C][/ROW]
[/TABLE]
Source: https://freestatistics.org/blog/index.php?pk=111886&T=5

Globally Unique Identifier (entire table): ba.freestatistics.org/blog/index.php?pk=111886&T=5

As an alternative you can also use a QR Code:  

The GUIDs for individual cells are displayed in the table below:

Goldfeld-Quandt test for Heteroskedasticity
p-valuesAlternative Hypothesis
breakpoint indexgreater2-sidedless
190.6816132087120210.6367735825759580.318386791287979
200.5310042878508660.9379914242982680.468995712149134
210.6284291597652470.7431416804695070.371570840234753
220.4990385844221850.998077168844370.500961415577815
230.447666255007480.895332510014960.55233374499252
240.3365006136590020.6730012273180040.663499386340998
250.27071391460650.5414278292130.7292860853935
260.1918915978727080.3837831957454150.808108402127293
270.2457544180302070.4915088360604130.754245581969793
280.422530022808630.845060045617260.57746997719137
290.3666107884563090.7332215769126180.633389211543691
300.38479177421070.76958354842140.6152082257893
310.6607694539564950.6784610920870090.339230546043505
320.5754092178729040.8491815642541920.424590782127096
330.4810182042250570.9620364084501140.518981795774943
340.7157539490594220.5684921018811560.284246050940578
350.5968694110930250.8062611778139510.403130588906975
360.515315625563610.969368748872780.48468437443639
370.38103557304720.76207114609440.6189644269528
380.2874165261213090.5748330522426180.71258347387869


Meta Analysis of Goldfeld-Quandt test for Heteroskedasticity
Description# significant tests% significant testsOK/NOK
1% type I error level00OK
5% type I error level00OK
10% type I error level00OK

\begin{tabular}{lllllllll}
\hline
Meta Analysis of Goldfeld-Quandt test for Heteroskedasticity \tabularnewline
Description & # significant tests & % significant tests & OK/NOK \tabularnewline
1% type I error level & 0 & 0 & OK \tabularnewline
5% type I error level & 0 & 0 & OK \tabularnewline
10% type I error level & 0 & 0 & OK \tabularnewline
\hline
\end{tabular}
%Source: https://freestatistics.org/blog/index.php?pk=111886&T=6

[TABLE]
[ROW][C]Meta Analysis of Goldfeld-Quandt test for Heteroskedasticity[/C][/ROW]
[ROW][C]Description[/C][C]# significant tests[/C][C]% significant tests[/C][C]OK/NOK[/C][/ROW]
[ROW][C]1% type I error level[/C][C]0[/C][C]0[/C][C]OK[/C][/ROW]
[ROW][C]5% type I error level[/C][C]0[/C][C]0[/C][C]OK[/C][/ROW]
[ROW][C]10% type I error level[/C][C]0[/C][C]0[/C][C]OK[/C][/ROW]
[/TABLE]
Source: https://freestatistics.org/blog/index.php?pk=111886&T=6

Globally Unique Identifier (entire table): ba.freestatistics.org/blog/index.php?pk=111886&T=6

As an alternative you can also use a QR Code:  

The GUIDs for individual cells are displayed in the table below:

Meta Analysis of Goldfeld-Quandt test for Heteroskedasticity
Description# significant tests% significant testsOK/NOK
1% type I error level00OK
5% type I error level00OK
10% type I error level00OK


Parameters (Session):
par1 = 2 ; par2 = Include Monthly Dummies ; par3 = Linear Trend ;
Parameters (R input):
par1 = 2 ; par2 = Include Monthly Dummies ; par3 = Linear Trend ;
R code (references can be found in the software module):
library(lattice)
library(lmtest)
n25 <- 25 #minimum number of obs. for Goldfeld-Quandt test
par1 <- as.numeric(par1)
x <- t(y)
k <- length(x[1,])
n <- length(x[,1])
x1 <- cbind(x[,par1], x[,1:k!=par1])
mycolnames <- c(colnames(x)[par1], colnames(x)[1:k!=par1])
colnames(x1) <- mycolnames #colnames(x)[par1]
x <- x1
if (par3 == 'First Differences'){
x2 <- array(0, dim=c(n-1,k), dimnames=list(1:(n-1), paste('(1-B)',colnames(x),sep='')))
for (i in 1:n-1) {
for (j in 1:k) {
x2[i,j] <- x[i+1,j] - x[i,j]
}
}
x <- x2
}
if (par2 == 'Include Monthly Dummies'){
x2 <- array(0, dim=c(n,11), dimnames=list(1:n, paste('M', seq(1:11), sep ='')))
for (i in 1:11){
x2[seq(i,n,12),i] <- 1
}
x <- cbind(x, x2)
}
if (par2 == 'Include Quarterly Dummies'){
x2 <- array(0, dim=c(n,3), dimnames=list(1:n, paste('Q', seq(1:3), sep ='')))
for (i in 1:3){
x2[seq(i,n,4),i] <- 1
}
x <- cbind(x, x2)
}
k <- length(x[1,])
if (par3 == 'Linear Trend'){
x <- cbind(x, c(1:n))
colnames(x)[k+1] <- 't'
}
x
k <- length(x[1,])
df <- as.data.frame(x)
(mylm <- lm(df))
(mysum <- summary(mylm))
if (n > n25) {
kp3 <- k + 3
nmkm3 <- n - k - 3
gqarr <- array(NA, dim=c(nmkm3-kp3+1,3))
numgqtests <- 0
numsignificant1 <- 0
numsignificant5 <- 0
numsignificant10 <- 0
for (mypoint in kp3:nmkm3) {
j <- 0
numgqtests <- numgqtests + 1
for (myalt in c('greater', 'two.sided', 'less')) {
j <- j + 1
gqarr[mypoint-kp3+1,j] <- gqtest(mylm, point=mypoint, alternative=myalt)$p.value
}
if (gqarr[mypoint-kp3+1,2] < 0.01) numsignificant1 <- numsignificant1 + 1
if (gqarr[mypoint-kp3+1,2] < 0.05) numsignificant5 <- numsignificant5 + 1
if (gqarr[mypoint-kp3+1,2] < 0.10) numsignificant10 <- numsignificant10 + 1
}
gqarr
}
bitmap(file='test0.png')
plot(x[,1], type='l', main='Actuals and Interpolation', ylab='value of Actuals and Interpolation (dots)', xlab='time or index')
points(x[,1]-mysum$resid)
grid()
dev.off()
bitmap(file='test1.png')
plot(mysum$resid, type='b', pch=19, main='Residuals', ylab='value of Residuals', xlab='time or index')
grid()
dev.off()
bitmap(file='test2.png')
hist(mysum$resid, main='Residual Histogram', xlab='values of Residuals')
grid()
dev.off()
bitmap(file='test3.png')
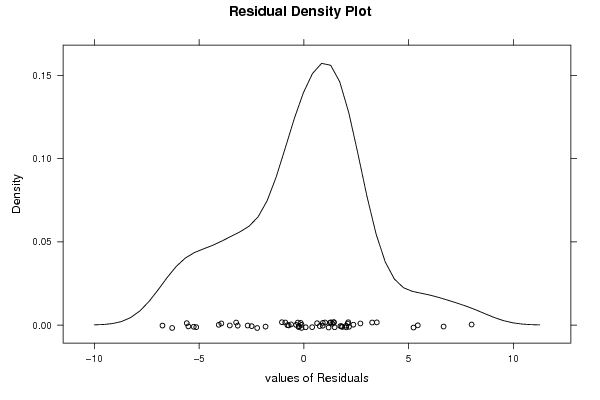
densityplot(~mysum$resid,col='black',main='Residual Density Plot', xlab='values of Residuals')
dev.off()
bitmap(file='test4.png')
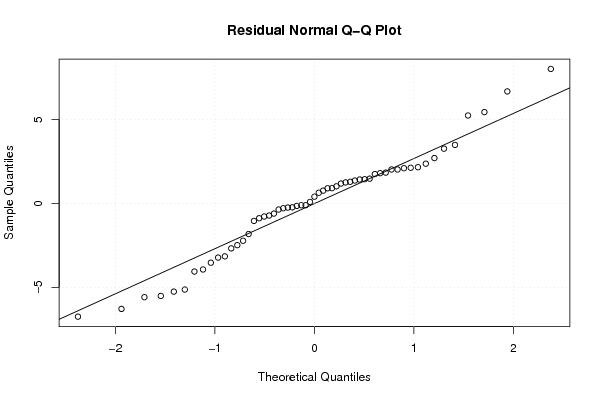
qqnorm(mysum$resid, main='Residual Normal Q-Q Plot')
qqline(mysum$resid)
grid()
dev.off()
(myerror <- as.ts(mysum$resid))
bitmap(file='test5.png')
dum <- cbind(lag(myerror,k=1),myerror)
dum
dum1 <- dum[2:length(myerror),]
dum1
z <- as.data.frame(dum1)
z
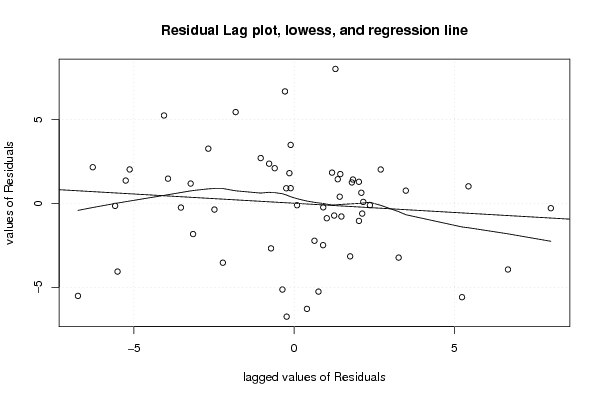
plot(z,main=paste('Residual Lag plot, lowess, and regression line'), ylab='values of Residuals', xlab='lagged values of Residuals')
lines(lowess(z))
abline(lm(z))
grid()
dev.off()
bitmap(file='test6.png')
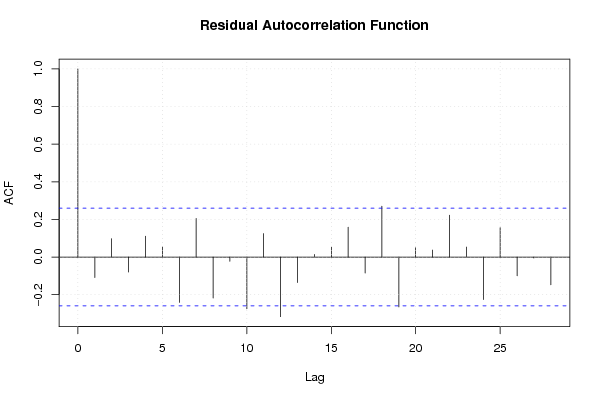
acf(mysum$resid, lag.max=length(mysum$resid)/2, main='Residual Autocorrelation Function')
grid()
dev.off()
bitmap(file='test7.png')
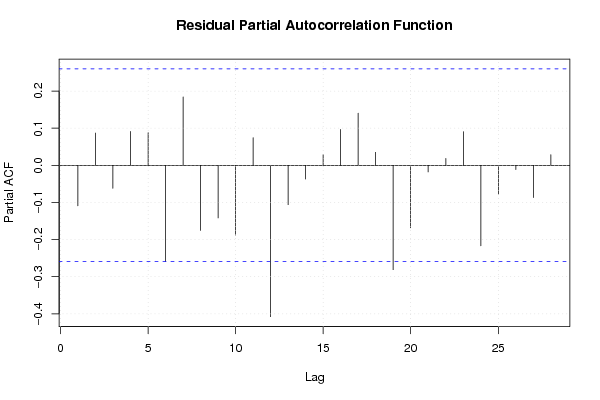
pacf(mysum$resid, lag.max=length(mysum$resid)/2, main='Residual Partial Autocorrelation Function')
grid()
dev.off()
bitmap(file='test8.png')
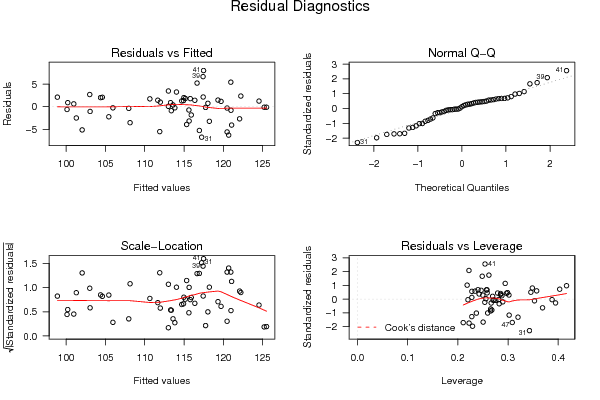
opar <- par(mfrow = c(2,2), oma = c(0, 0, 1.1, 0))
plot(mylm, las = 1, sub='Residual Diagnostics')
par(opar)
dev.off()
if (n > n25) {
bitmap(file='test9.png')
plot(kp3:nmkm3,gqarr[,2], main='Goldfeld-Quandt test',ylab='2-sided p-value',xlab='breakpoint')
grid()
dev.off()
}
load(file='createtable')
a<-table.start()
a<-table.row.start(a)
a<-table.element(a, 'Multiple Linear Regression - Estimated Regression Equation', 1, TRUE)
a<-table.row.end(a)
myeq <- colnames(x)[1]
myeq <- paste(myeq, '[t] = ', sep='')
for (i in 1:k){
if (mysum$coefficients[i,1] > 0) myeq <- paste(myeq, '+', '')
myeq <- paste(myeq, mysum$coefficients[i,1], sep=' ')
if (rownames(mysum$coefficients)[i] != '(Intercept)') {
myeq <- paste(myeq, rownames(mysum$coefficients)[i], sep='')
if (rownames(mysum$coefficients)[i] != 't') myeq <- paste(myeq, '[t]', sep='')
}
}
myeq <- paste(myeq, ' + e[t]')
a<-table.row.start(a)
a<-table.element(a, myeq)
a<-table.row.end(a)
a<-table.end(a)
table.save(a,file='mytable1.tab')
a<-table.start()
a<-table.row.start(a)
a<-table.element(a,hyperlink('ols1.htm','Multiple Linear Regression - Ordinary Least Squares',''), 6, TRUE)
a<-table.row.end(a)
a<-table.row.start(a)
a<-table.element(a,'Variable',header=TRUE)
a<-table.element(a,'Parameter',header=TRUE)
a<-table.element(a,'S.D.',header=TRUE)
a<-table.element(a,'T-STAT
H0: parameter = 0',header=TRUE)
a<-table.element(a,'2-tail p-value',header=TRUE)
a<-table.element(a,'1-tail p-value',header=TRUE)
a<-table.row.end(a)
for (i in 1:k){
a<-table.row.start(a)
a<-table.element(a,rownames(mysum$coefficients)[i],header=TRUE)
a<-table.element(a,mysum$coefficients[i,1])
a<-table.element(a, round(mysum$coefficients[i,2],6))
a<-table.element(a, round(mysum$coefficients[i,3],4))
a<-table.element(a, round(mysum$coefficients[i,4],6))
a<-table.element(a, round(mysum$coefficients[i,4]/2,6))
a<-table.row.end(a)
}
a<-table.end(a)
table.save(a,file='mytable2.tab')
a<-table.start()
a<-table.row.start(a)
a<-table.element(a, 'Multiple Linear Regression - Regression Statistics', 2, TRUE)
a<-table.row.end(a)
a<-table.row.start(a)
a<-table.element(a, 'Multiple R',1,TRUE)
a<-table.element(a, sqrt(mysum$r.squared))
a<-table.row.end(a)
a<-table.row.start(a)
a<-table.element(a, 'R-squared',1,TRUE)
a<-table.element(a, mysum$r.squared)
a<-table.row.end(a)
a<-table.row.start(a)
a<-table.element(a, 'Adjusted R-squared',1,TRUE)
a<-table.element(a, mysum$adj.r.squared)
a<-table.row.end(a)
a<-table.row.start(a)
a<-table.element(a, 'F-TEST (value)',1,TRUE)
a<-table.element(a, mysum$fstatistic[1])
a<-table.row.end(a)
a<-table.row.start(a)
a<-table.element(a, 'F-TEST (DF numerator)',1,TRUE)
a<-table.element(a, mysum$fstatistic[2])
a<-table.row.end(a)
a<-table.row.start(a)
a<-table.element(a, 'F-TEST (DF denominator)',1,TRUE)
a<-table.element(a, mysum$fstatistic[3])
a<-table.row.end(a)
a<-table.row.start(a)
a<-table.element(a, 'p-value',1,TRUE)
a<-table.element(a, 1-pf(mysum$fstatistic[1],mysum$fstatistic[2],mysum$fstatistic[3]))
a<-table.row.end(a)
a<-table.row.start(a)
a<-table.element(a, 'Multiple Linear Regression - Residual Statistics', 2, TRUE)
a<-table.row.end(a)
a<-table.row.start(a)
a<-table.element(a, 'Residual Standard Deviation',1,TRUE)
a<-table.element(a, mysum$sigma)
a<-table.row.end(a)
a<-table.row.start(a)
a<-table.element(a, 'Sum Squared Residuals',1,TRUE)
a<-table.element(a, sum(myerror*myerror))
a<-table.row.end(a)
a<-table.end(a)
table.save(a,file='mytable3.tab')
a<-table.start()
a<-table.row.start(a)
a<-table.element(a, 'Multiple Linear Regression - Actuals, Interpolation, and Residuals', 4, TRUE)
a<-table.row.end(a)
a<-table.row.start(a)
a<-table.element(a, 'Time or Index', 1, TRUE)
a<-table.element(a, 'Actuals', 1, TRUE)
a<-table.element(a, 'Interpolation
Forecast', 1, TRUE)
a<-table.element(a, 'Residuals
Prediction Error', 1, TRUE)
a<-table.row.end(a)
for (i in 1:n) {
a<-table.row.start(a)
a<-table.element(a,i, 1, TRUE)
a<-table.element(a,x[i])
a<-table.element(a,x[i]-mysum$resid[i])
a<-table.element(a,mysum$resid[i])
a<-table.row.end(a)
}
a<-table.end(a)
table.save(a,file='mytable4.tab')
if (n > n25) {
a<-table.start()
a<-table.row.start(a)
a<-table.element(a,'Goldfeld-Quandt test for Heteroskedasticity',4,TRUE)
a<-table.row.end(a)
a<-table.row.start(a)
a<-table.element(a,'p-values',header=TRUE)
a<-table.element(a,'Alternative Hypothesis',3,header=TRUE)
a<-table.row.end(a)
a<-table.row.start(a)
a<-table.element(a,'breakpoint index',header=TRUE)
a<-table.element(a,'greater',header=TRUE)
a<-table.element(a,'2-sided',header=TRUE)
a<-table.element(a,'less',header=TRUE)
a<-table.row.end(a)
for (mypoint in kp3:nmkm3) {
a<-table.row.start(a)
a<-table.element(a,mypoint,header=TRUE)
a<-table.element(a,gqarr[mypoint-kp3+1,1])
a<-table.element(a,gqarr[mypoint-kp3+1,2])
a<-table.element(a,gqarr[mypoint-kp3+1,3])
a<-table.row.end(a)
}
a<-table.end(a)
table.save(a,file='mytable5.tab')
a<-table.start()
a<-table.row.start(a)
a<-table.element(a,'Meta Analysis of Goldfeld-Quandt test for Heteroskedasticity',4,TRUE)
a<-table.row.end(a)
a<-table.row.start(a)
a<-table.element(a,'Description',header=TRUE)
a<-table.element(a,'# significant tests',header=TRUE)
a<-table.element(a,'% significant tests',header=TRUE)
a<-table.element(a,'OK/NOK',header=TRUE)
a<-table.row.end(a)
a<-table.row.start(a)
a<-table.element(a,'1% type I error level',header=TRUE)
a<-table.element(a,numsignificant1)
a<-table.element(a,numsignificant1/numgqtests)
if (numsignificant1/numgqtests < 0.01) dum <- 'OK' else dum <- 'NOK'
a<-table.element(a,dum)
a<-table.row.end(a)
a<-table.row.start(a)
a<-table.element(a,'5% type I error level',header=TRUE)
a<-table.element(a,numsignificant5)
a<-table.element(a,numsignificant5/numgqtests)
if (numsignificant5/numgqtests < 0.05) dum <- 'OK' else dum <- 'NOK'
a<-table.element(a,dum)
a<-table.row.end(a)
a<-table.row.start(a)
a<-table.element(a,'10% type I error level',header=TRUE)
a<-table.element(a,numsignificant10)
a<-table.element(a,numsignificant10/numgqtests)
if (numsignificant10/numgqtests < 0.1) dum <- 'OK' else dum <- 'NOK'
a<-table.element(a,dum)
a<-table.row.end(a)
a<-table.end(a)
table.save(a,file='mytable6.tab')
}