Free Statistics

of Irreproducible Research!

Author's title

Author*The author of this computation has been verified*
R Software Modulerwasp_arimabackwardselection.wasp
Title produced by softwareARIMA Backward Selection
Date of computationFri, 17 Dec 2010 21:10:50 +0000
Cite this page as followsStatistical Computations at FreeStatistics.org, Office for Research Development and Education, URL https://freestatistics.org/blog/index.php?v=date/2010/Dec/17/t1292620160y213xm5cinzahsh.htm/, Retrieved Fri, 03 May 2024 23:03:29 +0000
Statistical Computations at FreeStatistics.org, Office for Research Development and Education, URL https://freestatistics.org/blog/index.php?pk=111736, Retrieved Fri, 03 May 2024 23:03:29 +0000
QR Codes:

Original text written by user:
IsPrivate?No (this computation is public)
User-defined keywords
Estimated Impact236
Family? (F = Feedback message, R = changed R code, M = changed R Module, P = changed Parameters, D = changed Data)
-     [Univariate Data Series] [Bouwvergunningen] [2009-11-02 16:57:06] [11ac052cc87d77b9933b02bea117068e]
-   P   [Univariate Data Series] [Bouwvergunningen ...] [2009-11-11 14:29:30] [11ac052cc87d77b9933b02bea117068e]
- RMPD    [Variance Reduction Matrix] [Workshop 6] [2010-12-16 20:00:53] [29e492448d11757ae0fad5ef6e7f8e86]
- RMPD        [ARIMA Backward Selection] [] [2010-12-17 21:10:50] [0956ee981dded61b2e7128dae94e5715] [Current]
Feedback Forum

Post a new message
Dataseries X:
2617.2
2506.13
2679.07
2589.73
2457.46
2517.3
2386.53
2453.37
2529.66
2475.14
2525.93
2480.93
2229.85
2169.14
2030.98
2071.37
1953.35
1748.74
1696.58
1900.09
1908.64
1881.46
2100.18
2672.2
3136
2994.38
3168.22
3751.41
3925.43
3719.52
3757.12
3722.23
4127.47
4162.5
4441.82
4325.29
4350.83
4384.47
4639.4
4697.86
4614.76
4471.65
4305.23
4433.57
4388.53
4140.3
4144.38
4070.78
3906.01
3795.91
3703.32
3675.8
3911.06
3912.28
3839.25
3744.63
3549.25
3394.14
3264.26
3328.8
3223.98
3228.01
3112.83
3051.67
3039.71
3125.67
3106.54


Summary of computational transaction
Raw Inputview raw input (R code)
Raw Outputview raw output of R engine
Computing time18 seconds
R Server'Gwilym Jenkins' @ 72.249.127.135

\begin{tabular}{lllllllll}
\hline
Summary of computational transaction \tabularnewline
Raw Input & view raw input (R code)  \tabularnewline
Raw Output & view raw output of R engine  \tabularnewline
Computing time & 18 seconds \tabularnewline
R Server & 'Gwilym Jenkins' @ 72.249.127.135 \tabularnewline
\hline
\end{tabular}
%Source: https://freestatistics.org/blog/index.php?pk=111736&T=0

[TABLE]
[ROW][C]Summary of computational transaction[/C][/ROW]
[ROW][C]Raw Input[/C][C]view raw input (R code) [/C][/ROW]
[ROW][C]Raw Output[/C][C]view raw output of R engine [/C][/ROW]
[ROW][C]Computing time[/C][C]18 seconds[/C][/ROW]
[ROW][C]R Server[/C][C]'Gwilym Jenkins' @ 72.249.127.135[/C][/ROW]
[/TABLE]
Source: https://freestatistics.org/blog/index.php?pk=111736&T=0

Globally Unique Identifier (entire table): ba.freestatistics.org/blog/index.php?pk=111736&T=0

As an alternative you can also use a QR Code:  

The GUIDs for individual cells are displayed in the table below:

Summary of computational transaction
Raw Inputview raw input (R code)
Raw Outputview raw output of R engine
Computing time18 seconds
R Server'Gwilym Jenkins' @ 72.249.127.135


ARIMA Parameter Estimation and Backward Selection
Iterationar1ar2ar3ma1sar1sar2sma1
Estimates ( 1 )0.8642-0.29190.2356-0.542-0.2528-0.3717-0.9999
(p-val)(0.0036 )(0.1533 )(0.1215 )(0.0467 )(0.1507 )(0.0541 )(0.048 )
Estimates ( 2 )0.597900.1151-0.372-0.2352-0.2839-0.9995
(p-val)(0.1549 )(NA )(0.3914 )(0.4921 )(0.2016 )(0.1415 )(0.0391 )
Estimates ( 3 )0.315700.11590-0.2504-0.3214-1.0001
(p-val)(0.0164 )(NA )(0.3815 )(NA )(0.1582 )(0.0769 )(0.0358 )
Estimates ( 4 )0.3226000-0.2214-0.3164-0.9988
(p-val)(0.0152 )(NA )(NA )(NA )(0.1941 )(0.0803 )(0.0296 )
Estimates ( 5 )0.30270000-0.1859-1
(p-val)(0.0218 )(NA )(NA )(NA )(NA )(0.2784 )(3e-04 )
Estimates ( 6 )0.312100000-0.9996
(p-val)(0.0174 )(NA )(NA )(NA )(NA )(NA )(1e-04 )
Estimates ( 7 )NANANANANANANA
(p-val)(NA )(NA )(NA )(NA )(NA )(NA )(NA )
Estimates ( 8 )NANANANANANANA
(p-val)(NA )(NA )(NA )(NA )(NA )(NA )(NA )
Estimates ( 9 )NANANANANANANA
(p-val)(NA )(NA )(NA )(NA )(NA )(NA )(NA )
Estimates ( 10 )NANANANANANANA
(p-val)(NA )(NA )(NA )(NA )(NA )(NA )(NA )
Estimates ( 11 )NANANANANANANA
(p-val)(NA )(NA )(NA )(NA )(NA )(NA )(NA )
Estimates ( 12 )NANANANANANANA
(p-val)(NA )(NA )(NA )(NA )(NA )(NA )(NA )
Estimates ( 13 )NANANANANANANA
(p-val)(NA )(NA )(NA )(NA )(NA )(NA )(NA )

\begin{tabular}{lllllllll}
\hline
ARIMA Parameter Estimation and Backward Selection \tabularnewline
Iteration & ar1 & ar2 & ar3 & ma1 & sar1 & sar2 & sma1 \tabularnewline
Estimates ( 1 ) & 0.8642 & -0.2919 & 0.2356 & -0.542 & -0.2528 & -0.3717 & -0.9999 \tabularnewline
(p-val) & (0.0036 ) & (0.1533 ) & (0.1215 ) & (0.0467 ) & (0.1507 ) & (0.0541 ) & (0.048 ) \tabularnewline
Estimates ( 2 ) & 0.5979 & 0 & 0.1151 & -0.372 & -0.2352 & -0.2839 & -0.9995 \tabularnewline
(p-val) & (0.1549 ) & (NA ) & (0.3914 ) & (0.4921 ) & (0.2016 ) & (0.1415 ) & (0.0391 ) \tabularnewline
Estimates ( 3 ) & 0.3157 & 0 & 0.1159 & 0 & -0.2504 & -0.3214 & -1.0001 \tabularnewline
(p-val) & (0.0164 ) & (NA ) & (0.3815 ) & (NA ) & (0.1582 ) & (0.0769 ) & (0.0358 ) \tabularnewline
Estimates ( 4 ) & 0.3226 & 0 & 0 & 0 & -0.2214 & -0.3164 & -0.9988 \tabularnewline
(p-val) & (0.0152 ) & (NA ) & (NA ) & (NA ) & (0.1941 ) & (0.0803 ) & (0.0296 ) \tabularnewline
Estimates ( 5 ) & 0.3027 & 0 & 0 & 0 & 0 & -0.1859 & -1 \tabularnewline
(p-val) & (0.0218 ) & (NA ) & (NA ) & (NA ) & (NA ) & (0.2784 ) & (3e-04 ) \tabularnewline
Estimates ( 6 ) & 0.3121 & 0 & 0 & 0 & 0 & 0 & -0.9996 \tabularnewline
(p-val) & (0.0174 ) & (NA ) & (NA ) & (NA ) & (NA ) & (NA ) & (1e-04 ) \tabularnewline
Estimates ( 7 ) & NA & NA & NA & NA & NA & NA & NA \tabularnewline
(p-val) & (NA ) & (NA ) & (NA ) & (NA ) & (NA ) & (NA ) & (NA ) \tabularnewline
Estimates ( 8 ) & NA & NA & NA & NA & NA & NA & NA \tabularnewline
(p-val) & (NA ) & (NA ) & (NA ) & (NA ) & (NA ) & (NA ) & (NA ) \tabularnewline
Estimates ( 9 ) & NA & NA & NA & NA & NA & NA & NA \tabularnewline
(p-val) & (NA ) & (NA ) & (NA ) & (NA ) & (NA ) & (NA ) & (NA ) \tabularnewline
Estimates ( 10 ) & NA & NA & NA & NA & NA & NA & NA \tabularnewline
(p-val) & (NA ) & (NA ) & (NA ) & (NA ) & (NA ) & (NA ) & (NA ) \tabularnewline
Estimates ( 11 ) & NA & NA & NA & NA & NA & NA & NA \tabularnewline
(p-val) & (NA ) & (NA ) & (NA ) & (NA ) & (NA ) & (NA ) & (NA ) \tabularnewline
Estimates ( 12 ) & NA & NA & NA & NA & NA & NA & NA \tabularnewline
(p-val) & (NA ) & (NA ) & (NA ) & (NA ) & (NA ) & (NA ) & (NA ) \tabularnewline
Estimates ( 13 ) & NA & NA & NA & NA & NA & NA & NA \tabularnewline
(p-val) & (NA ) & (NA ) & (NA ) & (NA ) & (NA ) & (NA ) & (NA ) \tabularnewline
\hline
\end{tabular}
%Source: https://freestatistics.org/blog/index.php?pk=111736&T=1

[TABLE]
[ROW][C]ARIMA Parameter Estimation and Backward Selection[/C][/ROW]
[ROW][C]Iteration[/C][C]ar1[/C][C]ar2[/C][C]ar3[/C][C]ma1[/C][C]sar1[/C][C]sar2[/C][C]sma1[/C][/ROW]
[ROW][C]Estimates ( 1 )[/C][C]0.8642[/C][C]-0.2919[/C][C]0.2356[/C][C]-0.542[/C][C]-0.2528[/C][C]-0.3717[/C][C]-0.9999[/C][/ROW]
[ROW][C](p-val)[/C][C](0.0036 )[/C][C](0.1533 )[/C][C](0.1215 )[/C][C](0.0467 )[/C][C](0.1507 )[/C][C](0.0541 )[/C][C](0.048 )[/C][/ROW]
[ROW][C]Estimates ( 2 )[/C][C]0.5979[/C][C]0[/C][C]0.1151[/C][C]-0.372[/C][C]-0.2352[/C][C]-0.2839[/C][C]-0.9995[/C][/ROW]
[ROW][C](p-val)[/C][C](0.1549 )[/C][C](NA )[/C][C](0.3914 )[/C][C](0.4921 )[/C][C](0.2016 )[/C][C](0.1415 )[/C][C](0.0391 )[/C][/ROW]
[ROW][C]Estimates ( 3 )[/C][C]0.3157[/C][C]0[/C][C]0.1159[/C][C]0[/C][C]-0.2504[/C][C]-0.3214[/C][C]-1.0001[/C][/ROW]
[ROW][C](p-val)[/C][C](0.0164 )[/C][C](NA )[/C][C](0.3815 )[/C][C](NA )[/C][C](0.1582 )[/C][C](0.0769 )[/C][C](0.0358 )[/C][/ROW]
[ROW][C]Estimates ( 4 )[/C][C]0.3226[/C][C]0[/C][C]0[/C][C]0[/C][C]-0.2214[/C][C]-0.3164[/C][C]-0.9988[/C][/ROW]
[ROW][C](p-val)[/C][C](0.0152 )[/C][C](NA )[/C][C](NA )[/C][C](NA )[/C][C](0.1941 )[/C][C](0.0803 )[/C][C](0.0296 )[/C][/ROW]
[ROW][C]Estimates ( 5 )[/C][C]0.3027[/C][C]0[/C][C]0[/C][C]0[/C][C]0[/C][C]-0.1859[/C][C]-1[/C][/ROW]
[ROW][C](p-val)[/C][C](0.0218 )[/C][C](NA )[/C][C](NA )[/C][C](NA )[/C][C](NA )[/C][C](0.2784 )[/C][C](3e-04 )[/C][/ROW]
[ROW][C]Estimates ( 6 )[/C][C]0.3121[/C][C]0[/C][C]0[/C][C]0[/C][C]0[/C][C]0[/C][C]-0.9996[/C][/ROW]
[ROW][C](p-val)[/C][C](0.0174 )[/C][C](NA )[/C][C](NA )[/C][C](NA )[/C][C](NA )[/C][C](NA )[/C][C](1e-04 )[/C][/ROW]
[ROW][C]Estimates ( 7 )[/C][C]NA[/C][C]NA[/C][C]NA[/C][C]NA[/C][C]NA[/C][C]NA[/C][C]NA[/C][/ROW]
[ROW][C](p-val)[/C][C](NA )[/C][C](NA )[/C][C](NA )[/C][C](NA )[/C][C](NA )[/C][C](NA )[/C][C](NA )[/C][/ROW]
[ROW][C]Estimates ( 8 )[/C][C]NA[/C][C]NA[/C][C]NA[/C][C]NA[/C][C]NA[/C][C]NA[/C][C]NA[/C][/ROW]
[ROW][C](p-val)[/C][C](NA )[/C][C](NA )[/C][C](NA )[/C][C](NA )[/C][C](NA )[/C][C](NA )[/C][C](NA )[/C][/ROW]
[ROW][C]Estimates ( 9 )[/C][C]NA[/C][C]NA[/C][C]NA[/C][C]NA[/C][C]NA[/C][C]NA[/C][C]NA[/C][/ROW]
[ROW][C](p-val)[/C][C](NA )[/C][C](NA )[/C][C](NA )[/C][C](NA )[/C][C](NA )[/C][C](NA )[/C][C](NA )[/C][/ROW]
[ROW][C]Estimates ( 10 )[/C][C]NA[/C][C]NA[/C][C]NA[/C][C]NA[/C][C]NA[/C][C]NA[/C][C]NA[/C][/ROW]
[ROW][C](p-val)[/C][C](NA )[/C][C](NA )[/C][C](NA )[/C][C](NA )[/C][C](NA )[/C][C](NA )[/C][C](NA )[/C][/ROW]
[ROW][C]Estimates ( 11 )[/C][C]NA[/C][C]NA[/C][C]NA[/C][C]NA[/C][C]NA[/C][C]NA[/C][C]NA[/C][/ROW]
[ROW][C](p-val)[/C][C](NA )[/C][C](NA )[/C][C](NA )[/C][C](NA )[/C][C](NA )[/C][C](NA )[/C][C](NA )[/C][/ROW]
[ROW][C]Estimates ( 12 )[/C][C]NA[/C][C]NA[/C][C]NA[/C][C]NA[/C][C]NA[/C][C]NA[/C][C]NA[/C][/ROW]
[ROW][C](p-val)[/C][C](NA )[/C][C](NA )[/C][C](NA )[/C][C](NA )[/C][C](NA )[/C][C](NA )[/C][C](NA )[/C][/ROW]
[ROW][C]Estimates ( 13 )[/C][C]NA[/C][C]NA[/C][C]NA[/C][C]NA[/C][C]NA[/C][C]NA[/C][C]NA[/C][/ROW]
[ROW][C](p-val)[/C][C](NA )[/C][C](NA )[/C][C](NA )[/C][C](NA )[/C][C](NA )[/C][C](NA )[/C][C](NA )[/C][/ROW]
[/TABLE]
Source: https://freestatistics.org/blog/index.php?pk=111736&T=1

Globally Unique Identifier (entire table): ba.freestatistics.org/blog/index.php?pk=111736&T=1

As an alternative you can also use a QR Code:  

The GUIDs for individual cells are displayed in the table below:

ARIMA Parameter Estimation and Backward Selection
Iterationar1ar2ar3ma1sar1sar2sma1
Estimates ( 1 )0.8642-0.29190.2356-0.542-0.2528-0.3717-0.9999
(p-val)(0.0036 )(0.1533 )(0.1215 )(0.0467 )(0.1507 )(0.0541 )(0.048 )
Estimates ( 2 )0.597900.1151-0.372-0.2352-0.2839-0.9995
(p-val)(0.1549 )(NA )(0.3914 )(0.4921 )(0.2016 )(0.1415 )(0.0391 )
Estimates ( 3 )0.315700.11590-0.2504-0.3214-1.0001
(p-val)(0.0164 )(NA )(0.3815 )(NA )(0.1582 )(0.0769 )(0.0358 )
Estimates ( 4 )0.3226000-0.2214-0.3164-0.9988
(p-val)(0.0152 )(NA )(NA )(NA )(0.1941 )(0.0803 )(0.0296 )
Estimates ( 5 )0.30270000-0.1859-1
(p-val)(0.0218 )(NA )(NA )(NA )(NA )(0.2784 )(3e-04 )
Estimates ( 6 )0.312100000-0.9996
(p-val)(0.0174 )(NA )(NA )(NA )(NA )(NA )(1e-04 )
Estimates ( 7 )NANANANANANANA
(p-val)(NA )(NA )(NA )(NA )(NA )(NA )(NA )
Estimates ( 8 )NANANANANANANA
(p-val)(NA )(NA )(NA )(NA )(NA )(NA )(NA )
Estimates ( 9 )NANANANANANANA
(p-val)(NA )(NA )(NA )(NA )(NA )(NA )(NA )
Estimates ( 10 )NANANANANANANA
(p-val)(NA )(NA )(NA )(NA )(NA )(NA )(NA )
Estimates ( 11 )NANANANANANANA
(p-val)(NA )(NA )(NA )(NA )(NA )(NA )(NA )
Estimates ( 12 )NANANANANANANA
(p-val)(NA )(NA )(NA )(NA )(NA )(NA )(NA )
Estimates ( 13 )NANANANANANANA
(p-val)(NA )(NA )(NA )(NA )(NA )(NA )(NA )


Estimated ARIMA Residuals
Value
-10.3431069551914
33.3661288235848
-226.746109992256
155.549099741971
-17.396365971289
-186.747261672406
110.216302036553
78.4119312034238
-75.7979406636012
33.3241980795861
111.263140433983
394.829631106367
375.212965418942
-185.180459680349
154.901294747512
410.359623764463
89.4066491385988
-151.455843358974
117.688113809124
-167.067185630677
322.846682631487
-29.1758054836970
81.3345575857073
-362.151114352865
-11.3637472632652
155.049922220793
71.4624582054641
-163.988618700948
-29.2971861939803
-20.5806042060222
-87.2417464073307
99.7304273203685
-230.119985076994
-134.303521554723
-81.7761449878806
-35.4905990840052
-90.6214511537339
-13.7490948294773
-159.417835260124
-30.7276416810622
301.728306046242
12.3175086132773
-5.89839081889119
-190.535956983961
-165.742050192025
13.3430839255884
-195.906596463857
15.1218629657076
-89.114859554163
125.541146619190
-173.153544748117
-140.642861483385
8.73748503000637
177.302815257456
-16.5912573818086

\begin{tabular}{lllllllll}
\hline
Estimated ARIMA Residuals \tabularnewline
Value \tabularnewline
-10.3431069551914 \tabularnewline
33.3661288235848 \tabularnewline
-226.746109992256 \tabularnewline
155.549099741971 \tabularnewline
-17.396365971289 \tabularnewline
-186.747261672406 \tabularnewline
110.216302036553 \tabularnewline
78.4119312034238 \tabularnewline
-75.7979406636012 \tabularnewline
33.3241980795861 \tabularnewline
111.263140433983 \tabularnewline
394.829631106367 \tabularnewline
375.212965418942 \tabularnewline
-185.180459680349 \tabularnewline
154.901294747512 \tabularnewline
410.359623764463 \tabularnewline
89.4066491385988 \tabularnewline
-151.455843358974 \tabularnewline
117.688113809124 \tabularnewline
-167.067185630677 \tabularnewline
322.846682631487 \tabularnewline
-29.1758054836970 \tabularnewline
81.3345575857073 \tabularnewline
-362.151114352865 \tabularnewline
-11.3637472632652 \tabularnewline
155.049922220793 \tabularnewline
71.4624582054641 \tabularnewline
-163.988618700948 \tabularnewline
-29.2971861939803 \tabularnewline
-20.5806042060222 \tabularnewline
-87.2417464073307 \tabularnewline
99.7304273203685 \tabularnewline
-230.119985076994 \tabularnewline
-134.303521554723 \tabularnewline
-81.7761449878806 \tabularnewline
-35.4905990840052 \tabularnewline
-90.6214511537339 \tabularnewline
-13.7490948294773 \tabularnewline
-159.417835260124 \tabularnewline
-30.7276416810622 \tabularnewline
301.728306046242 \tabularnewline
12.3175086132773 \tabularnewline
-5.89839081889119 \tabularnewline
-190.535956983961 \tabularnewline
-165.742050192025 \tabularnewline
13.3430839255884 \tabularnewline
-195.906596463857 \tabularnewline
15.1218629657076 \tabularnewline
-89.114859554163 \tabularnewline
125.541146619190 \tabularnewline
-173.153544748117 \tabularnewline
-140.642861483385 \tabularnewline
8.73748503000637 \tabularnewline
177.302815257456 \tabularnewline
-16.5912573818086 \tabularnewline
\hline
\end{tabular}
%Source: https://freestatistics.org/blog/index.php?pk=111736&T=2

[TABLE]
[ROW][C]Estimated ARIMA Residuals[/C][/ROW]
[ROW][C]Value[/C][/ROW]
[ROW][C]-10.3431069551914[/C][/ROW]
[ROW][C]33.3661288235848[/C][/ROW]
[ROW][C]-226.746109992256[/C][/ROW]
[ROW][C]155.549099741971[/C][/ROW]
[ROW][C]-17.396365971289[/C][/ROW]
[ROW][C]-186.747261672406[/C][/ROW]
[ROW][C]110.216302036553[/C][/ROW]
[ROW][C]78.4119312034238[/C][/ROW]
[ROW][C]-75.7979406636012[/C][/ROW]
[ROW][C]33.3241980795861[/C][/ROW]
[ROW][C]111.263140433983[/C][/ROW]
[ROW][C]394.829631106367[/C][/ROW]
[ROW][C]375.212965418942[/C][/ROW]
[ROW][C]-185.180459680349[/C][/ROW]
[ROW][C]154.901294747512[/C][/ROW]
[ROW][C]410.359623764463[/C][/ROW]
[ROW][C]89.4066491385988[/C][/ROW]
[ROW][C]-151.455843358974[/C][/ROW]
[ROW][C]117.688113809124[/C][/ROW]
[ROW][C]-167.067185630677[/C][/ROW]
[ROW][C]322.846682631487[/C][/ROW]
[ROW][C]-29.1758054836970[/C][/ROW]
[ROW][C]81.3345575857073[/C][/ROW]
[ROW][C]-362.151114352865[/C][/ROW]
[ROW][C]-11.3637472632652[/C][/ROW]
[ROW][C]155.049922220793[/C][/ROW]
[ROW][C]71.4624582054641[/C][/ROW]
[ROW][C]-163.988618700948[/C][/ROW]
[ROW][C]-29.2971861939803[/C][/ROW]
[ROW][C]-20.5806042060222[/C][/ROW]
[ROW][C]-87.2417464073307[/C][/ROW]
[ROW][C]99.7304273203685[/C][/ROW]
[ROW][C]-230.119985076994[/C][/ROW]
[ROW][C]-134.303521554723[/C][/ROW]
[ROW][C]-81.7761449878806[/C][/ROW]
[ROW][C]-35.4905990840052[/C][/ROW]
[ROW][C]-90.6214511537339[/C][/ROW]
[ROW][C]-13.7490948294773[/C][/ROW]
[ROW][C]-159.417835260124[/C][/ROW]
[ROW][C]-30.7276416810622[/C][/ROW]
[ROW][C]301.728306046242[/C][/ROW]
[ROW][C]12.3175086132773[/C][/ROW]
[ROW][C]-5.89839081889119[/C][/ROW]
[ROW][C]-190.535956983961[/C][/ROW]
[ROW][C]-165.742050192025[/C][/ROW]
[ROW][C]13.3430839255884[/C][/ROW]
[ROW][C]-195.906596463857[/C][/ROW]
[ROW][C]15.1218629657076[/C][/ROW]
[ROW][C]-89.114859554163[/C][/ROW]
[ROW][C]125.541146619190[/C][/ROW]
[ROW][C]-173.153544748117[/C][/ROW]
[ROW][C]-140.642861483385[/C][/ROW]
[ROW][C]8.73748503000637[/C][/ROW]
[ROW][C]177.302815257456[/C][/ROW]
[ROW][C]-16.5912573818086[/C][/ROW]
[/TABLE]
Source: https://freestatistics.org/blog/index.php?pk=111736&T=2

Globally Unique Identifier (entire table): ba.freestatistics.org/blog/index.php?pk=111736&T=2

As an alternative you can also use a QR Code:  

The GUIDs for individual cells are displayed in the table below:

Estimated ARIMA Residuals
Value
-10.3431069551914
33.3661288235848
-226.746109992256
155.549099741971
-17.396365971289
-186.747261672406
110.216302036553
78.4119312034238
-75.7979406636012
33.3241980795861
111.263140433983
394.829631106367
375.212965418942
-185.180459680349
154.901294747512
410.359623764463
89.4066491385988
-151.455843358974
117.688113809124
-167.067185630677
322.846682631487
-29.1758054836970
81.3345575857073
-362.151114352865
-11.3637472632652
155.049922220793
71.4624582054641
-163.988618700948
-29.2971861939803
-20.5806042060222
-87.2417464073307
99.7304273203685
-230.119985076994
-134.303521554723
-81.7761449878806
-35.4905990840052
-90.6214511537339
-13.7490948294773
-159.417835260124
-30.7276416810622
301.728306046242
12.3175086132773
-5.89839081889119
-190.535956983961
-165.742050192025
13.3430839255884
-195.906596463857
15.1218629657076
-89.114859554163
125.541146619190
-173.153544748117
-140.642861483385
8.73748503000637
177.302815257456
-16.5912573818086


Parameters (Session):
par1 = 1 ; par2 = 1 ; par3 = 1 ; par4 = 12 ;
Parameters (R input):
par1 = TRUE ; par2 = 1 ; par3 = 1 ; par4 = 1 ; par5 = 12 ; par6 = 3 ; par7 = 1 ; par8 = 2 ; par9 = 1 ;
R code (references can be found in the software module):
library(lattice)
if (par1 == 'TRUE') par1 <- TRUE
if (par1 == 'FALSE') par1 <- FALSE
par2 <- as.numeric(par2) #Box-Cox lambda transformation parameter
par3 <- as.numeric(par3) #degree of non-seasonal differencing
par4 <- as.numeric(par4) #degree of seasonal differencing
par5 <- as.numeric(par5) #seasonal period
par6 <- as.numeric(par6) #degree (p) of the non-seasonal AR(p) polynomial
par7 <- as.numeric(par7) #degree (q) of the non-seasonal MA(q) polynomial
par8 <- as.numeric(par8) #degree (P) of the seasonal AR(P) polynomial
par9 <- as.numeric(par9) #degree (Q) of the seasonal MA(Q) polynomial
armaGR <- function(arima.out, names, n){
try1 <- arima.out$coef
try2 <- sqrt(diag(arima.out$var.coef))
try.data.frame <- data.frame(matrix(NA,ncol=4,nrow=length(names)))
dimnames(try.data.frame) <- list(names,c('coef','std','tstat','pv'))
try.data.frame[,1] <- try1
for(i in 1:length(try2)) try.data.frame[which(rownames(try.data.frame)==names(try2)[i]),2] <- try2[i]
try.data.frame[,3] <- try.data.frame[,1] / try.data.frame[,2]
try.data.frame[,4] <- round((1-pt(abs(try.data.frame[,3]),df=n-(length(try2)+1)))*2,5)
vector <- rep(NA,length(names))
vector[is.na(try.data.frame[,4])] <- 0
maxi <- which.max(try.data.frame[,4])
continue <- max(try.data.frame[,4],na.rm=TRUE) > .05
vector[maxi] <- 0
list(summary=try.data.frame,next.vector=vector,continue=continue)
}
arimaSelect <- function(series, order=c(13,0,0), seasonal=list(order=c(2,0,0),period=12), include.mean=F){
nrc <- order[1]+order[3]+seasonal$order[1]+seasonal$order[3]
coeff <- matrix(NA, nrow=nrc*2, ncol=nrc)
pval <- matrix(NA, nrow=nrc*2, ncol=nrc)
mylist <- rep(list(NULL), nrc)
names <- NULL
if(order[1] > 0) names <- paste('ar',1:order[1],sep='')
if(order[3] > 0) names <- c( names , paste('ma',1:order[3],sep='') )
if(seasonal$order[1] > 0) names <- c(names, paste('sar',1:seasonal$order[1],sep=''))
if(seasonal$order[3] > 0) names <- c(names, paste('sma',1:seasonal$order[3],sep=''))
arima.out <- arima(series, order=order, seasonal=seasonal, include.mean=include.mean, method='ML')
mylist[[1]] <- arima.out
last.arma <- armaGR(arima.out, names, length(series))
mystop <- FALSE
i <- 1
coeff[i,] <- last.arma[[1]][,1]
pval [i,] <- last.arma[[1]][,4]
i <- 2
aic <- arima.out$aic
while(!mystop){
mylist[[i]] <- arima.out
arima.out <- arima(series, order=order, seasonal=seasonal, include.mean=include.mean, method='ML', fixed=last.arma$next.vector)
aic <- c(aic, arima.out$aic)
last.arma <- armaGR(arima.out, names, length(series))
mystop <- !last.arma$continue
coeff[i,] <- last.arma[[1]][,1]
pval [i,] <- last.arma[[1]][,4]
i <- i+1
}
list(coeff, pval, mylist, aic=aic)
}
arimaSelectplot <- function(arimaSelect.out,noms,choix){
noms <- names(arimaSelect.out[[3]][[1]]$coef)
coeff <- arimaSelect.out[[1]]
k <- min(which(is.na(coeff[,1])))-1
coeff <- coeff[1:k,]
pval <- arimaSelect.out[[2]][1:k,]
aic <- arimaSelect.out$aic[1:k]
coeff[coeff==0] <- NA
n <- ncol(coeff)
if(missing(choix)) choix <- k
layout(matrix(c(1,1,1,2,
3,3,3,2,
3,3,3,4,
5,6,7,7),nr=4),
widths=c(10,35,45,15),
heights=c(30,30,15,15))
couleurs <- rainbow(75)[1:50]#(50)
ticks <- pretty(coeff)
par(mar=c(1,1,3,1))
plot(aic,k:1-.5,type='o',pch=21,bg='blue',cex=2,axes=F,lty=2,xpd=NA)
points(aic[choix],k-choix+.5,pch=21,cex=4,bg=2,xpd=NA)
title('aic',line=2)
par(mar=c(3,0,0,0))
plot(0,axes=F,xlab='',ylab='',xlim=range(ticks),ylim=c(.1,1))
rect(xleft = min(ticks) + (0:49)/50*(max(ticks)-min(ticks)),
xright = min(ticks) + (1:50)/50*(max(ticks)-min(ticks)),
ytop = rep(1,50),
ybottom= rep(0,50),col=couleurs,border=NA)
axis(1,ticks)
rect(xleft=min(ticks),xright=max(ticks),ytop=1,ybottom=0)
text(mean(coeff,na.rm=T),.5,'coefficients',cex=2,font=2)
par(mar=c(1,1,3,1))
image(1:n,1:k,t(coeff[k:1,]),axes=F,col=couleurs,zlim=range(ticks))
for(i in 1:n) for(j in 1:k) if(!is.na(coeff[j,i])) {
if(pval[j,i]<.01) symb = 'green'
else if( (pval[j,i]<.05) & (pval[j,i]>=.01)) symb = 'orange'
else if( (pval[j,i]<.1) & (pval[j,i]>=.05)) symb = 'red'
else symb = 'black'
polygon(c(i+.5 ,i+.2 ,i+.5 ,i+.5),
c(k-j+0.5,k-j+0.5,k-j+0.8,k-j+0.5),
col=symb)
if(j==choix) {
rect(xleft=i-.5,
xright=i+.5,
ybottom=k-j+1.5,
ytop=k-j+.5,
lwd=4)
text(i,
k-j+1,
round(coeff[j,i],2),
cex=1.2,
font=2)
}
else{
rect(xleft=i-.5,xright=i+.5,ybottom=k-j+1.5,ytop=k-j+.5)
text(i,k-j+1,round(coeff[j,i],2),cex=1.2,font=1)
}
}
axis(3,1:n,noms)
par(mar=c(0.5,0,0,0.5))
plot(0,axes=F,xlab='',ylab='',type='n',xlim=c(0,8),ylim=c(-.2,.8))
cols <- c('green','orange','red','black')
niv <- c('0','0.01','0.05','0.1')
for(i in 0:3){
polygon(c(1+2*i ,1+2*i ,1+2*i-.5 ,1+2*i),
c(.4 ,.7 , .4 , .4),
col=cols[i+1])
text(2*i,0.5,niv[i+1],cex=1.5)
}
text(8,.5,1,cex=1.5)
text(4,0,'p-value',cex=2)
box()
residus <- arimaSelect.out[[3]][[choix]]$res
par(mar=c(1,2,4,1))
acf(residus,main='')
title('acf',line=.5)
par(mar=c(1,2,4,1))
pacf(residus,main='')
title('pacf',line=.5)
par(mar=c(2,2,4,1))
qqnorm(residus,main='')
title('qq-norm',line=.5)
qqline(residus)
residus
}
if (par2 == 0) x <- log(x)
if (par2 != 0) x <- x^par2
(selection <- arimaSelect(x, order=c(par6,par3,par7), seasonal=list(order=c(par8,par4,par9), period=par5)))
bitmap(file='test1.png')
resid <- arimaSelectplot(selection)
dev.off()
resid
bitmap(file='test2.png')
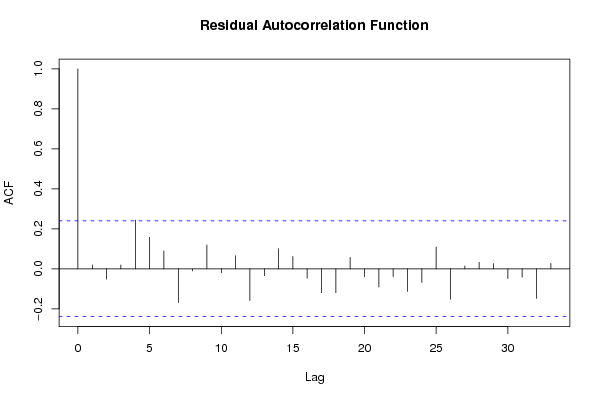
acf(resid,length(resid)/2, main='Residual Autocorrelation Function')
dev.off()
bitmap(file='test3.png')
pacf(resid,length(resid)/2, main='Residual Partial Autocorrelation Function')
dev.off()
bitmap(file='test4.png')
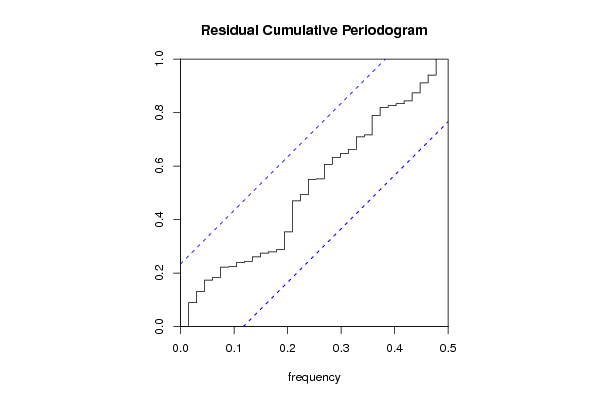
cpgram(resid, main='Residual Cumulative Periodogram')
dev.off()
bitmap(file='test5.png')
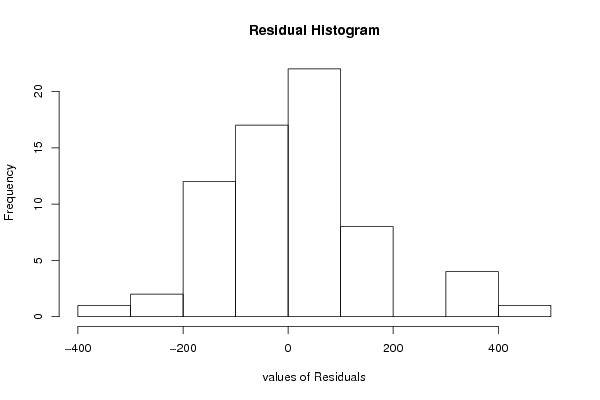
hist(resid, main='Residual Histogram', xlab='values of Residuals')
dev.off()
bitmap(file='test6.png')
densityplot(~resid,col='black',main='Residual Density Plot', xlab='values of Residuals')
dev.off()
bitmap(file='test7.png')
qqnorm(resid, main='Residual Normal Q-Q Plot')
qqline(resid)
dev.off()
ncols <- length(selection[[1]][1,])
nrows <- length(selection[[2]][,1])-1
load(file='createtable')
a<-table.start()
a<-table.row.start(a)
a<-table.element(a,'ARIMA Parameter Estimation and Backward Selection', ncols+1,TRUE)
a<-table.row.end(a)
a<-table.row.start(a)
a<-table.element(a,'Iteration', header=TRUE)
for (i in 1:ncols) {
a<-table.element(a,names(selection[[3]][[1]]$coef)[i],header=TRUE)
}
a<-table.row.end(a)
for (j in 1:nrows) {
a<-table.row.start(a)
mydum <- 'Estimates ('
mydum <- paste(mydum,j)
mydum <- paste(mydum,')')
a<-table.element(a,mydum, header=TRUE)
for (i in 1:ncols) {
a<-table.element(a,round(selection[[1]][j,i],4))
}
a<-table.row.end(a)
a<-table.row.start(a)
a<-table.element(a,'(p-val)', header=TRUE)
for (i in 1:ncols) {
mydum <- '('
mydum <- paste(mydum,round(selection[[2]][j,i],4),sep='')
mydum <- paste(mydum,')')
a<-table.element(a,mydum)
}
a<-table.row.end(a)
}
a<-table.end(a)
table.save(a,file='mytable.tab')
a<-table.start()
a<-table.row.start(a)
a<-table.element(a,'Estimated ARIMA Residuals', 1,TRUE)
a<-table.row.end(a)
a<-table.row.start(a)
a<-table.element(a,'Value', 1,TRUE)
a<-table.row.end(a)
for (i in (par4*par5+par3):length(resid)) {
a<-table.row.start(a)
a<-table.element(a,resid[i])
a<-table.row.end(a)
}
a<-table.end(a)
table.save(a,file='mytable1.tab')