Free Statistics
of Irreproducible Research!
Description of Statistical Computation | |||||||||||||||||||||||||||||||||||||||||
|---|---|---|---|---|---|---|---|---|---|---|---|---|---|---|---|---|---|---|---|---|---|---|---|---|---|---|---|---|---|---|---|---|---|---|---|---|---|---|---|---|---|
| Author's title | |||||||||||||||||||||||||||||||||||||||||
| Author | *The author of this computation has been verified* | ||||||||||||||||||||||||||||||||||||||||
| R Software Module | rwasp_univariatedataseries.wasp | ||||||||||||||||||||||||||||||||||||||||
| Title produced by software | Univariate Data Series | ||||||||||||||||||||||||||||||||||||||||
| Date of computation | Fri, 17 Dec 2010 15:42:30 +0000 | ||||||||||||||||||||||||||||||||||||||||
| Cite this page as follows | Statistical Computations at FreeStatistics.org, Office for Research Development and Education, URL https://freestatistics.org/blog/index.php?v=date/2010/Dec/17/t1292600557m5aknz7bn6nvzyg.htm/, Retrieved Wed, 31 Dec 2025 17:27:59 +0000 | ||||||||||||||||||||||||||||||||||||||||
| Statistical Computations at FreeStatistics.org, Office for Research Development and Education, URL https://freestatistics.org/blog/index.php?pk=111536, Retrieved Wed, 31 Dec 2025 17:27:59 +0000 | |||||||||||||||||||||||||||||||||||||||||
| QR Codes: | |||||||||||||||||||||||||||||||||||||||||
|
| |||||||||||||||||||||||||||||||||||||||||
| Original text written by user: | |||||||||||||||||||||||||||||||||||||||||
| IsPrivate? | No (this computation is public) | ||||||||||||||||||||||||||||||||||||||||
| User-defined keywords | |||||||||||||||||||||||||||||||||||||||||
| Estimated Impact | 424 | ||||||||||||||||||||||||||||||||||||||||
Tree of Dependent Computations | |||||||||||||||||||||||||||||||||||||||||
| Family? (F = Feedback message, R = changed R code, M = changed R Module, P = changed Parameters, D = changed Data) | |||||||||||||||||||||||||||||||||||||||||
| - [Classical Decomposition] [HPC Retail Sales] [2008-03-02 16:19:32] [74be16979710d4c4e7c6647856088456] F M D [Classical Decomposition] [] [2010-11-26 10:00:41] [8a9a6f7c332640af31ddca253a8ded58] - RMPD [Univariate Data Series] [Cultuurbestedingen] [2010-12-17 10:40:41] [8a9a6f7c332640af31ddca253a8ded58] - [Univariate Data Series] [Tijdreeks cultuur...] [2010-12-17 14:01:06] [74deae64b71f9d77c839af86f7c687b5] - D [Univariate Data Series] [tijdreeks schouwb...] [2010-12-17 15:42:30] [e665313c9926a9f4bdf6ad1ee5aefad6] [Current] | |||||||||||||||||||||||||||||||||||||||||
| Feedback Forum | |||||||||||||||||||||||||||||||||||||||||
Post a new message | |||||||||||||||||||||||||||||||||||||||||
Dataset | |||||||||||||||||||||||||||||||||||||||||
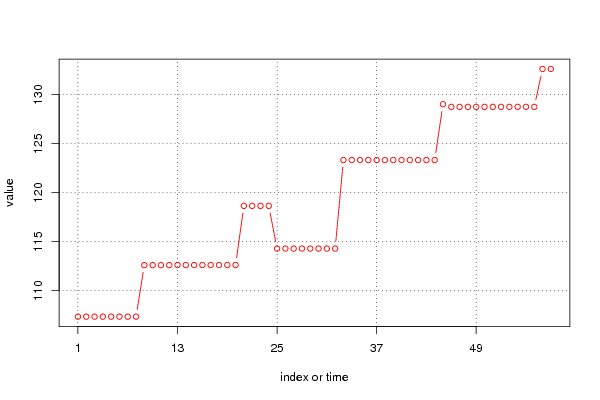
| Dataseries X: | |||||||||||||||||||||||||||||||||||||||||
107,34 107,34 107,34 107,34 107,34 107,34 107,34 107,34 112,60 112,60 112,60 112,60 112,61 112,61 112,61 112,61 112,61 112,61 112,61 112,61 118,65 118,65 118,65 118,65 114,29 114,29 114,29 114,29 114,29 114,29 114,29 114,29 123,33 123,33 123,33 123,33 123,33 123,33 123,33 123,33 123,33 123,33 123,33 123,33 129,03 128,76 128,76 128,76 128,76 128,76 128,76 128,76 128,76 128,76 128,76 128,76 132,63 132,63 | |||||||||||||||||||||||||||||||||||||||||
Tables (Output of Computation) | |||||||||||||||||||||||||||||||||||||||||
| |||||||||||||||||||||||||||||||||||||||||
Figures (Output of Computation) | |||||||||||||||||||||||||||||||||||||||||
Input Parameters & R Code | |||||||||||||||||||||||||||||||||||||||||
| Parameters (Session): | |||||||||||||||||||||||||||||||||||||||||
| par1 = Cultuurbestedingen ; par4 = 12 ; | |||||||||||||||||||||||||||||||||||||||||
| Parameters (R input): | |||||||||||||||||||||||||||||||||||||||||
| par1 = Cultuurbestedingen ; par2 = ; par3 = ; par4 = 12 ; | |||||||||||||||||||||||||||||||||||||||||
| R code (references can be found in the software module): | |||||||||||||||||||||||||||||||||||||||||
if (par4 != 'No season') { | |||||||||||||||||||||||||||||||||||||||||