Free Statistics

of Irreproducible Research!

Author's title

Author*The author of this computation has been verified*
R Software Modulerwasp_multipleregression.wasp
Title produced by softwareMultiple Regression
Date of computationFri, 17 Dec 2010 12:00:00 +0000
Cite this page as followsStatistical Computations at FreeStatistics.org, Office for Research Development and Education, URL https://freestatistics.org/blog/index.php?v=date/2010/Dec/17/t1292587094wo7svy23w5bzvlx.htm/, Retrieved Fri, 03 May 2024 13:42:26 +0000
Statistical Computations at FreeStatistics.org, Office for Research Development and Education, URL https://freestatistics.org/blog/index.php?pk=111404, Retrieved Fri, 03 May 2024 13:42:26 +0000
QR Codes:

Original text written by user:
IsPrivate?No (this computation is public)
User-defined keywords
Estimated Impact169
Family? (F = Feedback message, R = changed R code, M = changed R Module, P = changed Parameters, D = changed Data)
-     [Multiple Regression] [HPC Retail Sales] [2008-03-08 13:40:54] [1c0f2c85e8a48e42648374b3bcceca26]
- RMPD  [Multiple Regression] [] [2010-11-26 11:40:42] [d39e5c40c631ed6c22677d2e41dbfc7d]
-    D    [Multiple Regression] [] [2010-12-15 20:39:35] [d39e5c40c631ed6c22677d2e41dbfc7d]
-    D        [Multiple Regression] [] [2010-12-17 12:00:00] [1d094c42a82a95b45a19e32ad4bfff5f] [Current]
-    D          [Multiple Regression] [] [2010-12-17 12:30:50] [d39e5c40c631ed6c22677d2e41dbfc7d]
-    D          [Multiple Regression] [] [2010-12-17 12:34:10] [d39e5c40c631ed6c22677d2e41dbfc7d]
Feedback Forum

Post a new message
Dataseries X:
461
463
462
456
455
456
472
472
471
465
459
465
468
467
463
460
462
461
476
476
471
453
443
442
444
438
427
424
416
406
431
434
418
412
404
409
412
406
398
397
385
390
413
413
401
397
397
409
419
424
428
430
424
433
456
459
446
441
439
454
460


Summary of computational transaction
Raw Inputview raw input (R code)
Raw Outputview raw output of R engine
Computing time7 seconds
R Server'George Udny Yule' @ 72.249.76.132

\begin{tabular}{lllllllll}
\hline
Summary of computational transaction \tabularnewline
Raw Input & view raw input (R code)  \tabularnewline
Raw Output & view raw output of R engine  \tabularnewline
Computing time & 7 seconds \tabularnewline
R Server & 'George Udny Yule' @ 72.249.76.132 \tabularnewline
\hline
\end{tabular}
%Source: https://freestatistics.org/blog/index.php?pk=111404&T=0

[TABLE]
[ROW][C]Summary of computational transaction[/C][/ROW]
[ROW][C]Raw Input[/C][C]view raw input (R code) [/C][/ROW]
[ROW][C]Raw Output[/C][C]view raw output of R engine [/C][/ROW]
[ROW][C]Computing time[/C][C]7 seconds[/C][/ROW]
[ROW][C]R Server[/C][C]'George Udny Yule' @ 72.249.76.132[/C][/ROW]
[/TABLE]
Source: https://freestatistics.org/blog/index.php?pk=111404&T=0

Globally Unique Identifier (entire table): ba.freestatistics.org/blog/index.php?pk=111404&T=0

As an alternative you can also use a QR Code:  

The GUIDs for individual cells are displayed in the table below:

Summary of computational transaction
Raw Inputview raw input (R code)
Raw Outputview raw output of R engine
Computing time7 seconds
R Server'George Udny Yule' @ 72.249.76.132


Multiple Linear Regression - Estimated Regression Equation
HPC[t] = + 466.011764705882 + 4.00392156862764M1[t] -4.59215686274512M2[t] -7.7529411764706M3[t] -9.1137254901961M4[t] -13.2745098039216M5[t] -11.6352941176471M6[t] + 9.60392156862745M7[t] + 11.6431372549020M8[t] + 3.08235294117648M9[t] -3.87843137254902M10[t] -8.2392156862745M11[t] -0.83921568627451t + e[t]

\begin{tabular}{lllllllll}
\hline
Multiple Linear Regression - Estimated Regression Equation \tabularnewline
HPC[t] =  +  466.011764705882 +  4.00392156862764M1[t] -4.59215686274512M2[t] -7.7529411764706M3[t] -9.1137254901961M4[t] -13.2745098039216M5[t] -11.6352941176471M6[t] +  9.60392156862745M7[t] +  11.6431372549020M8[t] +  3.08235294117648M9[t] -3.87843137254902M10[t] -8.2392156862745M11[t] -0.83921568627451t  + e[t] \tabularnewline
\hline
\end{tabular}
%Source: https://freestatistics.org/blog/index.php?pk=111404&T=1

[TABLE]
[ROW][C]Multiple Linear Regression - Estimated Regression Equation[/C][/ROW]
[ROW][C]HPC[t] =  +  466.011764705882 +  4.00392156862764M1[t] -4.59215686274512M2[t] -7.7529411764706M3[t] -9.1137254901961M4[t] -13.2745098039216M5[t] -11.6352941176471M6[t] +  9.60392156862745M7[t] +  11.6431372549020M8[t] +  3.08235294117648M9[t] -3.87843137254902M10[t] -8.2392156862745M11[t] -0.83921568627451t  + e[t][/C][/ROW]
[/TABLE]
Source: https://freestatistics.org/blog/index.php?pk=111404&T=1

Globally Unique Identifier (entire table): ba.freestatistics.org/blog/index.php?pk=111404&T=1

As an alternative you can also use a QR Code:  

The GUIDs for individual cells are displayed in the table below:

Multiple Linear Regression - Estimated Regression Equation
HPC[t] = + 466.011764705882 + 4.00392156862764M1[t] -4.59215686274512M2[t] -7.7529411764706M3[t] -9.1137254901961M4[t] -13.2745098039216M5[t] -11.6352941176471M6[t] + 9.60392156862745M7[t] + 11.6431372549020M8[t] + 3.08235294117648M9[t] -3.87843137254902M10[t] -8.2392156862745M11[t] -0.83921568627451t + e[t]


Multiple Linear Regression - Ordinary Least Squares
VariableParameterS.D.T-STATH0: parameter = 02-tail p-value1-tail p-value
(Intercept)466.01176470588211.7106639.793800
M14.0039215686276413.6573840.29320.7706570.385328
M2-4.5921568627451214.33487-0.32030.7500940.375047
M3-7.752941176470614.316564-0.54150.5906430.295321
M4-9.113725490196114.300165-0.63730.5269470.263474
M5-13.274509803921614.28568-0.92920.3574260.178713
M6-11.635294117647114.273115-0.81520.418990.209495
M79.6039215686274514.2624740.67340.5039410.251971
M811.643137254902014.2537610.81680.4180520.209026
M93.0823529411764814.2469810.21640.8296310.414815
M10-3.8784313725490214.242137-0.27230.7865430.393272
M11-8.239215686274514.239229-0.57860.5655460.282773
t-0.839215686274510.166146-5.05117e-063e-06

\begin{tabular}{lllllllll}
\hline
Multiple Linear Regression - Ordinary Least Squares \tabularnewline
Variable & Parameter & S.D. & T-STATH0: parameter = 0 & 2-tail p-value & 1-tail p-value \tabularnewline
(Intercept) & 466.011764705882 & 11.71066 & 39.7938 & 0 & 0 \tabularnewline
M1 & 4.00392156862764 & 13.657384 & 0.2932 & 0.770657 & 0.385328 \tabularnewline
M2 & -4.59215686274512 & 14.33487 & -0.3203 & 0.750094 & 0.375047 \tabularnewline
M3 & -7.7529411764706 & 14.316564 & -0.5415 & 0.590643 & 0.295321 \tabularnewline
M4 & -9.1137254901961 & 14.300165 & -0.6373 & 0.526947 & 0.263474 \tabularnewline
M5 & -13.2745098039216 & 14.28568 & -0.9292 & 0.357426 & 0.178713 \tabularnewline
M6 & -11.6352941176471 & 14.273115 & -0.8152 & 0.41899 & 0.209495 \tabularnewline
M7 & 9.60392156862745 & 14.262474 & 0.6734 & 0.503941 & 0.251971 \tabularnewline
M8 & 11.6431372549020 & 14.253761 & 0.8168 & 0.418052 & 0.209026 \tabularnewline
M9 & 3.08235294117648 & 14.246981 & 0.2164 & 0.829631 & 0.414815 \tabularnewline
M10 & -3.87843137254902 & 14.242137 & -0.2723 & 0.786543 & 0.393272 \tabularnewline
M11 & -8.2392156862745 & 14.239229 & -0.5786 & 0.565546 & 0.282773 \tabularnewline
t & -0.83921568627451 & 0.166146 & -5.0511 & 7e-06 & 3e-06 \tabularnewline
\hline
\end{tabular}
%Source: https://freestatistics.org/blog/index.php?pk=111404&T=2

[TABLE]
[ROW][C]Multiple Linear Regression - Ordinary Least Squares[/C][/ROW]
[ROW][C]Variable[/C][C]Parameter[/C][C]S.D.[/C][C]T-STATH0: parameter = 0[/C][C]2-tail p-value[/C][C]1-tail p-value[/C][/ROW]
[ROW][C](Intercept)[/C][C]466.011764705882[/C][C]11.71066[/C][C]39.7938[/C][C]0[/C][C]0[/C][/ROW]
[ROW][C]M1[/C][C]4.00392156862764[/C][C]13.657384[/C][C]0.2932[/C][C]0.770657[/C][C]0.385328[/C][/ROW]
[ROW][C]M2[/C][C]-4.59215686274512[/C][C]14.33487[/C][C]-0.3203[/C][C]0.750094[/C][C]0.375047[/C][/ROW]
[ROW][C]M3[/C][C]-7.7529411764706[/C][C]14.316564[/C][C]-0.5415[/C][C]0.590643[/C][C]0.295321[/C][/ROW]
[ROW][C]M4[/C][C]-9.1137254901961[/C][C]14.300165[/C][C]-0.6373[/C][C]0.526947[/C][C]0.263474[/C][/ROW]
[ROW][C]M5[/C][C]-13.2745098039216[/C][C]14.28568[/C][C]-0.9292[/C][C]0.357426[/C][C]0.178713[/C][/ROW]
[ROW][C]M6[/C][C]-11.6352941176471[/C][C]14.273115[/C][C]-0.8152[/C][C]0.41899[/C][C]0.209495[/C][/ROW]
[ROW][C]M7[/C][C]9.60392156862745[/C][C]14.262474[/C][C]0.6734[/C][C]0.503941[/C][C]0.251971[/C][/ROW]
[ROW][C]M8[/C][C]11.6431372549020[/C][C]14.253761[/C][C]0.8168[/C][C]0.418052[/C][C]0.209026[/C][/ROW]
[ROW][C]M9[/C][C]3.08235294117648[/C][C]14.246981[/C][C]0.2164[/C][C]0.829631[/C][C]0.414815[/C][/ROW]
[ROW][C]M10[/C][C]-3.87843137254902[/C][C]14.242137[/C][C]-0.2723[/C][C]0.786543[/C][C]0.393272[/C][/ROW]
[ROW][C]M11[/C][C]-8.2392156862745[/C][C]14.239229[/C][C]-0.5786[/C][C]0.565546[/C][C]0.282773[/C][/ROW]
[ROW][C]t[/C][C]-0.83921568627451[/C][C]0.166146[/C][C]-5.0511[/C][C]7e-06[/C][C]3e-06[/C][/ROW]
[/TABLE]
Source: https://freestatistics.org/blog/index.php?pk=111404&T=2

Globally Unique Identifier (entire table): ba.freestatistics.org/blog/index.php?pk=111404&T=2

As an alternative you can also use a QR Code:  

The GUIDs for individual cells are displayed in the table below:

Multiple Linear Regression - Ordinary Least Squares
VariableParameterS.D.T-STATH0: parameter = 02-tail p-value1-tail p-value
(Intercept)466.01176470588211.7106639.793800
M14.0039215686276413.6573840.29320.7706570.385328
M2-4.5921568627451214.33487-0.32030.7500940.375047
M3-7.752941176470614.316564-0.54150.5906430.295321
M4-9.113725490196114.300165-0.63730.5269470.263474
M5-13.274509803921614.28568-0.92920.3574260.178713
M6-11.635294117647114.273115-0.81520.418990.209495
M79.6039215686274514.2624740.67340.5039410.251971
M811.643137254902014.2537610.81680.4180520.209026
M93.0823529411764814.2469810.21640.8296310.414815
M10-3.8784313725490214.242137-0.27230.7865430.393272
M11-8.239215686274514.239229-0.57860.5655460.282773
t-0.839215686274510.166146-5.05117e-063e-06


Multiple Linear Regression - Regression Statistics
Multiple R0.632982889193472
R-squared0.400667338011716
Adjusted R-squared0.250834172514645
F-TEST (value)2.67408978968377
F-TEST (DF numerator)12
F-TEST (DF denominator)48
p-value0.0078111502846312
Multiple Linear Regression - Residual Statistics
Residual Standard Deviation22.5126652806640
Sum Squared Residuals24327.3647058823

\begin{tabular}{lllllllll}
\hline
Multiple Linear Regression - Regression Statistics \tabularnewline
Multiple R & 0.632982889193472 \tabularnewline
R-squared & 0.400667338011716 \tabularnewline
Adjusted R-squared & 0.250834172514645 \tabularnewline
F-TEST (value) & 2.67408978968377 \tabularnewline
F-TEST (DF numerator) & 12 \tabularnewline
F-TEST (DF denominator) & 48 \tabularnewline
p-value & 0.0078111502846312 \tabularnewline
Multiple Linear Regression - Residual Statistics \tabularnewline
Residual Standard Deviation & 22.5126652806640 \tabularnewline
Sum Squared Residuals & 24327.3647058823 \tabularnewline
\hline
\end{tabular}
%Source: https://freestatistics.org/blog/index.php?pk=111404&T=3

[TABLE]
[ROW][C]Multiple Linear Regression - Regression Statistics[/C][/ROW]
[ROW][C]Multiple R[/C][C]0.632982889193472[/C][/ROW]
[ROW][C]R-squared[/C][C]0.400667338011716[/C][/ROW]
[ROW][C]Adjusted R-squared[/C][C]0.250834172514645[/C][/ROW]
[ROW][C]F-TEST (value)[/C][C]2.67408978968377[/C][/ROW]
[ROW][C]F-TEST (DF numerator)[/C][C]12[/C][/ROW]
[ROW][C]F-TEST (DF denominator)[/C][C]48[/C][/ROW]
[ROW][C]p-value[/C][C]0.0078111502846312[/C][/ROW]
[ROW][C]Multiple Linear Regression - Residual Statistics[/C][/ROW]
[ROW][C]Residual Standard Deviation[/C][C]22.5126652806640[/C][/ROW]
[ROW][C]Sum Squared Residuals[/C][C]24327.3647058823[/C][/ROW]
[/TABLE]
Source: https://freestatistics.org/blog/index.php?pk=111404&T=3

Globally Unique Identifier (entire table): ba.freestatistics.org/blog/index.php?pk=111404&T=3

As an alternative you can also use a QR Code:  

The GUIDs for individual cells are displayed in the table below:

Multiple Linear Regression - Regression Statistics
Multiple R0.632982889193472
R-squared0.400667338011716
Adjusted R-squared0.250834172514645
F-TEST (value)2.67408978968377
F-TEST (DF numerator)12
F-TEST (DF denominator)48
p-value0.0078111502846312
Multiple Linear Regression - Residual Statistics
Residual Standard Deviation22.5126652806640
Sum Squared Residuals24327.3647058823


Multiple Linear Regression - Actuals, Interpolation, and Residuals
Time or IndexActualsInterpolationForecastResidualsPrediction Error
1461469.176470588234-8.17647058823438
2463459.7411764705883.2588235294117
3462455.7411764705886.25882352941172
4456453.5411764705882.45882352941174
5455448.5411764705886.45882352941175
6456449.3411764705886.65882352941173
7472469.7411764705882.25882352941173
8472470.9411764705881.05882352941173
9471461.5411764705889.45882352941174
10465453.74117647058811.2588235294117
11459448.54117647058810.4588235294117
12465455.9411764705889.05882352941173
13468459.1058823529418.8941176470585
14467449.67058823529417.3294117647059
15463445.67058823529417.3294117647059
16460443.47058823529416.5294117647058
17462438.47058823529423.5294117647059
18461439.27058823529421.7294117647059
19476459.67058823529416.3294117647059
20476460.87058823529415.1294117647059
21471451.47058823529419.5294117647059
22453443.6705882352949.32941176470586
23443438.4705882352944.52941176470586
24442445.870588235294-3.87058823529413
25444449.035294117647-5.03529411764724
26438439.6-1.59999999999999
27427435.6-8.6
28424433.4-9.4
29416428.4-12.4000000000000
30406429.2-23.2
31431449.6-18.6
32434450.8-16.8
33418441.4-23.4
34412433.6-21.6
35404428.4-24.4
36409435.8-26.8
37412438.964705882353-26.9647058823531
38406429.529411764706-23.5294117647059
39398425.529411764706-27.5294117647059
40397423.329411764706-26.3294117647059
41385418.329411764706-33.3294117647059
42390419.129411764706-29.1294117647059
43413439.529411764706-26.5294117647059
44413440.729411764706-27.7294117647059
45401431.329411764706-30.3294117647059
46397423.529411764706-26.5294117647058
47397418.329411764706-21.3294117647059
48409425.729411764706-16.7294117647059
49419428.894117647059-9.89411764705896
50424419.4588235294124.54117647058829
51428415.45882352941212.5411764705883
52430413.25882352941216.7411764705883
53424408.25882352941215.7411764705883
54433409.05882352941223.9411764705883
55456429.45882352941226.5411764705883
56459430.65882352941228.3411764705883
57446421.25882352941224.7411764705883
58441413.45882352941227.5411764705883
59439408.25882352941230.7411764705883
60454415.65882352941238.3411764705883
61460418.82352941176541.1764705882352

\begin{tabular}{lllllllll}
\hline
Multiple Linear Regression - Actuals, Interpolation, and Residuals \tabularnewline
Time or Index & Actuals & InterpolationForecast & ResidualsPrediction Error \tabularnewline
1 & 461 & 469.176470588234 & -8.17647058823438 \tabularnewline
2 & 463 & 459.741176470588 & 3.2588235294117 \tabularnewline
3 & 462 & 455.741176470588 & 6.25882352941172 \tabularnewline
4 & 456 & 453.541176470588 & 2.45882352941174 \tabularnewline
5 & 455 & 448.541176470588 & 6.45882352941175 \tabularnewline
6 & 456 & 449.341176470588 & 6.65882352941173 \tabularnewline
7 & 472 & 469.741176470588 & 2.25882352941173 \tabularnewline
8 & 472 & 470.941176470588 & 1.05882352941173 \tabularnewline
9 & 471 & 461.541176470588 & 9.45882352941174 \tabularnewline
10 & 465 & 453.741176470588 & 11.2588235294117 \tabularnewline
11 & 459 & 448.541176470588 & 10.4588235294117 \tabularnewline
12 & 465 & 455.941176470588 & 9.05882352941173 \tabularnewline
13 & 468 & 459.105882352941 & 8.8941176470585 \tabularnewline
14 & 467 & 449.670588235294 & 17.3294117647059 \tabularnewline
15 & 463 & 445.670588235294 & 17.3294117647059 \tabularnewline
16 & 460 & 443.470588235294 & 16.5294117647058 \tabularnewline
17 & 462 & 438.470588235294 & 23.5294117647059 \tabularnewline
18 & 461 & 439.270588235294 & 21.7294117647059 \tabularnewline
19 & 476 & 459.670588235294 & 16.3294117647059 \tabularnewline
20 & 476 & 460.870588235294 & 15.1294117647059 \tabularnewline
21 & 471 & 451.470588235294 & 19.5294117647059 \tabularnewline
22 & 453 & 443.670588235294 & 9.32941176470586 \tabularnewline
23 & 443 & 438.470588235294 & 4.52941176470586 \tabularnewline
24 & 442 & 445.870588235294 & -3.87058823529413 \tabularnewline
25 & 444 & 449.035294117647 & -5.03529411764724 \tabularnewline
26 & 438 & 439.6 & -1.59999999999999 \tabularnewline
27 & 427 & 435.6 & -8.6 \tabularnewline
28 & 424 & 433.4 & -9.4 \tabularnewline
29 & 416 & 428.4 & -12.4000000000000 \tabularnewline
30 & 406 & 429.2 & -23.2 \tabularnewline
31 & 431 & 449.6 & -18.6 \tabularnewline
32 & 434 & 450.8 & -16.8 \tabularnewline
33 & 418 & 441.4 & -23.4 \tabularnewline
34 & 412 & 433.6 & -21.6 \tabularnewline
35 & 404 & 428.4 & -24.4 \tabularnewline
36 & 409 & 435.8 & -26.8 \tabularnewline
37 & 412 & 438.964705882353 & -26.9647058823531 \tabularnewline
38 & 406 & 429.529411764706 & -23.5294117647059 \tabularnewline
39 & 398 & 425.529411764706 & -27.5294117647059 \tabularnewline
40 & 397 & 423.329411764706 & -26.3294117647059 \tabularnewline
41 & 385 & 418.329411764706 & -33.3294117647059 \tabularnewline
42 & 390 & 419.129411764706 & -29.1294117647059 \tabularnewline
43 & 413 & 439.529411764706 & -26.5294117647059 \tabularnewline
44 & 413 & 440.729411764706 & -27.7294117647059 \tabularnewline
45 & 401 & 431.329411764706 & -30.3294117647059 \tabularnewline
46 & 397 & 423.529411764706 & -26.5294117647058 \tabularnewline
47 & 397 & 418.329411764706 & -21.3294117647059 \tabularnewline
48 & 409 & 425.729411764706 & -16.7294117647059 \tabularnewline
49 & 419 & 428.894117647059 & -9.89411764705896 \tabularnewline
50 & 424 & 419.458823529412 & 4.54117647058829 \tabularnewline
51 & 428 & 415.458823529412 & 12.5411764705883 \tabularnewline
52 & 430 & 413.258823529412 & 16.7411764705883 \tabularnewline
53 & 424 & 408.258823529412 & 15.7411764705883 \tabularnewline
54 & 433 & 409.058823529412 & 23.9411764705883 \tabularnewline
55 & 456 & 429.458823529412 & 26.5411764705883 \tabularnewline
56 & 459 & 430.658823529412 & 28.3411764705883 \tabularnewline
57 & 446 & 421.258823529412 & 24.7411764705883 \tabularnewline
58 & 441 & 413.458823529412 & 27.5411764705883 \tabularnewline
59 & 439 & 408.258823529412 & 30.7411764705883 \tabularnewline
60 & 454 & 415.658823529412 & 38.3411764705883 \tabularnewline
61 & 460 & 418.823529411765 & 41.1764705882352 \tabularnewline
\hline
\end{tabular}
%Source: https://freestatistics.org/blog/index.php?pk=111404&T=4

[TABLE]
[ROW][C]Multiple Linear Regression - Actuals, Interpolation, and Residuals[/C][/ROW]
[ROW][C]Time or Index[/C][C]Actuals[/C][C]InterpolationForecast[/C][C]ResidualsPrediction Error[/C][/ROW]
[ROW][C]1[/C][C]461[/C][C]469.176470588234[/C][C]-8.17647058823438[/C][/ROW]
[ROW][C]2[/C][C]463[/C][C]459.741176470588[/C][C]3.2588235294117[/C][/ROW]
[ROW][C]3[/C][C]462[/C][C]455.741176470588[/C][C]6.25882352941172[/C][/ROW]
[ROW][C]4[/C][C]456[/C][C]453.541176470588[/C][C]2.45882352941174[/C][/ROW]
[ROW][C]5[/C][C]455[/C][C]448.541176470588[/C][C]6.45882352941175[/C][/ROW]
[ROW][C]6[/C][C]456[/C][C]449.341176470588[/C][C]6.65882352941173[/C][/ROW]
[ROW][C]7[/C][C]472[/C][C]469.741176470588[/C][C]2.25882352941173[/C][/ROW]
[ROW][C]8[/C][C]472[/C][C]470.941176470588[/C][C]1.05882352941173[/C][/ROW]
[ROW][C]9[/C][C]471[/C][C]461.541176470588[/C][C]9.45882352941174[/C][/ROW]
[ROW][C]10[/C][C]465[/C][C]453.741176470588[/C][C]11.2588235294117[/C][/ROW]
[ROW][C]11[/C][C]459[/C][C]448.541176470588[/C][C]10.4588235294117[/C][/ROW]
[ROW][C]12[/C][C]465[/C][C]455.941176470588[/C][C]9.05882352941173[/C][/ROW]
[ROW][C]13[/C][C]468[/C][C]459.105882352941[/C][C]8.8941176470585[/C][/ROW]
[ROW][C]14[/C][C]467[/C][C]449.670588235294[/C][C]17.3294117647059[/C][/ROW]
[ROW][C]15[/C][C]463[/C][C]445.670588235294[/C][C]17.3294117647059[/C][/ROW]
[ROW][C]16[/C][C]460[/C][C]443.470588235294[/C][C]16.5294117647058[/C][/ROW]
[ROW][C]17[/C][C]462[/C][C]438.470588235294[/C][C]23.5294117647059[/C][/ROW]
[ROW][C]18[/C][C]461[/C][C]439.270588235294[/C][C]21.7294117647059[/C][/ROW]
[ROW][C]19[/C][C]476[/C][C]459.670588235294[/C][C]16.3294117647059[/C][/ROW]
[ROW][C]20[/C][C]476[/C][C]460.870588235294[/C][C]15.1294117647059[/C][/ROW]
[ROW][C]21[/C][C]471[/C][C]451.470588235294[/C][C]19.5294117647059[/C][/ROW]
[ROW][C]22[/C][C]453[/C][C]443.670588235294[/C][C]9.32941176470586[/C][/ROW]
[ROW][C]23[/C][C]443[/C][C]438.470588235294[/C][C]4.52941176470586[/C][/ROW]
[ROW][C]24[/C][C]442[/C][C]445.870588235294[/C][C]-3.87058823529413[/C][/ROW]
[ROW][C]25[/C][C]444[/C][C]449.035294117647[/C][C]-5.03529411764724[/C][/ROW]
[ROW][C]26[/C][C]438[/C][C]439.6[/C][C]-1.59999999999999[/C][/ROW]
[ROW][C]27[/C][C]427[/C][C]435.6[/C][C]-8.6[/C][/ROW]
[ROW][C]28[/C][C]424[/C][C]433.4[/C][C]-9.4[/C][/ROW]
[ROW][C]29[/C][C]416[/C][C]428.4[/C][C]-12.4000000000000[/C][/ROW]
[ROW][C]30[/C][C]406[/C][C]429.2[/C][C]-23.2[/C][/ROW]
[ROW][C]31[/C][C]431[/C][C]449.6[/C][C]-18.6[/C][/ROW]
[ROW][C]32[/C][C]434[/C][C]450.8[/C][C]-16.8[/C][/ROW]
[ROW][C]33[/C][C]418[/C][C]441.4[/C][C]-23.4[/C][/ROW]
[ROW][C]34[/C][C]412[/C][C]433.6[/C][C]-21.6[/C][/ROW]
[ROW][C]35[/C][C]404[/C][C]428.4[/C][C]-24.4[/C][/ROW]
[ROW][C]36[/C][C]409[/C][C]435.8[/C][C]-26.8[/C][/ROW]
[ROW][C]37[/C][C]412[/C][C]438.964705882353[/C][C]-26.9647058823531[/C][/ROW]
[ROW][C]38[/C][C]406[/C][C]429.529411764706[/C][C]-23.5294117647059[/C][/ROW]
[ROW][C]39[/C][C]398[/C][C]425.529411764706[/C][C]-27.5294117647059[/C][/ROW]
[ROW][C]40[/C][C]397[/C][C]423.329411764706[/C][C]-26.3294117647059[/C][/ROW]
[ROW][C]41[/C][C]385[/C][C]418.329411764706[/C][C]-33.3294117647059[/C][/ROW]
[ROW][C]42[/C][C]390[/C][C]419.129411764706[/C][C]-29.1294117647059[/C][/ROW]
[ROW][C]43[/C][C]413[/C][C]439.529411764706[/C][C]-26.5294117647059[/C][/ROW]
[ROW][C]44[/C][C]413[/C][C]440.729411764706[/C][C]-27.7294117647059[/C][/ROW]
[ROW][C]45[/C][C]401[/C][C]431.329411764706[/C][C]-30.3294117647059[/C][/ROW]
[ROW][C]46[/C][C]397[/C][C]423.529411764706[/C][C]-26.5294117647058[/C][/ROW]
[ROW][C]47[/C][C]397[/C][C]418.329411764706[/C][C]-21.3294117647059[/C][/ROW]
[ROW][C]48[/C][C]409[/C][C]425.729411764706[/C][C]-16.7294117647059[/C][/ROW]
[ROW][C]49[/C][C]419[/C][C]428.894117647059[/C][C]-9.89411764705896[/C][/ROW]
[ROW][C]50[/C][C]424[/C][C]419.458823529412[/C][C]4.54117647058829[/C][/ROW]
[ROW][C]51[/C][C]428[/C][C]415.458823529412[/C][C]12.5411764705883[/C][/ROW]
[ROW][C]52[/C][C]430[/C][C]413.258823529412[/C][C]16.7411764705883[/C][/ROW]
[ROW][C]53[/C][C]424[/C][C]408.258823529412[/C][C]15.7411764705883[/C][/ROW]
[ROW][C]54[/C][C]433[/C][C]409.058823529412[/C][C]23.9411764705883[/C][/ROW]
[ROW][C]55[/C][C]456[/C][C]429.458823529412[/C][C]26.5411764705883[/C][/ROW]
[ROW][C]56[/C][C]459[/C][C]430.658823529412[/C][C]28.3411764705883[/C][/ROW]
[ROW][C]57[/C][C]446[/C][C]421.258823529412[/C][C]24.7411764705883[/C][/ROW]
[ROW][C]58[/C][C]441[/C][C]413.458823529412[/C][C]27.5411764705883[/C][/ROW]
[ROW][C]59[/C][C]439[/C][C]408.258823529412[/C][C]30.7411764705883[/C][/ROW]
[ROW][C]60[/C][C]454[/C][C]415.658823529412[/C][C]38.3411764705883[/C][/ROW]
[ROW][C]61[/C][C]460[/C][C]418.823529411765[/C][C]41.1764705882352[/C][/ROW]
[/TABLE]
Source: https://freestatistics.org/blog/index.php?pk=111404&T=4

Globally Unique Identifier (entire table): ba.freestatistics.org/blog/index.php?pk=111404&T=4

As an alternative you can also use a QR Code:  

The GUIDs for individual cells are displayed in the table below:

Multiple Linear Regression - Actuals, Interpolation, and Residuals
Time or IndexActualsInterpolationForecastResidualsPrediction Error
1461469.176470588234-8.17647058823438
2463459.7411764705883.2588235294117
3462455.7411764705886.25882352941172
4456453.5411764705882.45882352941174
5455448.5411764705886.45882352941175
6456449.3411764705886.65882352941173
7472469.7411764705882.25882352941173
8472470.9411764705881.05882352941173
9471461.5411764705889.45882352941174
10465453.74117647058811.2588235294117
11459448.54117647058810.4588235294117
12465455.9411764705889.05882352941173
13468459.1058823529418.8941176470585
14467449.67058823529417.3294117647059
15463445.67058823529417.3294117647059
16460443.47058823529416.5294117647058
17462438.47058823529423.5294117647059
18461439.27058823529421.7294117647059
19476459.67058823529416.3294117647059
20476460.87058823529415.1294117647059
21471451.47058823529419.5294117647059
22453443.6705882352949.32941176470586
23443438.4705882352944.52941176470586
24442445.870588235294-3.87058823529413
25444449.035294117647-5.03529411764724
26438439.6-1.59999999999999
27427435.6-8.6
28424433.4-9.4
29416428.4-12.4000000000000
30406429.2-23.2
31431449.6-18.6
32434450.8-16.8
33418441.4-23.4
34412433.6-21.6
35404428.4-24.4
36409435.8-26.8
37412438.964705882353-26.9647058823531
38406429.529411764706-23.5294117647059
39398425.529411764706-27.5294117647059
40397423.329411764706-26.3294117647059
41385418.329411764706-33.3294117647059
42390419.129411764706-29.1294117647059
43413439.529411764706-26.5294117647059
44413440.729411764706-27.7294117647059
45401431.329411764706-30.3294117647059
46397423.529411764706-26.5294117647058
47397418.329411764706-21.3294117647059
48409425.729411764706-16.7294117647059
49419428.894117647059-9.89411764705896
50424419.4588235294124.54117647058829
51428415.45882352941212.5411764705883
52430413.25882352941216.7411764705883
53424408.25882352941215.7411764705883
54433409.05882352941223.9411764705883
55456429.45882352941226.5411764705883
56459430.65882352941228.3411764705883
57446421.25882352941224.7411764705883
58441413.45882352941227.5411764705883
59439408.25882352941230.7411764705883
60454415.65882352941238.3411764705883
61460418.82352941176541.1764705882352


Goldfeld-Quandt test for Heteroskedasticity
p-valuesAlternative Hypothesis
breakpoint indexgreater2-sidedless
160.0004441894070390940.0008883788140781890.999555810592961
175.49289896581173e-050.0001098579793162350.999945071010342
184.09720977349934e-068.19441954699869e-060.999995902790227
192.98475209221193e-075.96950418442387e-070.99999970152479
202.21183336164477e-084.42366672328955e-080.999999977881666
211.72462664061682e-083.44925328123364e-080.999999982753734
226.63149324278127e-061.32629864855625e-050.999993368506757
236.9397182390108e-050.0001387943647802160.99993060281761
240.0005871585612669590.001174317122533920.999412841438733
250.001311690170053600.002623380340107200.998688309829946
260.004391683244242990.008783366488485990.995608316755757
270.01651574911867530.03303149823735050.983484250881325
280.03105246024499280.06210492048998570.968947539755007
290.0889820149561120.1779640299122240.911017985043888
300.1899034832114990.3798069664229990.8100965167885
310.2387641423508380.4775282847016760.761235857649162
320.3095357350485030.6190714700970060.690464264951497
330.486065467283870.972130934567740.51393453271613
340.6808554420444220.6382891159111570.319144557955578
350.8512861827798290.2974276344403420.148713817220171
360.9480147820773670.1039704358452660.0519852179226331
370.9966276069315140.006744786136971540.00337239306848577
380.9999090260075410.0001819479849171489.09739924585739e-05
390.999983113259643.37734807212868e-051.68867403606434e-05
400.9999992547807161.49043856807607e-067.45219284038036e-07
410.9999994488277751.10234444987671e-065.51172224938354e-07
420.999994308931791.13821364208502e-055.69106821042508e-06
430.9999451640684340.0001096718631318055.48359315659024e-05
440.999740662938380.0005186741232380780.000259337061619039
450.9982695098113030.003460980377393020.00173049018869651

\begin{tabular}{lllllllll}
\hline
Goldfeld-Quandt test for Heteroskedasticity \tabularnewline
p-values & Alternative Hypothesis \tabularnewline
breakpoint index & greater & 2-sided & less \tabularnewline
16 & 0.000444189407039094 & 0.000888378814078189 & 0.999555810592961 \tabularnewline
17 & 5.49289896581173e-05 & 0.000109857979316235 & 0.999945071010342 \tabularnewline
18 & 4.09720977349934e-06 & 8.19441954699869e-06 & 0.999995902790227 \tabularnewline
19 & 2.98475209221193e-07 & 5.96950418442387e-07 & 0.99999970152479 \tabularnewline
20 & 2.21183336164477e-08 & 4.42366672328955e-08 & 0.999999977881666 \tabularnewline
21 & 1.72462664061682e-08 & 3.44925328123364e-08 & 0.999999982753734 \tabularnewline
22 & 6.63149324278127e-06 & 1.32629864855625e-05 & 0.999993368506757 \tabularnewline
23 & 6.9397182390108e-05 & 0.000138794364780216 & 0.99993060281761 \tabularnewline
24 & 0.000587158561266959 & 0.00117431712253392 & 0.999412841438733 \tabularnewline
25 & 0.00131169017005360 & 0.00262338034010720 & 0.998688309829946 \tabularnewline
26 & 0.00439168324424299 & 0.00878336648848599 & 0.995608316755757 \tabularnewline
27 & 0.0165157491186753 & 0.0330314982373505 & 0.983484250881325 \tabularnewline
28 & 0.0310524602449928 & 0.0621049204899857 & 0.968947539755007 \tabularnewline
29 & 0.088982014956112 & 0.177964029912224 & 0.911017985043888 \tabularnewline
30 & 0.189903483211499 & 0.379806966422999 & 0.8100965167885 \tabularnewline
31 & 0.238764142350838 & 0.477528284701676 & 0.761235857649162 \tabularnewline
32 & 0.309535735048503 & 0.619071470097006 & 0.690464264951497 \tabularnewline
33 & 0.48606546728387 & 0.97213093456774 & 0.51393453271613 \tabularnewline
34 & 0.680855442044422 & 0.638289115911157 & 0.319144557955578 \tabularnewline
35 & 0.851286182779829 & 0.297427634440342 & 0.148713817220171 \tabularnewline
36 & 0.948014782077367 & 0.103970435845266 & 0.0519852179226331 \tabularnewline
37 & 0.996627606931514 & 0.00674478613697154 & 0.00337239306848577 \tabularnewline
38 & 0.999909026007541 & 0.000181947984917148 & 9.09739924585739e-05 \tabularnewline
39 & 0.99998311325964 & 3.37734807212868e-05 & 1.68867403606434e-05 \tabularnewline
40 & 0.999999254780716 & 1.49043856807607e-06 & 7.45219284038036e-07 \tabularnewline
41 & 0.999999448827775 & 1.10234444987671e-06 & 5.51172224938354e-07 \tabularnewline
42 & 0.99999430893179 & 1.13821364208502e-05 & 5.69106821042508e-06 \tabularnewline
43 & 0.999945164068434 & 0.000109671863131805 & 5.48359315659024e-05 \tabularnewline
44 & 0.99974066293838 & 0.000518674123238078 & 0.000259337061619039 \tabularnewline
45 & 0.998269509811303 & 0.00346098037739302 & 0.00173049018869651 \tabularnewline
\hline
\end{tabular}
%Source: https://freestatistics.org/blog/index.php?pk=111404&T=5

[TABLE]
[ROW][C]Goldfeld-Quandt test for Heteroskedasticity[/C][/ROW]
[ROW][C]p-values[/C][C]Alternative Hypothesis[/C][/ROW]
[ROW][C]breakpoint index[/C][C]greater[/C][C]2-sided[/C][C]less[/C][/ROW]
[ROW][C]16[/C][C]0.000444189407039094[/C][C]0.000888378814078189[/C][C]0.999555810592961[/C][/ROW]
[ROW][C]17[/C][C]5.49289896581173e-05[/C][C]0.000109857979316235[/C][C]0.999945071010342[/C][/ROW]
[ROW][C]18[/C][C]4.09720977349934e-06[/C][C]8.19441954699869e-06[/C][C]0.999995902790227[/C][/ROW]
[ROW][C]19[/C][C]2.98475209221193e-07[/C][C]5.96950418442387e-07[/C][C]0.99999970152479[/C][/ROW]
[ROW][C]20[/C][C]2.21183336164477e-08[/C][C]4.42366672328955e-08[/C][C]0.999999977881666[/C][/ROW]
[ROW][C]21[/C][C]1.72462664061682e-08[/C][C]3.44925328123364e-08[/C][C]0.999999982753734[/C][/ROW]
[ROW][C]22[/C][C]6.63149324278127e-06[/C][C]1.32629864855625e-05[/C][C]0.999993368506757[/C][/ROW]
[ROW][C]23[/C][C]6.9397182390108e-05[/C][C]0.000138794364780216[/C][C]0.99993060281761[/C][/ROW]
[ROW][C]24[/C][C]0.000587158561266959[/C][C]0.00117431712253392[/C][C]0.999412841438733[/C][/ROW]
[ROW][C]25[/C][C]0.00131169017005360[/C][C]0.00262338034010720[/C][C]0.998688309829946[/C][/ROW]
[ROW][C]26[/C][C]0.00439168324424299[/C][C]0.00878336648848599[/C][C]0.995608316755757[/C][/ROW]
[ROW][C]27[/C][C]0.0165157491186753[/C][C]0.0330314982373505[/C][C]0.983484250881325[/C][/ROW]
[ROW][C]28[/C][C]0.0310524602449928[/C][C]0.0621049204899857[/C][C]0.968947539755007[/C][/ROW]
[ROW][C]29[/C][C]0.088982014956112[/C][C]0.177964029912224[/C][C]0.911017985043888[/C][/ROW]
[ROW][C]30[/C][C]0.189903483211499[/C][C]0.379806966422999[/C][C]0.8100965167885[/C][/ROW]
[ROW][C]31[/C][C]0.238764142350838[/C][C]0.477528284701676[/C][C]0.761235857649162[/C][/ROW]
[ROW][C]32[/C][C]0.309535735048503[/C][C]0.619071470097006[/C][C]0.690464264951497[/C][/ROW]
[ROW][C]33[/C][C]0.48606546728387[/C][C]0.97213093456774[/C][C]0.51393453271613[/C][/ROW]
[ROW][C]34[/C][C]0.680855442044422[/C][C]0.638289115911157[/C][C]0.319144557955578[/C][/ROW]
[ROW][C]35[/C][C]0.851286182779829[/C][C]0.297427634440342[/C][C]0.148713817220171[/C][/ROW]
[ROW][C]36[/C][C]0.948014782077367[/C][C]0.103970435845266[/C][C]0.0519852179226331[/C][/ROW]
[ROW][C]37[/C][C]0.996627606931514[/C][C]0.00674478613697154[/C][C]0.00337239306848577[/C][/ROW]
[ROW][C]38[/C][C]0.999909026007541[/C][C]0.000181947984917148[/C][C]9.09739924585739e-05[/C][/ROW]
[ROW][C]39[/C][C]0.99998311325964[/C][C]3.37734807212868e-05[/C][C]1.68867403606434e-05[/C][/ROW]
[ROW][C]40[/C][C]0.999999254780716[/C][C]1.49043856807607e-06[/C][C]7.45219284038036e-07[/C][/ROW]
[ROW][C]41[/C][C]0.999999448827775[/C][C]1.10234444987671e-06[/C][C]5.51172224938354e-07[/C][/ROW]
[ROW][C]42[/C][C]0.99999430893179[/C][C]1.13821364208502e-05[/C][C]5.69106821042508e-06[/C][/ROW]
[ROW][C]43[/C][C]0.999945164068434[/C][C]0.000109671863131805[/C][C]5.48359315659024e-05[/C][/ROW]
[ROW][C]44[/C][C]0.99974066293838[/C][C]0.000518674123238078[/C][C]0.000259337061619039[/C][/ROW]
[ROW][C]45[/C][C]0.998269509811303[/C][C]0.00346098037739302[/C][C]0.00173049018869651[/C][/ROW]
[/TABLE]
Source: https://freestatistics.org/blog/index.php?pk=111404&T=5

Globally Unique Identifier (entire table): ba.freestatistics.org/blog/index.php?pk=111404&T=5

As an alternative you can also use a QR Code:  

The GUIDs for individual cells are displayed in the table below:

Goldfeld-Quandt test for Heteroskedasticity
p-valuesAlternative Hypothesis
breakpoint indexgreater2-sidedless
160.0004441894070390940.0008883788140781890.999555810592961
175.49289896581173e-050.0001098579793162350.999945071010342
184.09720977349934e-068.19441954699869e-060.999995902790227
192.98475209221193e-075.96950418442387e-070.99999970152479
202.21183336164477e-084.42366672328955e-080.999999977881666
211.72462664061682e-083.44925328123364e-080.999999982753734
226.63149324278127e-061.32629864855625e-050.999993368506757
236.9397182390108e-050.0001387943647802160.99993060281761
240.0005871585612669590.001174317122533920.999412841438733
250.001311690170053600.002623380340107200.998688309829946
260.004391683244242990.008783366488485990.995608316755757
270.01651574911867530.03303149823735050.983484250881325
280.03105246024499280.06210492048998570.968947539755007
290.0889820149561120.1779640299122240.911017985043888
300.1899034832114990.3798069664229990.8100965167885
310.2387641423508380.4775282847016760.761235857649162
320.3095357350485030.6190714700970060.690464264951497
330.486065467283870.972130934567740.51393453271613
340.6808554420444220.6382891159111570.319144557955578
350.8512861827798290.2974276344403420.148713817220171
360.9480147820773670.1039704358452660.0519852179226331
370.9966276069315140.006744786136971540.00337239306848577
380.9999090260075410.0001819479849171489.09739924585739e-05
390.999983113259643.37734807212868e-051.68867403606434e-05
400.9999992547807161.49043856807607e-067.45219284038036e-07
410.9999994488277751.10234444987671e-065.51172224938354e-07
420.999994308931791.13821364208502e-055.69106821042508e-06
430.9999451640684340.0001096718631318055.48359315659024e-05
440.999740662938380.0005186741232380780.000259337061619039
450.9982695098113030.003460980377393020.00173049018869651


Meta Analysis of Goldfeld-Quandt test for Heteroskedasticity
Description# significant tests% significant testsOK/NOK
1% type I error level200.666666666666667NOK
5% type I error level210.7NOK
10% type I error level220.733333333333333NOK

\begin{tabular}{lllllllll}
\hline
Meta Analysis of Goldfeld-Quandt test for Heteroskedasticity \tabularnewline
Description & # significant tests & % significant tests & OK/NOK \tabularnewline
1% type I error level & 20 & 0.666666666666667 & NOK \tabularnewline
5% type I error level & 21 & 0.7 & NOK \tabularnewline
10% type I error level & 22 & 0.733333333333333 & NOK \tabularnewline
\hline
\end{tabular}
%Source: https://freestatistics.org/blog/index.php?pk=111404&T=6

[TABLE]
[ROW][C]Meta Analysis of Goldfeld-Quandt test for Heteroskedasticity[/C][/ROW]
[ROW][C]Description[/C][C]# significant tests[/C][C]% significant tests[/C][C]OK/NOK[/C][/ROW]
[ROW][C]1% type I error level[/C][C]20[/C][C]0.666666666666667[/C][C]NOK[/C][/ROW]
[ROW][C]5% type I error level[/C][C]21[/C][C]0.7[/C][C]NOK[/C][/ROW]
[ROW][C]10% type I error level[/C][C]22[/C][C]0.733333333333333[/C][C]NOK[/C][/ROW]
[/TABLE]
Source: https://freestatistics.org/blog/index.php?pk=111404&T=6

Globally Unique Identifier (entire table): ba.freestatistics.org/blog/index.php?pk=111404&T=6

As an alternative you can also use a QR Code:  

The GUIDs for individual cells are displayed in the table below:

Meta Analysis of Goldfeld-Quandt test for Heteroskedasticity
Description# significant tests% significant testsOK/NOK
1% type I error level200.666666666666667NOK
5% type I error level210.7NOK
10% type I error level220.733333333333333NOK


Parameters (Session):
par1 = 1 ; par2 = Include Monthly Dummies ; par3 = Linear Trend ;
Parameters (R input):
par1 = 1 ; par2 = Include Monthly Dummies ; par3 = Linear Trend ;
R code (references can be found in the software module):
library(lattice)
library(lmtest)
n25 <- 25 #minimum number of obs. for Goldfeld-Quandt test
par1 <- as.numeric(par1)
x <- t(y)
k <- length(x[1,])
n <- length(x[,1])
x1 <- cbind(x[,par1], x[,1:k!=par1])
mycolnames <- c(colnames(x)[par1], colnames(x)[1:k!=par1])
colnames(x1) <- mycolnames #colnames(x)[par1]
x <- x1
if (par3 == 'First Differences'){
x2 <- array(0, dim=c(n-1,k), dimnames=list(1:(n-1), paste('(1-B)',colnames(x),sep='')))
for (i in 1:n-1) {
for (j in 1:k) {
x2[i,j] <- x[i+1,j] - x[i,j]
}
}
x <- x2
}
if (par2 == 'Include Monthly Dummies'){
x2 <- array(0, dim=c(n,11), dimnames=list(1:n, paste('M', seq(1:11), sep ='')))
for (i in 1:11){
x2[seq(i,n,12),i] <- 1
}
x <- cbind(x, x2)
}
if (par2 == 'Include Quarterly Dummies'){
x2 <- array(0, dim=c(n,3), dimnames=list(1:n, paste('Q', seq(1:3), sep ='')))
for (i in 1:3){
x2[seq(i,n,4),i] <- 1
}
x <- cbind(x, x2)
}
k <- length(x[1,])
if (par3 == 'Linear Trend'){
x <- cbind(x, c(1:n))
colnames(x)[k+1] <- 't'
}
x
k <- length(x[1,])
df <- as.data.frame(x)
(mylm <- lm(df))
(mysum <- summary(mylm))
if (n > n25) {
kp3 <- k + 3
nmkm3 <- n - k - 3
gqarr <- array(NA, dim=c(nmkm3-kp3+1,3))
numgqtests <- 0
numsignificant1 <- 0
numsignificant5 <- 0
numsignificant10 <- 0
for (mypoint in kp3:nmkm3) {
j <- 0
numgqtests <- numgqtests + 1
for (myalt in c('greater', 'two.sided', 'less')) {
j <- j + 1
gqarr[mypoint-kp3+1,j] <- gqtest(mylm, point=mypoint, alternative=myalt)$p.value
}
if (gqarr[mypoint-kp3+1,2] < 0.01) numsignificant1 <- numsignificant1 + 1
if (gqarr[mypoint-kp3+1,2] < 0.05) numsignificant5 <- numsignificant5 + 1
if (gqarr[mypoint-kp3+1,2] < 0.10) numsignificant10 <- numsignificant10 + 1
}
gqarr
}
bitmap(file='test0.png')
plot(x[,1], type='l', main='Actuals and Interpolation', ylab='value of Actuals and Interpolation (dots)', xlab='time or index')
points(x[,1]-mysum$resid)
grid()
dev.off()
bitmap(file='test1.png')
plot(mysum$resid, type='b', pch=19, main='Residuals', ylab='value of Residuals', xlab='time or index')
grid()
dev.off()
bitmap(file='test2.png')
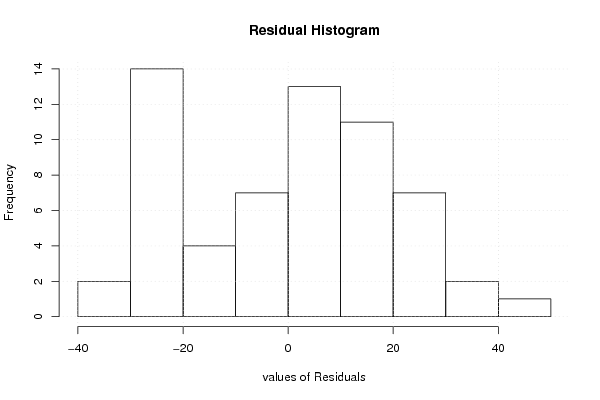
hist(mysum$resid, main='Residual Histogram', xlab='values of Residuals')
grid()
dev.off()
bitmap(file='test3.png')
densityplot(~mysum$resid,col='black',main='Residual Density Plot', xlab='values of Residuals')
dev.off()
bitmap(file='test4.png')
qqnorm(mysum$resid, main='Residual Normal Q-Q Plot')
qqline(mysum$resid)
grid()
dev.off()
(myerror <- as.ts(mysum$resid))
bitmap(file='test5.png')
dum <- cbind(lag(myerror,k=1),myerror)
dum
dum1 <- dum[2:length(myerror),]
dum1
z <- as.data.frame(dum1)
z
plot(z,main=paste('Residual Lag plot, lowess, and regression line'), ylab='values of Residuals', xlab='lagged values of Residuals')
lines(lowess(z))
abline(lm(z))
grid()
dev.off()
bitmap(file='test6.png')
acf(mysum$resid, lag.max=length(mysum$resid)/2, main='Residual Autocorrelation Function')
grid()
dev.off()
bitmap(file='test7.png')
pacf(mysum$resid, lag.max=length(mysum$resid)/2, main='Residual Partial Autocorrelation Function')
grid()
dev.off()
bitmap(file='test8.png')
opar <- par(mfrow = c(2,2), oma = c(0, 0, 1.1, 0))
plot(mylm, las = 1, sub='Residual Diagnostics')
par(opar)
dev.off()
if (n > n25) {
bitmap(file='test9.png')
plot(kp3:nmkm3,gqarr[,2], main='Goldfeld-Quandt test',ylab='2-sided p-value',xlab='breakpoint')
grid()
dev.off()
}
load(file='createtable')
a<-table.start()
a<-table.row.start(a)
a<-table.element(a, 'Multiple Linear Regression - Estimated Regression Equation', 1, TRUE)
a<-table.row.end(a)
myeq <- colnames(x)[1]
myeq <- paste(myeq, '[t] = ', sep='')
for (i in 1:k){
if (mysum$coefficients[i,1] > 0) myeq <- paste(myeq, '+', '')
myeq <- paste(myeq, mysum$coefficients[i,1], sep=' ')
if (rownames(mysum$coefficients)[i] != '(Intercept)') {
myeq <- paste(myeq, rownames(mysum$coefficients)[i], sep='')
if (rownames(mysum$coefficients)[i] != 't') myeq <- paste(myeq, '[t]', sep='')
}
}
myeq <- paste(myeq, ' + e[t]')
a<-table.row.start(a)
a<-table.element(a, myeq)
a<-table.row.end(a)
a<-table.end(a)
table.save(a,file='mytable1.tab')
a<-table.start()
a<-table.row.start(a)
a<-table.element(a,hyperlink('ols1.htm','Multiple Linear Regression - Ordinary Least Squares',''), 6, TRUE)
a<-table.row.end(a)
a<-table.row.start(a)
a<-table.element(a,'Variable',header=TRUE)
a<-table.element(a,'Parameter',header=TRUE)
a<-table.element(a,'S.D.',header=TRUE)
a<-table.element(a,'T-STAT
H0: parameter = 0',header=TRUE)
a<-table.element(a,'2-tail p-value',header=TRUE)
a<-table.element(a,'1-tail p-value',header=TRUE)
a<-table.row.end(a)
for (i in 1:k){
a<-table.row.start(a)
a<-table.element(a,rownames(mysum$coefficients)[i],header=TRUE)
a<-table.element(a,mysum$coefficients[i,1])
a<-table.element(a, round(mysum$coefficients[i,2],6))
a<-table.element(a, round(mysum$coefficients[i,3],4))
a<-table.element(a, round(mysum$coefficients[i,4],6))
a<-table.element(a, round(mysum$coefficients[i,4]/2,6))
a<-table.row.end(a)
}
a<-table.end(a)
table.save(a,file='mytable2.tab')
a<-table.start()
a<-table.row.start(a)
a<-table.element(a, 'Multiple Linear Regression - Regression Statistics', 2, TRUE)
a<-table.row.end(a)
a<-table.row.start(a)
a<-table.element(a, 'Multiple R',1,TRUE)
a<-table.element(a, sqrt(mysum$r.squared))
a<-table.row.end(a)
a<-table.row.start(a)
a<-table.element(a, 'R-squared',1,TRUE)
a<-table.element(a, mysum$r.squared)
a<-table.row.end(a)
a<-table.row.start(a)
a<-table.element(a, 'Adjusted R-squared',1,TRUE)
a<-table.element(a, mysum$adj.r.squared)
a<-table.row.end(a)
a<-table.row.start(a)
a<-table.element(a, 'F-TEST (value)',1,TRUE)
a<-table.element(a, mysum$fstatistic[1])
a<-table.row.end(a)
a<-table.row.start(a)
a<-table.element(a, 'F-TEST (DF numerator)',1,TRUE)
a<-table.element(a, mysum$fstatistic[2])
a<-table.row.end(a)
a<-table.row.start(a)
a<-table.element(a, 'F-TEST (DF denominator)',1,TRUE)
a<-table.element(a, mysum$fstatistic[3])
a<-table.row.end(a)
a<-table.row.start(a)
a<-table.element(a, 'p-value',1,TRUE)
a<-table.element(a, 1-pf(mysum$fstatistic[1],mysum$fstatistic[2],mysum$fstatistic[3]))
a<-table.row.end(a)
a<-table.row.start(a)
a<-table.element(a, 'Multiple Linear Regression - Residual Statistics', 2, TRUE)
a<-table.row.end(a)
a<-table.row.start(a)
a<-table.element(a, 'Residual Standard Deviation',1,TRUE)
a<-table.element(a, mysum$sigma)
a<-table.row.end(a)
a<-table.row.start(a)
a<-table.element(a, 'Sum Squared Residuals',1,TRUE)
a<-table.element(a, sum(myerror*myerror))
a<-table.row.end(a)
a<-table.end(a)
table.save(a,file='mytable3.tab')
a<-table.start()
a<-table.row.start(a)
a<-table.element(a, 'Multiple Linear Regression - Actuals, Interpolation, and Residuals', 4, TRUE)
a<-table.row.end(a)
a<-table.row.start(a)
a<-table.element(a, 'Time or Index', 1, TRUE)
a<-table.element(a, 'Actuals', 1, TRUE)
a<-table.element(a, 'Interpolation
Forecast', 1, TRUE)
a<-table.element(a, 'Residuals
Prediction Error', 1, TRUE)
a<-table.row.end(a)
for (i in 1:n) {
a<-table.row.start(a)
a<-table.element(a,i, 1, TRUE)
a<-table.element(a,x[i])
a<-table.element(a,x[i]-mysum$resid[i])
a<-table.element(a,mysum$resid[i])
a<-table.row.end(a)
}
a<-table.end(a)
table.save(a,file='mytable4.tab')
if (n > n25) {
a<-table.start()
a<-table.row.start(a)
a<-table.element(a,'Goldfeld-Quandt test for Heteroskedasticity',4,TRUE)
a<-table.row.end(a)
a<-table.row.start(a)
a<-table.element(a,'p-values',header=TRUE)
a<-table.element(a,'Alternative Hypothesis',3,header=TRUE)
a<-table.row.end(a)
a<-table.row.start(a)
a<-table.element(a,'breakpoint index',header=TRUE)
a<-table.element(a,'greater',header=TRUE)
a<-table.element(a,'2-sided',header=TRUE)
a<-table.element(a,'less',header=TRUE)
a<-table.row.end(a)
for (mypoint in kp3:nmkm3) {
a<-table.row.start(a)
a<-table.element(a,mypoint,header=TRUE)
a<-table.element(a,gqarr[mypoint-kp3+1,1])
a<-table.element(a,gqarr[mypoint-kp3+1,2])
a<-table.element(a,gqarr[mypoint-kp3+1,3])
a<-table.row.end(a)
}
a<-table.end(a)
table.save(a,file='mytable5.tab')
a<-table.start()
a<-table.row.start(a)
a<-table.element(a,'Meta Analysis of Goldfeld-Quandt test for Heteroskedasticity',4,TRUE)
a<-table.row.end(a)
a<-table.row.start(a)
a<-table.element(a,'Description',header=TRUE)
a<-table.element(a,'# significant tests',header=TRUE)
a<-table.element(a,'% significant tests',header=TRUE)
a<-table.element(a,'OK/NOK',header=TRUE)
a<-table.row.end(a)
a<-table.row.start(a)
a<-table.element(a,'1% type I error level',header=TRUE)
a<-table.element(a,numsignificant1)
a<-table.element(a,numsignificant1/numgqtests)
if (numsignificant1/numgqtests < 0.01) dum <- 'OK' else dum <- 'NOK'
a<-table.element(a,dum)
a<-table.row.end(a)
a<-table.row.start(a)
a<-table.element(a,'5% type I error level',header=TRUE)
a<-table.element(a,numsignificant5)
a<-table.element(a,numsignificant5/numgqtests)
if (numsignificant5/numgqtests < 0.05) dum <- 'OK' else dum <- 'NOK'
a<-table.element(a,dum)
a<-table.row.end(a)
a<-table.row.start(a)
a<-table.element(a,'10% type I error level',header=TRUE)
a<-table.element(a,numsignificant10)
a<-table.element(a,numsignificant10/numgqtests)
if (numsignificant10/numgqtests < 0.1) dum <- 'OK' else dum <- 'NOK'
a<-table.element(a,dum)
a<-table.row.end(a)
a<-table.end(a)
table.save(a,file='mytable6.tab')
}