| *The author of this computation has been verified* | ||||||||||||||||||||||||||
| R Software Module: /rwasp_edauni.wasp (opens new window with default values) | ||||||||||||||||||||||||||
| Title produced by software: Univariate Explorative Data Analysis | ||||||||||||||||||||||||||
| Date of computation: Wed, 15 Dec 2010 21:04:56 +0000 | ||||||||||||||||||||||||||
| Cite this page as follows: | ||||||||||||||||||||||||||
| Statistical Computations at FreeStatistics.org, Office for Research Development and Education, URL http://www.freestatistics.org/blog/date/2010/Dec/15/t12924471822wkt45q5wt3pqay.htm/, Retrieved Wed, 15 Dec 2010 22:06:24 +0100 | ||||||||||||||||||||||||||
| BibTeX entries for LaTeX users: | ||||||||||||||||||||||||||
@Manual{KEY,
    author = {{YOUR NAME}},
    publisher = {Office for Research Development and Education},
    title = {Statistical Computations at FreeStatistics.org, URL http://www.freestatistics.org/blog/date/2010/Dec/15/t12924471822wkt45q5wt3pqay.htm/},
    year = {2010},
}
@Manual{R,
    title = {R: A Language and Environment for Statistical Computing},
    author = {{R Development Core Team}},
    organization = {R Foundation for Statistical Computing},
    address = {Vienna, Austria},
    year = {2010},
    note = {{ISBN} 3-900051-07-0},
    url = {http://www.R-project.org},
}
| ||||||||||||||||||||||||||
| Original text written by user: | ||||||||||||||||||||||||||
| IsPrivate? | ||||||||||||||||||||||||||
| No (this computation is public) | ||||||||||||||||||||||||||
| User-defined keywords: | ||||||||||||||||||||||||||
| Dataseries X: | ||||||||||||||||||||||||||
| » Textbox « » Textfile « » CSV « | ||||||||||||||||||||||||||
| 160984 147727 165384 151202 135237 143684 150327 164909 154582 162221 165019 169673 150297 146944 156522 148536 126854 99485 135265 157406 153170 147381 136753 158421 173332 121795 123438 103478 115420 120867 120728 155286 172705 156418 148870 171422 173574 134051 123753 117862 94628 133387 147477 165077 150981 167026 169155 160271 170293 151312 160860 137556 106249 108464 121223 169114 155352 159722 166638 165920 212488 161262 168545 150959 114509 128341 180244 159268 149027 173723 166053 162952 151625 126219 152071 171245 144467 137722 198451 203411 174618 192387 171786 167966 181481 141108 164991 122032 144562 163153 183695 201470 166062 203959 194742 165450 190427 147520 166109 164804 176121 149173 170451 175412 166340 209292 176079 165432 193754 139788 158378 157995 165045 113321 162527 168683 164104 177656 150257 177723 185473 142068 130617 161522 195235 151377 177385 172286 15 etc... | ||||||||||||||||||||||||||
| Output produced by software: | ||||||||||||||||||||||||||
| ||||||||||||||||||||||||||
| Charts produced by software: | ||||||||||||||||||||||||||
| ||||||||||||||||||||||||||
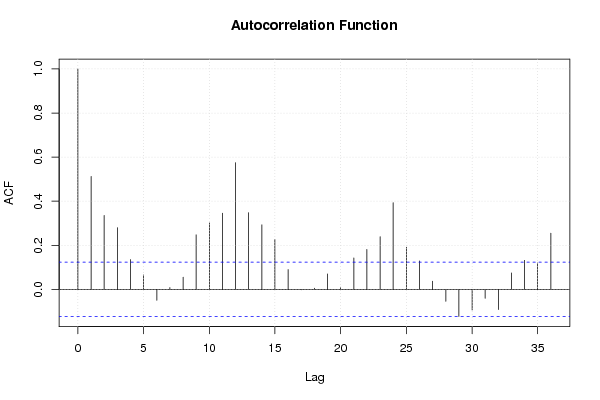
| Parameters (Session): | ||||||||||||||||||||||||||
| par1 = 0 ; par2 = 36 ; | ||||||||||||||||||||||||||
| Parameters (R input): | ||||||||||||||||||||||||||
| par1 = 0 ; par2 = 36 ; | ||||||||||||||||||||||||||
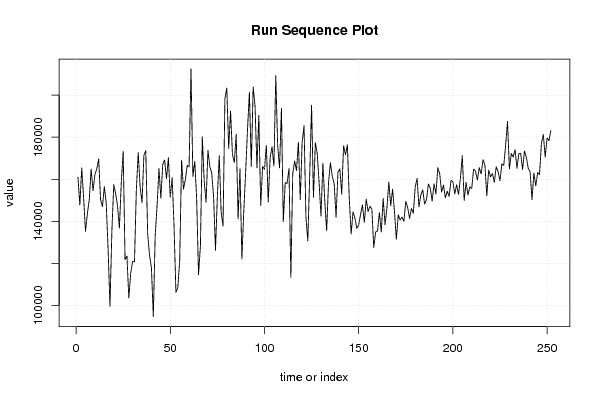
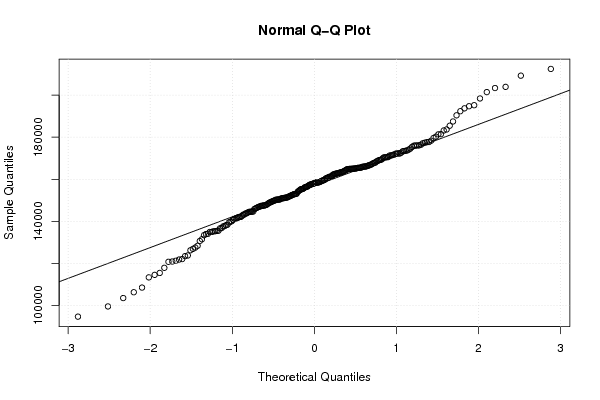
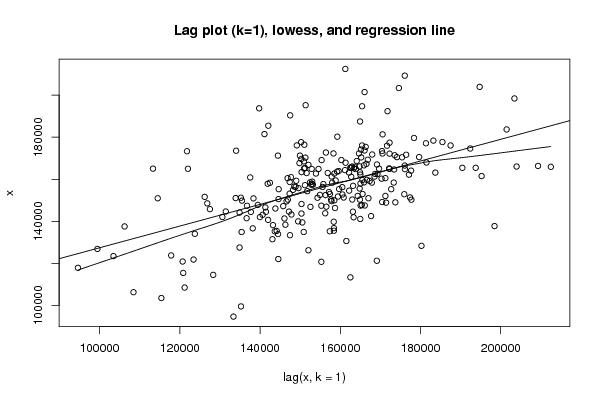
| R code (references can be found in the software module): | ||||||||||||||||||||||||||
| par1 <- as.numeric(par1)
par2 <- as.numeric(par2) x <- as.ts(x) library(lattice) bitmap(file='pic1.png') plot(x,type='l',main='Run Sequence Plot',xlab='time or index',ylab='value') grid() dev.off() bitmap(file='pic2.png') hist(x) grid() dev.off() bitmap(file='pic3.png') if (par1 > 0) { densityplot(~x,col='black',main=paste('Density Plot bw = ',par1),bw=par1) } else { densityplot(~x,col='black',main='Density Plot') } dev.off() bitmap(file='pic4.png') qqnorm(x) qqline(x) grid() dev.off() if (par2 > 0) { bitmap(file='lagplot1.png') dum <- cbind(lag(x,k=1),x) dum dum1 <- dum[2:length(x),] dum1 z <- as.data.frame(dum1) z plot(z,main='Lag plot (k=1), lowess, and regression line') lines(lowess(z)) abline(lm(z)) dev.off() if (par2 > 1) { bitmap(file='lagplotpar2.png') dum <- cbind(lag(x,k=par2),x) dum dum1 <- dum[(par2+1):length(x),] dum1 z <- as.data.frame(dum1) z mylagtitle <- 'Lag plot (k=' mylagtitle <- paste(mylagtitle,par2,sep='') mylagtitle <- paste(mylagtitle,'), and lowess',sep='') plot(z,main=mylagtitle) lines(lowess(z)) dev.off() } bitmap(file='pic5.png') acf(x,lag.max=par2,main='Autocorrelation Function') grid() dev.off() } summary(x) load(file='createtable') a<-table.start() a<-table.row.start(a) a<-table.element(a,'Descriptive Statistics',2,TRUE) a<-table.row.end(a) a<-table.row.start(a) a<-table.element(a,'# observations',header=TRUE) a<-table.element(a,length(x)) a<-table.row.end(a) a<-table.row.start(a) a<-table.element(a,'minimum',header=TRUE) a<-table.element(a,min(x)) a<-table.row.end(a) a<-table.row.start(a) a<-table.element(a,'Q1',header=TRUE) a<-table.element(a,quantile(x,0.25)) a<-table.row.end(a) a<-table.row.start(a) a<-table.element(a,'median',header=TRUE) a<-table.element(a,median(x)) a<-table.row.end(a) a<-table.row.start(a) a<-table.element(a,'mean',header=TRUE) a<-table.element(a,mean(x)) a<-table.row.end(a) a<-table.row.start(a) a<-table.element(a,'Q3',header=TRUE) a<-table.element(a,quantile(x,0.75)) a<-table.row.end(a) a<-table.row.start(a) a<-table.element(a,'maximum',header=TRUE) a<-table.element(a,max(x)) a<-table.row.end(a) a<-table.end(a) table.save(a,file='mytable.tab') | ||||||||||||||||||||||||||


Copyright

This work is licensed under a
Creative Commons Attribution-Noncommercial-Share Alike 3.0 License.
Software written by Ed van Stee & Patrick Wessa
Disclaimer
Information provided on this web site is provided "AS IS" without warranty of any kind, either express or implied, including, without limitation, warranties of merchantability, fitness for a particular purpose, and noninfringement. We use reasonable efforts to include accurate and timely information and periodically update the information, and software without notice. However, we make no warranties or representations as to the accuracy or completeness of such information (or software), and we assume no liability or responsibility for errors or omissions in the content of this web site, or any software bugs in online applications. Your use of this web site is AT YOUR OWN RISK. Under no circumstances and under no legal theory shall we be liable to you or any other person for any direct, indirect, special, incidental, exemplary, or consequential damages arising from your access to, or use of, this web site.
Privacy Policy
We may request personal information to be submitted to our servers in order to be able to:
- personalize online software applications according to your needs
- enforce strict security rules with respect to the data that you upload (e.g. statistical data)
- manage user sessions of online applications
- alert you about important changes or upgrades in resources or applications
We NEVER allow other companies to directly offer registered users information about their products and services. Banner references and hyperlinks of third parties NEVER contain any personal data of the visitor.
We do NOT sell, nor transmit by any means, personal information, nor statistical data series uploaded by you to third parties.
We carefully protect your data from loss, misuse, alteration,
and destruction. However, at any time, and under any circumstance you
are solely responsible for managing your passwords, and keeping them
secret.
We store a unique ANONYMOUS USER ID in the form of a small 'Cookie' on your computer. This allows us to track your progress when using this website which is necessary to create state-dependent features. The cookie is used for NO OTHER PURPOSE. At any time you may opt to disallow cookies from this website - this will not affect other features of this website.
We examine cookies that are used by third-parties (banner and online ads) very closely: abuse from third-parties automatically results in termination of the advertising contract without refund. We have very good reason to believe that the cookies that are produced by third parties (banner ads) do NOT cause any privacy or security risk.
FreeStatistics.org is safe. There is no need to download any software to use the applications and services contained in this website. Hence, your system's security is not compromised by their use, and your personal data - other than data you submit in the account application form, and the user-agent information that is transmitted by your browser - is never transmitted to our servers.
As a general rule, we do not log on-line behavior of individuals (other than normal logging of webserver 'hits'). However, in cases of abuse, hacking, unauthorized access, Denial of Service attacks, illegal copying, hotlinking, non-compliance with international webstandards (such as robots.txt), or any other harmful behavior, our system engineers are empowered to log, track, identify, publish, and ban misbehaving individuals - even if this leads to ban entire blocks of IP addresses, or disclosing user's identity.