\begin{tabular}{lllllllll}
\hline
Summary of computational transaction \tabularnewline
Raw Input & view raw input (R code)  \tabularnewline
Raw Output & view raw output of R engine  \tabularnewline
Computing time & 2 seconds \tabularnewline
R Server & 'RServer@AstonUniversity' @ vre.aston.ac.uk \tabularnewline
\hline
\end{tabular}
%Source: https://freestatistics.org/blog/index.php?pk=109075&T=0
[TABLE]
[ROW][C]Summary of computational transaction[/C][/ROW]
[ROW][C]Raw Input[/C][C]view raw input (R code) [/C][/ROW]
[ROW][C]Raw Output[/C][C]view raw output of R engine [/C][/ROW]
[ROW][C]Computing time[/C][C]2 seconds[/C][/ROW]
[ROW][C]R Server[/C][C]'RServer@AstonUniversity' @ vre.aston.ac.uk[/C][/ROW]
[/TABLE]
Source: https://freestatistics.org/blog/index.php?pk=109075&T=0
If you paste this QR Code into your document, anyone with a smartphone or tablet will be able to scan it and view this table in a browser.
If you paste this QR Code into your document, anyone with a smartphone or tablet will be able to scan it and view this table in a browser.
If you paste this QR Code into your document, anyone with a smartphone or tablet will be able to scan it and view this table in a browser.
If you paste this QR Code into your document, anyone with a smartphone or tablet will be able to scan it and view this table in a browser.
If you paste this QR Code into your document, anyone with a smartphone or tablet will be able to scan it and view this table in a browser.
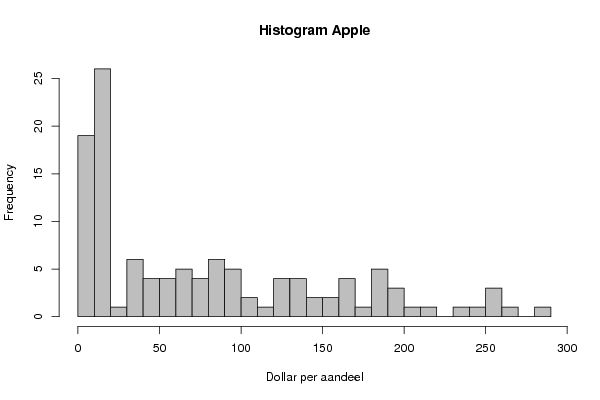
| Frequency Table (Histogram) | | Bins | Midpoint | Abs. Frequency | Rel. Frequency | Cumul. Rel. Freq. | Density | | [0,10[ | 5 | 19 | 0.162393 | 0.162393 | 0.016239 | | [10,20[ | 15 | 26 | 0.222222 | 0.384615 | 0.022222 | | [20,30[ | 25 | 1 | 0.008547 | 0.393162 | 0.000855 | | [30,40[ | 35 | 6 | 0.051282 | 0.444444 | 0.005128 | | [40,50[ | 45 | 4 | 0.034188 | 0.478632 | 0.003419 | | [50,60[ | 55 | 4 | 0.034188 | 0.512821 | 0.003419 | | [60,70[ | 65 | 5 | 0.042735 | 0.555556 | 0.004274 | | [70,80[ | 75 | 4 | 0.034188 | 0.589744 | 0.003419 | | [80,90[ | 85 | 6 | 0.051282 | 0.641026 | 0.005128 | | [90,100[ | 95 | 5 | 0.042735 | 0.683761 | 0.004274 | | [100,110[ | 105 | 2 | 0.017094 | 0.700855 | 0.001709 | | [110,120[ | 115 | 1 | 0.008547 | 0.709402 | 0.000855 | | [120,130[ | 125 | 4 | 0.034188 | 0.74359 | 0.003419 | | [130,140[ | 135 | 4 | 0.034188 | 0.777778 | 0.003419 | | [140,150[ | 145 | 2 | 0.017094 | 0.794872 | 0.001709 | | [150,160[ | 155 | 2 | 0.017094 | 0.811966 | 0.001709 | | [160,170[ | 165 | 4 | 0.034188 | 0.846154 | 0.003419 | | [170,180[ | 175 | 1 | 0.008547 | 0.854701 | 0.000855 | | [180,190[ | 185 | 5 | 0.042735 | 0.897436 | 0.004274 | | [190,200[ | 195 | 3 | 0.025641 | 0.923077 | 0.002564 | | [200,210[ | 205 | 1 | 0.008547 | 0.931624 | 0.000855 | | [210,220[ | 215 | 1 | 0.008547 | 0.940171 | 0.000855 | | [220,230[ | 225 | 0 | 0 | 0.940171 | 0 | | [230,240[ | 235 | 1 | 0.008547 | 0.948718 | 0.000855 | | [240,250[ | 245 | 1 | 0.008547 | 0.957265 | 0.000855 | | [250,260[ | 255 | 3 | 0.025641 | 0.982906 | 0.002564 | | [260,270[ | 265 | 1 | 0.008547 | 0.991453 | 0.000855 | | [270,280[ | 275 | 0 | 0 | 0.991453 | 0 | | [280,290] | 285 | 1 | 0.008547 | 1 | 0.000855 |
\begin{tabular}{lllllllll}
\hline
Frequency Table (Histogram) \tabularnewline
Bins & Midpoint & Abs. Frequency & Rel. Frequency & Cumul. Rel. Freq. & Density \tabularnewline
[0,10[ & 5 & 19 & 0.162393 & 0.162393 & 0.016239 \tabularnewline
[10,20[ & 15 & 26 & 0.222222 & 0.384615 & 0.022222 \tabularnewline
[20,30[ & 25 & 1 & 0.008547 & 0.393162 & 0.000855 \tabularnewline
[30,40[ & 35 & 6 & 0.051282 & 0.444444 & 0.005128 \tabularnewline
[40,50[ & 45 & 4 & 0.034188 & 0.478632 & 0.003419 \tabularnewline
[50,60[ & 55 & 4 & 0.034188 & 0.512821 & 0.003419 \tabularnewline
[60,70[ & 65 & 5 & 0.042735 & 0.555556 & 0.004274 \tabularnewline
[70,80[ & 75 & 4 & 0.034188 & 0.589744 & 0.003419 \tabularnewline
[80,90[ & 85 & 6 & 0.051282 & 0.641026 & 0.005128 \tabularnewline
[90,100[ & 95 & 5 & 0.042735 & 0.683761 & 0.004274 \tabularnewline
[100,110[ & 105 & 2 & 0.017094 & 0.700855 & 0.001709 \tabularnewline
[110,120[ & 115 & 1 & 0.008547 & 0.709402 & 0.000855 \tabularnewline
[120,130[ & 125 & 4 & 0.034188 & 0.74359 & 0.003419 \tabularnewline
[130,140[ & 135 & 4 & 0.034188 & 0.777778 & 0.003419 \tabularnewline
[140,150[ & 145 & 2 & 0.017094 & 0.794872 & 0.001709 \tabularnewline
[150,160[ & 155 & 2 & 0.017094 & 0.811966 & 0.001709 \tabularnewline
[160,170[ & 165 & 4 & 0.034188 & 0.846154 & 0.003419 \tabularnewline
[170,180[ & 175 & 1 & 0.008547 & 0.854701 & 0.000855 \tabularnewline
[180,190[ & 185 & 5 & 0.042735 & 0.897436 & 0.004274 \tabularnewline
[190,200[ & 195 & 3 & 0.025641 & 0.923077 & 0.002564 \tabularnewline
[200,210[ & 205 & 1 & 0.008547 & 0.931624 & 0.000855 \tabularnewline
[210,220[ & 215 & 1 & 0.008547 & 0.940171 & 0.000855 \tabularnewline
[220,230[ & 225 & 0 & 0 & 0.940171 & 0 \tabularnewline
[230,240[ & 235 & 1 & 0.008547 & 0.948718 & 0.000855 \tabularnewline
[240,250[ & 245 & 1 & 0.008547 & 0.957265 & 0.000855 \tabularnewline
[250,260[ & 255 & 3 & 0.025641 & 0.982906 & 0.002564 \tabularnewline
[260,270[ & 265 & 1 & 0.008547 & 0.991453 & 0.000855 \tabularnewline
[270,280[ & 275 & 0 & 0 & 0.991453 & 0 \tabularnewline
[280,290] & 285 & 1 & 0.008547 & 1 & 0.000855 \tabularnewline
\hline
\end{tabular}
%Source: https://freestatistics.org/blog/index.php?pk=109075&T=1
[TABLE]
[ROW][C]Frequency Table (Histogram)[/C][/ROW]
[ROW][C]Bins[/C][C]Midpoint[/C][C]Abs. Frequency[/C][C]Rel. Frequency[/C][C]Cumul. Rel. Freq.[/C][C]Density[/C][/ROW]
[ROW][C][0,10[[/C][C]5[/C][C]19[/C][C]0.162393[/C][C]0.162393[/C][C]0.016239[/C][/ROW]
[ROW][C][10,20[[/C][C]15[/C][C]26[/C][C]0.222222[/C][C]0.384615[/C][C]0.022222[/C][/ROW]
[ROW][C][20,30[[/C][C]25[/C][C]1[/C][C]0.008547[/C][C]0.393162[/C][C]0.000855[/C][/ROW]
[ROW][C][30,40[[/C][C]35[/C][C]6[/C][C]0.051282[/C][C]0.444444[/C][C]0.005128[/C][/ROW]
[ROW][C][40,50[[/C][C]45[/C][C]4[/C][C]0.034188[/C][C]0.478632[/C][C]0.003419[/C][/ROW]
[ROW][C][50,60[[/C][C]55[/C][C]4[/C][C]0.034188[/C][C]0.512821[/C][C]0.003419[/C][/ROW]
[ROW][C][60,70[[/C][C]65[/C][C]5[/C][C]0.042735[/C][C]0.555556[/C][C]0.004274[/C][/ROW]
[ROW][C][70,80[[/C][C]75[/C][C]4[/C][C]0.034188[/C][C]0.589744[/C][C]0.003419[/C][/ROW]
[ROW][C][80,90[[/C][C]85[/C][C]6[/C][C]0.051282[/C][C]0.641026[/C][C]0.005128[/C][/ROW]
[ROW][C][90,100[[/C][C]95[/C][C]5[/C][C]0.042735[/C][C]0.683761[/C][C]0.004274[/C][/ROW]
[ROW][C][100,110[[/C][C]105[/C][C]2[/C][C]0.017094[/C][C]0.700855[/C][C]0.001709[/C][/ROW]
[ROW][C][110,120[[/C][C]115[/C][C]1[/C][C]0.008547[/C][C]0.709402[/C][C]0.000855[/C][/ROW]
[ROW][C][120,130[[/C][C]125[/C][C]4[/C][C]0.034188[/C][C]0.74359[/C][C]0.003419[/C][/ROW]
[ROW][C][130,140[[/C][C]135[/C][C]4[/C][C]0.034188[/C][C]0.777778[/C][C]0.003419[/C][/ROW]
[ROW][C][140,150[[/C][C]145[/C][C]2[/C][C]0.017094[/C][C]0.794872[/C][C]0.001709[/C][/ROW]
[ROW][C][150,160[[/C][C]155[/C][C]2[/C][C]0.017094[/C][C]0.811966[/C][C]0.001709[/C][/ROW]
[ROW][C][160,170[[/C][C]165[/C][C]4[/C][C]0.034188[/C][C]0.846154[/C][C]0.003419[/C][/ROW]
[ROW][C][170,180[[/C][C]175[/C][C]1[/C][C]0.008547[/C][C]0.854701[/C][C]0.000855[/C][/ROW]
[ROW][C][180,190[[/C][C]185[/C][C]5[/C][C]0.042735[/C][C]0.897436[/C][C]0.004274[/C][/ROW]
[ROW][C][190,200[[/C][C]195[/C][C]3[/C][C]0.025641[/C][C]0.923077[/C][C]0.002564[/C][/ROW]
[ROW][C][200,210[[/C][C]205[/C][C]1[/C][C]0.008547[/C][C]0.931624[/C][C]0.000855[/C][/ROW]
[ROW][C][210,220[[/C][C]215[/C][C]1[/C][C]0.008547[/C][C]0.940171[/C][C]0.000855[/C][/ROW]
[ROW][C][220,230[[/C][C]225[/C][C]0[/C][C]0[/C][C]0.940171[/C][C]0[/C][/ROW]
[ROW][C][230,240[[/C][C]235[/C][C]1[/C][C]0.008547[/C][C]0.948718[/C][C]0.000855[/C][/ROW]
[ROW][C][240,250[[/C][C]245[/C][C]1[/C][C]0.008547[/C][C]0.957265[/C][C]0.000855[/C][/ROW]
[ROW][C][250,260[[/C][C]255[/C][C]3[/C][C]0.025641[/C][C]0.982906[/C][C]0.002564[/C][/ROW]
[ROW][C][260,270[[/C][C]265[/C][C]1[/C][C]0.008547[/C][C]0.991453[/C][C]0.000855[/C][/ROW]
[ROW][C][270,280[[/C][C]275[/C][C]0[/C][C]0[/C][C]0.991453[/C][C]0[/C][/ROW]
[ROW][C][280,290][/C][C]285[/C][C]1[/C][C]0.008547[/C][C]1[/C][C]0.000855[/C][/ROW]
[/TABLE]
Source: https://freestatistics.org/blog/index.php?pk=109075&T=1
Globally Unique Identifier (entire table): ba.freestatistics.org/blog/index.php?pk=109075&T=1
As an alternative you can also use a QR Code:
The GUIDs for individual cells are displayed in the table below:
| Frequency Table (Histogram) | | Bins | Midpoint | Abs. Frequency | Rel. Frequency | Cumul. Rel. Freq. | Density | | [0,10[ | 5 | 19 | 0.162393 | 0.162393 | 0.016239 | | [10,20[ | 15 | 26 | 0.222222 | 0.384615 | 0.022222 | | [20,30[ | 25 | 1 | 0.008547 | 0.393162 | 0.000855 | | [30,40[ | 35 | 6 | 0.051282 | 0.444444 | 0.005128 | | [40,50[ | 45 | 4 | 0.034188 | 0.478632 | 0.003419 | | [50,60[ | 55 | 4 | 0.034188 | 0.512821 | 0.003419 | | [60,70[ | 65 | 5 | 0.042735 | 0.555556 | 0.004274 | | [70,80[ | 75 | 4 | 0.034188 | 0.589744 | 0.003419 | | [80,90[ | 85 | 6 | 0.051282 | 0.641026 | 0.005128 | | [90,100[ | 95 | 5 | 0.042735 | 0.683761 | 0.004274 | | [100,110[ | 105 | 2 | 0.017094 | 0.700855 | 0.001709 | | [110,120[ | 115 | 1 | 0.008547 | 0.709402 | 0.000855 | | [120,130[ | 125 | 4 | 0.034188 | 0.74359 | 0.003419 | | [130,140[ | 135 | 4 | 0.034188 | 0.777778 | 0.003419 | | [140,150[ | 145 | 2 | 0.017094 | 0.794872 | 0.001709 | | [150,160[ | 155 | 2 | 0.017094 | 0.811966 | 0.001709 | | [160,170[ | 165 | 4 | 0.034188 | 0.846154 | 0.003419 | | [170,180[ | 175 | 1 | 0.008547 | 0.854701 | 0.000855 | | [180,190[ | 185 | 5 | 0.042735 | 0.897436 | 0.004274 | | [190,200[ | 195 | 3 | 0.025641 | 0.923077 | 0.002564 | | [200,210[ | 205 | 1 | 0.008547 | 0.931624 | 0.000855 | | [210,220[ | 215 | 1 | 0.008547 | 0.940171 | 0.000855 | | [220,230[ | 225 | 0 | 0 | 0.940171 | 0 | | [230,240[ | 235 | 1 | 0.008547 | 0.948718 | 0.000855 | | [240,250[ | 245 | 1 | 0.008547 | 0.957265 | 0.000855 | | [250,260[ | 255 | 3 | 0.025641 | 0.982906 | 0.002564 | | [260,270[ | 265 | 1 | 0.008547 | 0.991453 | 0.000855 | | [270,280[ | 275 | 0 | 0 | 0.991453 | 0 | | [280,290] | 285 | 1 | 0.008547 | 1 | 0.000855 |
If you paste this QR Code into your document, anyone with a smartphone or tablet will be able to scan it and view this table in a browser.
If you paste this QR Code into your document, anyone with a smartphone or tablet will be able to scan it and view this table in a browser.
If you paste this QR Code into your document, anyone with a smartphone or tablet will be able to scan it and view this table in a browser.
If you paste this QR Code into your document, anyone with a smartphone or tablet will be able to scan it and view this table in a browser.
If you paste this QR Code into your document, anyone with a smartphone or tablet will be able to scan it and view this table in a browser.
|