Free Statistics
of Irreproducible Research!
Description of Statistical Computation | |||||||||||||||||||||||||||||||||||||||||||||||||||||
|---|---|---|---|---|---|---|---|---|---|---|---|---|---|---|---|---|---|---|---|---|---|---|---|---|---|---|---|---|---|---|---|---|---|---|---|---|---|---|---|---|---|---|---|---|---|---|---|---|---|---|---|---|---|
| Author's title | |||||||||||||||||||||||||||||||||||||||||||||||||||||
| Author | *The author of this computation has been verified* | ||||||||||||||||||||||||||||||||||||||||||||||||||||
| R Software Module | rwasp_bidataseries.wasp | ||||||||||||||||||||||||||||||||||||||||||||||||||||
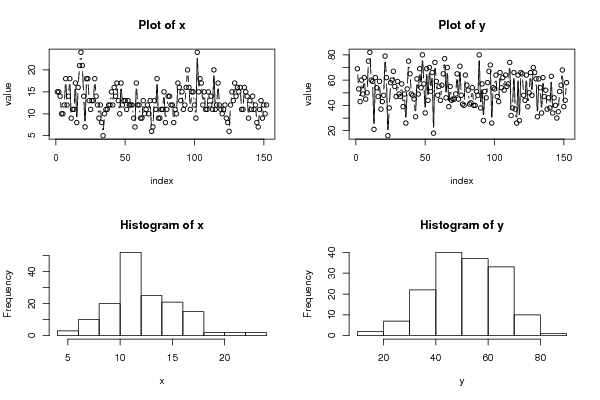
| Title produced by software | Bivariate Data Series | ||||||||||||||||||||||||||||||||||||||||||||||||||||
| Date of computation | Sat, 11 Dec 2010 11:03:56 +0000 | ||||||||||||||||||||||||||||||||||||||||||||||||||||
| Cite this page as follows | Statistical Computations at FreeStatistics.org, Office for Research Development and Education, URL https://freestatistics.org/blog/index.php?v=date/2010/Dec/11/t1292065395r399azshnnk6lil.htm/, Retrieved Sun, 19 Oct 2025 19:41:16 +0000 | ||||||||||||||||||||||||||||||||||||||||||||||||||||
| Statistical Computations at FreeStatistics.org, Office for Research Development and Education, URL https://freestatistics.org/blog/index.php?pk=108059, Retrieved Sun, 19 Oct 2025 19:41:16 +0000 | |||||||||||||||||||||||||||||||||||||||||||||||||||||
| QR Codes: | |||||||||||||||||||||||||||||||||||||||||||||||||||||
|
| |||||||||||||||||||||||||||||||||||||||||||||||||||||
| Original text written by user: | |||||||||||||||||||||||||||||||||||||||||||||||||||||
| IsPrivate? | No (this computation is public) | ||||||||||||||||||||||||||||||||||||||||||||||||||||
| User-defined keywords | |||||||||||||||||||||||||||||||||||||||||||||||||||||
| Estimated Impact | 280 | ||||||||||||||||||||||||||||||||||||||||||||||||||||
Tree of Dependent Computations | |||||||||||||||||||||||||||||||||||||||||||||||||||||
| Family? (F = Feedback message, R = changed R code, M = changed R Module, P = changed Parameters, D = changed Data) | |||||||||||||||||||||||||||||||||||||||||||||||||||||
| - [Bivariate Data Series] [Bivariate dataset] [2008-01-05 23:51:08] [74be16979710d4c4e7c6647856088456] - MPD [Bivariate Data Series] [Schermbreedte en ...] [2010-11-11 17:54:48] [6bc4f9343b7ea3ef5a59412d1f72bb2b] - PD [Bivariate Data Series] [Mini-tutorial His...] [2010-11-14 21:03:13] [6ca0fc48dd5333d51a15728999009c83] - PD [Bivariate Data Series] [Density plot X] [2010-12-11 11:03:56] [b4ba846736d082ffaee409a197f454c7] [Current] | |||||||||||||||||||||||||||||||||||||||||||||||||||||
| Feedback Forum | |||||||||||||||||||||||||||||||||||||||||||||||||||||
Post a new message | |||||||||||||||||||||||||||||||||||||||||||||||||||||
Dataset | |||||||||||||||||||||||||||||||||||||||||||||||||||||
| Dataseries X: | |||||||||||||||||||||||||||||||||||||||||||||||||||||
15 15 14 10 10 12 18 12 14 18 9 11 11 17 8 16 21 24 21 14 7 18 18 13 11 13 13 18 14 12 9 12 8 5 10 11 11 12 12 15 12 16 14 17 13 10 17 12 13 13 11 13 12 12 12 9 7 17 12 12 9 9 13 10 11 12 10 13 6 7 13 11 18 9 9 11 11 15 8 11 14 14 12 12 8 11 10 17 16 13 15 11 12 16 20 16 11 15 15 12 9 24 15 18 17 12 15 11 11 15 12 14 11 20 11 12 17 12 11 10 11 12 9 8 6 12 15 13 17 14 16 15 16 11 11 16 15 14 9 13 11 14 11 12 8 7 11 13 9 12 10 12 | |||||||||||||||||||||||||||||||||||||||||||||||||||||
| Dataseries Y: | |||||||||||||||||||||||||||||||||||||||||||||||||||||
69 53 43 60 49 62 45 50 75 82 60 59 21 62 54 47 59 37 43 48 79 62 16 38 58 60 67 55 47 59 49 47 57 39 49 26 53 75 65 49 48 45 31 61 49 69 54 80 57 34 69 44 70 51 66 18 74 59 48 55 44 56 65 77 46 70 39 55 44 45 45 49 65 45 71 48 41 40 64 56 52 41 42 54 40 40 51 48 80 38 57 28 51 46 58 67 72 26 54 53 64 47 43 66 54 62 52 64 55 57 74 32 38 66 37 26 64 28 66 65 48 44 64 39 50 66 48 70 66 61 31 61 54 34 62 47 52 37 46 38 63 34 46 40 30 35 51 56 68 39 44 58 | |||||||||||||||||||||||||||||||||||||||||||||||||||||
Tables (Output of Computation) | |||||||||||||||||||||||||||||||||||||||||||||||||||||
| |||||||||||||||||||||||||||||||||||||||||||||||||||||
Figures (Output of Computation) | |||||||||||||||||||||||||||||||||||||||||||||||||||||
Input Parameters & R Code | |||||||||||||||||||||||||||||||||||||||||||||||||||||
| Parameters (Session): | |||||||||||||||||||||||||||||||||||||||||||||||||||||
| par1 = Verwachtingen ouders ; par3 = Verachtingen ouders ; par4 = Angst studenten ; par6 = Angst studenten ; | |||||||||||||||||||||||||||||||||||||||||||||||||||||
| Parameters (R input): | |||||||||||||||||||||||||||||||||||||||||||||||||||||
| par1 = Verwachtingen ouders ; par2 = ; par3 = Verachtingen ouders ; par4 = Angst studenten ; par5 = ; par6 = Angst studenten ; | |||||||||||||||||||||||||||||||||||||||||||||||||||||
| R code (references can be found in the software module): | |||||||||||||||||||||||||||||||||||||||||||||||||||||
bitmap(file='test1.png') | |||||||||||||||||||||||||||||||||||||||||||||||||||||