| *The author of this computation has been verified* | ||||||||||||||||||||||||||||||||||||||||||||||||||||||||||||||||||||||||||||||||||||||||||||||||||||||||||||||||||||||||||||||||||||||||||||||||||||||||||||||||||||||||||||||||||||||||||||||||||||||||||||||||||||||||||||||||||||||||||||||||||||||||||||||||||||||||||||||||||||||||||||||||||||||||||||||||||||||||||
| R Software Module: /rwasp_regression_trees1.wasp (opens new window with default values) | ||||||||||||||||||||||||||||||||||||||||||||||||||||||||||||||||||||||||||||||||||||||||||||||||||||||||||||||||||||||||||||||||||||||||||||||||||||||||||||||||||||||||||||||||||||||||||||||||||||||||||||||||||||||||||||||||||||||||||||||||||||||||||||||||||||||||||||||||||||||||||||||||||||||||||||||||||||||||||
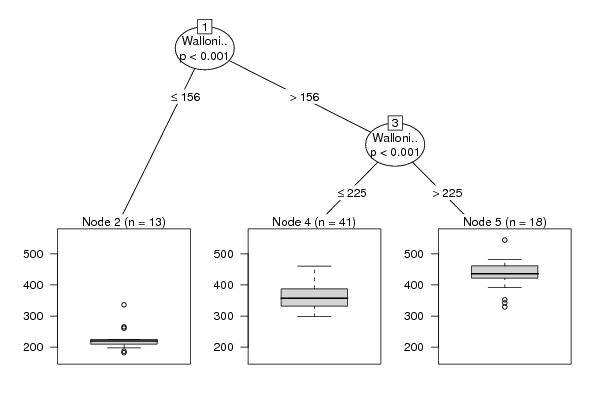
| Title produced by software: Recursive Partitioning (Regression Trees) | ||||||||||||||||||||||||||||||||||||||||||||||||||||||||||||||||||||||||||||||||||||||||||||||||||||||||||||||||||||||||||||||||||||||||||||||||||||||||||||||||||||||||||||||||||||||||||||||||||||||||||||||||||||||||||||||||||||||||||||||||||||||||||||||||||||||||||||||||||||||||||||||||||||||||||||||||||||||||||
| Date of computation: Fri, 10 Dec 2010 13:21:51 +0000 | ||||||||||||||||||||||||||||||||||||||||||||||||||||||||||||||||||||||||||||||||||||||||||||||||||||||||||||||||||||||||||||||||||||||||||||||||||||||||||||||||||||||||||||||||||||||||||||||||||||||||||||||||||||||||||||||||||||||||||||||||||||||||||||||||||||||||||||||||||||||||||||||||||||||||||||||||||||||||||
| Cite this page as follows: | ||||||||||||||||||||||||||||||||||||||||||||||||||||||||||||||||||||||||||||||||||||||||||||||||||||||||||||||||||||||||||||||||||||||||||||||||||||||||||||||||||||||||||||||||||||||||||||||||||||||||||||||||||||||||||||||||||||||||||||||||||||||||||||||||||||||||||||||||||||||||||||||||||||||||||||||||||||||||||
| Statistical Computations at FreeStatistics.org, Office for Research Development and Education, URL http://www.freestatistics.org/blog/date/2010/Dec/10/t1291987230c3tx596vhimzrye.htm/, Retrieved Fri, 10 Dec 2010 14:20:33 +0100 | ||||||||||||||||||||||||||||||||||||||||||||||||||||||||||||||||||||||||||||||||||||||||||||||||||||||||||||||||||||||||||||||||||||||||||||||||||||||||||||||||||||||||||||||||||||||||||||||||||||||||||||||||||||||||||||||||||||||||||||||||||||||||||||||||||||||||||||||||||||||||||||||||||||||||||||||||||||||||||
| BibTeX entries for LaTeX users: | ||||||||||||||||||||||||||||||||||||||||||||||||||||||||||||||||||||||||||||||||||||||||||||||||||||||||||||||||||||||||||||||||||||||||||||||||||||||||||||||||||||||||||||||||||||||||||||||||||||||||||||||||||||||||||||||||||||||||||||||||||||||||||||||||||||||||||||||||||||||||||||||||||||||||||||||||||||||||||
@Manual{KEY,
    author = {{YOUR NAME}},
    publisher = {Office for Research Development and Education},
    title = {Statistical Computations at FreeStatistics.org, URL http://www.freestatistics.org/blog/date/2010/Dec/10/t1291987230c3tx596vhimzrye.htm/},
    year = {2010},
}
@Manual{R,
    title = {R: A Language and Environment for Statistical Computing},
    author = {{R Development Core Team}},
    organization = {R Foundation for Statistical Computing},
    address = {Vienna, Austria},
    year = {2010},
    note = {{ISBN} 3-900051-07-0},
    url = {http://www.R-project.org},
}
| ||||||||||||||||||||||||||||||||||||||||||||||||||||||||||||||||||||||||||||||||||||||||||||||||||||||||||||||||||||||||||||||||||||||||||||||||||||||||||||||||||||||||||||||||||||||||||||||||||||||||||||||||||||||||||||||||||||||||||||||||||||||||||||||||||||||||||||||||||||||||||||||||||||||||||||||||||||||||||
| Original text written by user: | ||||||||||||||||||||||||||||||||||||||||||||||||||||||||||||||||||||||||||||||||||||||||||||||||||||||||||||||||||||||||||||||||||||||||||||||||||||||||||||||||||||||||||||||||||||||||||||||||||||||||||||||||||||||||||||||||||||||||||||||||||||||||||||||||||||||||||||||||||||||||||||||||||||||||||||||||||||||||||
| IsPrivate? | ||||||||||||||||||||||||||||||||||||||||||||||||||||||||||||||||||||||||||||||||||||||||||||||||||||||||||||||||||||||||||||||||||||||||||||||||||||||||||||||||||||||||||||||||||||||||||||||||||||||||||||||||||||||||||||||||||||||||||||||||||||||||||||||||||||||||||||||||||||||||||||||||||||||||||||||||||||||||||
| No (this computation is public) | ||||||||||||||||||||||||||||||||||||||||||||||||||||||||||||||||||||||||||||||||||||||||||||||||||||||||||||||||||||||||||||||||||||||||||||||||||||||||||||||||||||||||||||||||||||||||||||||||||||||||||||||||||||||||||||||||||||||||||||||||||||||||||||||||||||||||||||||||||||||||||||||||||||||||||||||||||||||||||
| User-defined keywords: | ||||||||||||||||||||||||||||||||||||||||||||||||||||||||||||||||||||||||||||||||||||||||||||||||||||||||||||||||||||||||||||||||||||||||||||||||||||||||||||||||||||||||||||||||||||||||||||||||||||||||||||||||||||||||||||||||||||||||||||||||||||||||||||||||||||||||||||||||||||||||||||||||||||||||||||||||||||||||||
| Dataseries X: | ||||||||||||||||||||||||||||||||||||||||||||||||||||||||||||||||||||||||||||||||||||||||||||||||||||||||||||||||||||||||||||||||||||||||||||||||||||||||||||||||||||||||||||||||||||||||||||||||||||||||||||||||||||||||||||||||||||||||||||||||||||||||||||||||||||||||||||||||||||||||||||||||||||||||||||||||||||||||||
| » Textbox « » Textfile « » CSV « | ||||||||||||||||||||||||||||||||||||||||||||||||||||||||||||||||||||||||||||||||||||||||||||||||||||||||||||||||||||||||||||||||||||||||||||||||||||||||||||||||||||||||||||||||||||||||||||||||||||||||||||||||||||||||||||||||||||||||||||||||||||||||||||||||||||||||||||||||||||||||||||||||||||||||||||||||||||||||||
| 356 182 89 386 213 97 444 227 154 387 209 81 327 219 110 448 221 116 225 114 73 182 97 73 460 205 174 411 215 103 342 224 130 361 189 91 377 182 136 331 201 106 428 198 136 340 173 122 352 238 131 461 258 135 221 122 75 198 101 68 422 259 143 329 243 115 320 188 93 375 173 128 364 224 152 351 215 125 380 196 107 319 159 116 322 187 220 386 208 137 221 131 34 187 93 51 344 210 153 342 228 145 365 176 116 313 195 145 356 188 98 337 188 118 389 190 139 326 188 140 343 176 113 357 225 149 220 93 79 218 79 47 391 235 166 425 247 180 332 195 122 298 197 134 360 211 114 336 156 125 325 209 181 393 180 142 301 185 143 426 303 187 265 129 137 210 85 62 429 249 239 440 231 157 357 212 139 431 240 187 442 234 99 442 217 146 544 287 175 420 221 148 396 208 130 482 241 183 261 156 115 211 96 80 448 320 223 468 242 131 464 227 201 425 200 157 | ||||||||||||||||||||||||||||||||||||||||||||||||||||||||||||||||||||||||||||||||||||||||||||||||||||||||||||||||||||||||||||||||||||||||||||||||||||||||||||||||||||||||||||||||||||||||||||||||||||||||||||||||||||||||||||||||||||||||||||||||||||||||||||||||||||||||||||||||||||||||||||||||||||||||||||||||||||||||||
| Output produced by software: | ||||||||||||||||||||||||||||||||||||||||||||||||||||||||||||||||||||||||||||||||||||||||||||||||||||||||||||||||||||||||||||||||||||||||||||||||||||||||||||||||||||||||||||||||||||||||||||||||||||||||||||||||||||||||||||||||||||||||||||||||||||||||||||||||||||||||||||||||||||||||||||||||||||||||||||||||||||||||||
Enter (or paste) a matrix (table) containing all data (time) series. Every column represents a different variable and must be delimited by a space or Tab. Every row represents a period in time (or category) and must be delimited by hard returns. The easiest way to enter data is to copy and paste a block of spreadsheet cells. Please, do not use commas or spaces to seperate groups of digits!
| ||||||||||||||||||||||||||||||||||||||||||||||||||||||||||||||||||||||||||||||||||||||||||||||||||||||||||||||||||||||||||||||||||||||||||||||||||||||||||||||||||||||||||||||||||||||||||||||||||||||||||||||||||||||||||||||||||||||||||||||||||||||||||||||||||||||||||||||||||||||||||||||||||||||||||||||||||||||||||
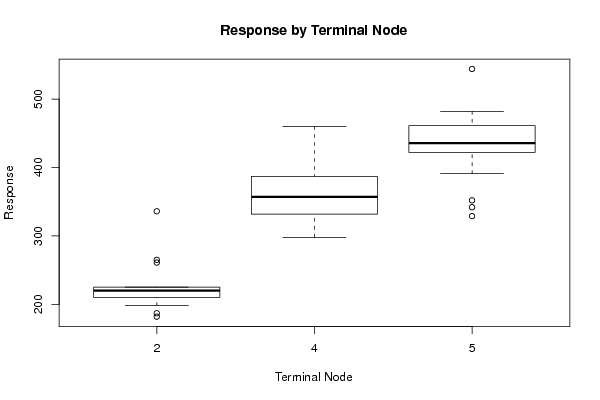
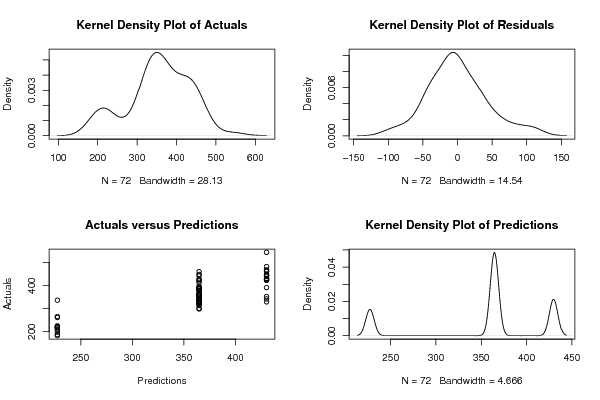
| Charts produced by software: | ||||||||||||||||||||||||||||||||||||||||||||||||||||||||||||||||||||||||||||||||||||||||||||||||||||||||||||||||||||||||||||||||||||||||||||||||||||||||||||||||||||||||||||||||||||||||||||||||||||||||||||||||||||||||||||||||||||||||||||||||||||||||||||||||||||||||||||||||||||||||||||||||||||||||||||||||||||||||||
| ||||||||||||||||||||||||||||||||||||||||||||||||||||||||||||||||||||||||||||||||||||||||||||||||||||||||||||||||||||||||||||||||||||||||||||||||||||||||||||||||||||||||||||||||||||||||||||||||||||||||||||||||||||||||||||||||||||||||||||||||||||||||||||||||||||||||||||||||||||||||||||||||||||||||||||||||||||||||||
| Parameters (Session): | ||||||||||||||||||||||||||||||||||||||||||||||||||||||||||||||||||||||||||||||||||||||||||||||||||||||||||||||||||||||||||||||||||||||||||||||||||||||||||||||||||||||||||||||||||||||||||||||||||||||||||||||||||||||||||||||||||||||||||||||||||||||||||||||||||||||||||||||||||||||||||||||||||||||||||||||||||||||||||
| par1 = 1 ; par2 = none ; par3 = 3 ; par4 = no ; | ||||||||||||||||||||||||||||||||||||||||||||||||||||||||||||||||||||||||||||||||||||||||||||||||||||||||||||||||||||||||||||||||||||||||||||||||||||||||||||||||||||||||||||||||||||||||||||||||||||||||||||||||||||||||||||||||||||||||||||||||||||||||||||||||||||||||||||||||||||||||||||||||||||||||||||||||||||||||||
| Parameters (R input): | ||||||||||||||||||||||||||||||||||||||||||||||||||||||||||||||||||||||||||||||||||||||||||||||||||||||||||||||||||||||||||||||||||||||||||||||||||||||||||||||||||||||||||||||||||||||||||||||||||||||||||||||||||||||||||||||||||||||||||||||||||||||||||||||||||||||||||||||||||||||||||||||||||||||||||||||||||||||||||
| par1 = 1 ; par2 = none ; par3 = 3 ; par4 = no ; | ||||||||||||||||||||||||||||||||||||||||||||||||||||||||||||||||||||||||||||||||||||||||||||||||||||||||||||||||||||||||||||||||||||||||||||||||||||||||||||||||||||||||||||||||||||||||||||||||||||||||||||||||||||||||||||||||||||||||||||||||||||||||||||||||||||||||||||||||||||||||||||||||||||||||||||||||||||||||||
| R code (references can be found in the software module): | ||||||||||||||||||||||||||||||||||||||||||||||||||||||||||||||||||||||||||||||||||||||||||||||||||||||||||||||||||||||||||||||||||||||||||||||||||||||||||||||||||||||||||||||||||||||||||||||||||||||||||||||||||||||||||||||||||||||||||||||||||||||||||||||||||||||||||||||||||||||||||||||||||||||||||||||||||||||||||
| library(party)
library(Hmisc) par1 <- as.numeric(par1) par3 <- as.numeric(par3) x <- data.frame(t(y)) is.data.frame(x) x <- x[!is.na(x[,par1]),] k <- length(x[1,]) n <- length(x[,1]) colnames(x)[par1] x[,par1] if (par2 == 'kmeans') { cl <- kmeans(x[,par1], par3) print(cl) clm <- matrix(cbind(cl$centers,1:par3),ncol=2) clm <- clm[sort.list(clm[,1]),] for (i in 1:par3) { cl$cluster[cl$cluster==clm[i,2]] <- paste('C',i,sep='') } cl$cluster <- as.factor(cl$cluster) print(cl$cluster) x[,par1] <- cl$cluster } if (par2 == 'quantiles') { x[,par1] <- cut2(x[,par1],g=par3) } if (par2 == 'hclust') { hc <- hclust(dist(x[,par1])^2, 'cen') print(hc) memb <- cutree(hc, k = par3) dum <- c(mean(x[memb==1,par1])) for (i in 2:par3) { dum <- c(dum, mean(x[memb==i,par1])) } hcm <- matrix(cbind(dum,1:par3),ncol=2) hcm <- hcm[sort.list(hcm[,1]),] for (i in 1:par3) { memb[memb==hcm[i,2]] <- paste('C',i,sep='') } memb <- as.factor(memb) print(memb) x[,par1] <- memb } if (par2=='equal') { ed <- cut(as.numeric(x[,par1]),par3,labels=paste('C',1:par3,sep='')) x[,par1] <- as.factor(ed) } table(x[,par1]) colnames(x) colnames(x)[par1] x[,par1] if (par2 == 'none') { m <- ctree(as.formula(paste(colnames(x)[par1],' ~ .',sep='')),data = x) } load(file='createtable') if (par2 != 'none') { m <- ctree(as.formula(paste('as.factor(',colnames(x)[par1],') ~ .',sep='')),data = x) if (par4=='yes') { a<-table.start() a<-table.row.start(a) a<-table.element(a,'10-Fold Cross Validation',3+2*par3,TRUE) a<-table.row.end(a) a<-table.row.start(a) a<-table.element(a,'',1,TRUE) a<-table.element(a,'Prediction (training)',par3+1,TRUE) a<-table.element(a,'Prediction (testing)',par3+1,TRUE) a<-table.row.end(a) a<-table.row.start(a) a<-table.element(a,'Actual',1,TRUE) for (jjj in 1:par3) a<-table.element(a,paste('C',jjj,sep=''),1,TRUE) a<-table.element(a,'CV',1,TRUE) for (jjj in 1:par3) a<-table.element(a,paste('C',jjj,sep=''),1,TRUE) a<-table.element(a,'CV',1,TRUE) a<-table.row.end(a) for (i in 1:10) { ind <- sample(2, nrow(x), replace=T, prob=c(0.9,0.1)) m.ct <- ctree(as.formula(paste('as.factor(',colnames(x)[par1],') ~ .',sep='')),data =x[ind==1,]) if (i==1) { m.ct.i.pred <- predict(m.ct, newdata=x[ind==1,]) m.ct.i.actu <- x[ind==1,par1] m.ct.x.pred <- predict(m.ct, newdata=x[ind==2,]) m.ct.x.actu <- x[ind==2,par1] } else { m.ct.i.pred <- c(m.ct.i.pred,predict(m.ct, newdata=x[ind==1,])) m.ct.i.actu <- c(m.ct.i.actu,x[ind==1,par1]) m.ct.x.pred <- c(m.ct.x.pred,predict(m.ct, newdata=x[ind==2,])) m.ct.x.actu <- c(m.ct.x.actu,x[ind==2,par1]) } } print(m.ct.i.tab <- table(m.ct.i.actu,m.ct.i.pred)) numer <- 0 for (i in 1:par3) { print(m.ct.i.tab[i,i] / sum(m.ct.i.tab[i,])) numer <- numer + m.ct.i.tab[i,i] } print(m.ct.i.cp <- numer / sum(m.ct.i.tab)) print(m.ct.x.tab <- table(m.ct.x.actu,m.ct.x.pred)) numer <- 0 for (i in 1:par3) { print(m.ct.x.tab[i,i] / sum(m.ct.x.tab[i,])) numer <- numer + m.ct.x.tab[i,i] } print(m.ct.x.cp <- numer / sum(m.ct.x.tab)) for (i in 1:par3) { a<-table.row.start(a) a<-table.element(a,paste('C',i,sep=''),1,TRUE) for (jjj in 1:par3) a<-table.element(a,m.ct.i.tab[i,jjj]) a<-table.element(a,round(m.ct.i.tab[i,i]/sum(m.ct.i.tab[i,]),4)) for (jjj in 1:par3) a<-table.element(a,m.ct.x.tab[i,jjj]) a<-table.element(a,round(m.ct.x.tab[i,i]/sum(m.ct.x.tab[i,]),4)) a<-table.row.end(a) } a<-table.row.start(a) a<-table.element(a,'Overall',1,TRUE) for (jjj in 1:par3) a<-table.element(a,'-') a<-table.element(a,round(m.ct.i.cp,4)) for (jjj in 1:par3) a<-table.element(a,'-') a<-table.element(a,round(m.ct.x.cp,4)) a<-table.row.end(a) a<-table.end(a) table.save(a,file='mytable3.tab') } } m bitmap(file='test1.png') plot(m) dev.off() bitmap(file='test1a.png') plot(x[,par1] ~ as.factor(where(m)),main='Response by Terminal Node',xlab='Terminal Node',ylab='Response') dev.off() if (par2 == 'none') { forec <- predict(m) result <- as.data.frame(cbind(x[,par1],forec,x[,par1]-forec)) colnames(result) <- c('Actuals','Forecasts','Residuals') print(result) } if (par2 != 'none') { print(cbind(as.factor(x[,par1]),predict(m))) myt <- table(as.factor(x[,par1]),predict(m)) print(myt) } bitmap(file='test2.png') if(par2=='none') { op <- par(mfrow=c(2,2)) plot(density(result$Actuals),main='Kernel Density Plot of Actuals') plot(density(result$Residuals),main='Kernel Density Plot of Residuals') plot(result$Forecasts,result$Actuals,main='Actuals versus Predictions',xlab='Predictions',ylab='Actuals') plot(density(result$Forecasts),main='Kernel Density Plot of Predictions') par(op) } if(par2!='none') { plot(myt,main='Confusion Matrix',xlab='Actual',ylab='Predicted') } dev.off() if (par2 == 'none') { detcoef <- cor(result$Forecasts,result$Actuals) a<-table.start() a<-table.row.start(a) a<-table.element(a,'Goodness of Fit',2,TRUE) a<-table.row.end(a) a<-table.row.start(a) a<-table.element(a,'Correlation',1,TRUE) a<-table.element(a,round(detcoef,4)) a<-table.row.end(a) a<-table.row.start(a) a<-table.element(a,'R-squared',1,TRUE) a<-table.element(a,round(detcoef*detcoef,4)) a<-table.row.end(a) a<-table.row.start(a) a<-table.element(a,'RMSE',1,TRUE) a<-table.element(a,round(sqrt(mean((result$Residuals)^2)),4)) a<-table.row.end(a) a<-table.end(a) table.save(a,file='mytable1.tab') a<-table.start() a<-table.row.start(a) a<-table.element(a,'Actuals, Predictions, and Residuals',4,TRUE) a<-table.row.end(a) a<-table.row.start(a) a<-table.element(a,'#',header=TRUE) a<-table.element(a,'Actuals',header=TRUE) a<-table.element(a,'Forecasts',header=TRUE) a<-table.element(a,'Residuals',header=TRUE) a<-table.row.end(a) for (i in 1:length(result$Actuals)) { a<-table.row.start(a) a<-table.element(a,i,header=TRUE) a<-table.element(a,result$Actuals[i]) a<-table.element(a,result$Forecasts[i]) a<-table.element(a,result$Residuals[i]) a<-table.row.end(a) } a<-table.end(a) table.save(a,file='mytable.tab') } if (par2 != 'none') { a<-table.start() a<-table.row.start(a) a<-table.element(a,'Confusion Matrix (predicted in columns / actuals in rows)',par3+1,TRUE) a<-table.row.end(a) a<-table.row.start(a) a<-table.element(a,'',1,TRUE) for (i in 1:par3) { a<-table.element(a,paste('C',i,sep=''),1,TRUE) } a<-table.row.end(a) for (i in 1:par3) { a<-table.row.start(a) a<-table.element(a,paste('C',i,sep=''),1,TRUE) for (j in 1:par3) { a<-table.element(a,myt[i,j]) } a<-table.row.end(a) } a<-table.end(a) table.save(a,file='mytable2.tab') } | ||||||||||||||||||||||||||||||||||||||||||||||||||||||||||||||||||||||||||||||||||||||||||||||||||||||||||||||||||||||||||||||||||||||||||||||||||||||||||||||||||||||||||||||||||||||||||||||||||||||||||||||||||||||||||||||||||||||||||||||||||||||||||||||||||||||||||||||||||||||||||||||||||||||||||||||||||||||||||
Copyright

This work is licensed under a
Creative Commons Attribution-Noncommercial-Share Alike 3.0 License.
Software written by Ed van Stee & Patrick Wessa
Disclaimer
Information provided on this web site is provided "AS IS" without warranty of any kind, either express or implied, including, without limitation, warranties of merchantability, fitness for a particular purpose, and noninfringement. We use reasonable efforts to include accurate and timely information and periodically update the information, and software without notice. However, we make no warranties or representations as to the accuracy or completeness of such information (or software), and we assume no liability or responsibility for errors or omissions in the content of this web site, or any software bugs in online applications. Your use of this web site is AT YOUR OWN RISK. Under no circumstances and under no legal theory shall we be liable to you or any other person for any direct, indirect, special, incidental, exemplary, or consequential damages arising from your access to, or use of, this web site.
Privacy Policy
We may request personal information to be submitted to our servers in order to be able to:
- personalize online software applications according to your needs
- enforce strict security rules with respect to the data that you upload (e.g. statistical data)
- manage user sessions of online applications
- alert you about important changes or upgrades in resources or applications
We NEVER allow other companies to directly offer registered users information about their products and services. Banner references and hyperlinks of third parties NEVER contain any personal data of the visitor.
We do NOT sell, nor transmit by any means, personal information, nor statistical data series uploaded by you to third parties.
We carefully protect your data from loss, misuse, alteration,
and destruction. However, at any time, and under any circumstance you
are solely responsible for managing your passwords, and keeping them
secret.
We store a unique ANONYMOUS USER ID in the form of a small 'Cookie' on your computer. This allows us to track your progress when using this website which is necessary to create state-dependent features. The cookie is used for NO OTHER PURPOSE. At any time you may opt to disallow cookies from this website - this will not affect other features of this website.
We examine cookies that are used by third-parties (banner and online ads) very closely: abuse from third-parties automatically results in termination of the advertising contract without refund. We have very good reason to believe that the cookies that are produced by third parties (banner ads) do NOT cause any privacy or security risk.
FreeStatistics.org is safe. There is no need to download any software to use the applications and services contained in this website. Hence, your system's security is not compromised by their use, and your personal data - other than data you submit in the account application form, and the user-agent information that is transmitted by your browser - is never transmitted to our servers.
As a general rule, we do not log on-line behavior of individuals (other than normal logging of webserver 'hits'). However, in cases of abuse, hacking, unauthorized access, Denial of Service attacks, illegal copying, hotlinking, non-compliance with international webstandards (such as robots.txt), or any other harmful behavior, our system engineers are empowered to log, track, identify, publish, and ban misbehaving individuals - even if this leads to ban entire blocks of IP addresses, or disclosing user's identity.