| *The author of this computation has been verified* | ||||||||||||||||||||||||||||||||||||||||||||||||||||||||||||||||||||||||||||||||||||||||||||||||||||||||||||||||||||||||||||||||||||||||||||||||||||||||||||||||||||||||||||||||||||||||||||||||||||||||||||||||||||||||||||||||||||||||||||||||||||||||||||||||||||||||||||||||||||||||||||||||||||||||
| R Software Module: /rwasp_arimabackwardselection.wasp (opens new window with default values) | ||||||||||||||||||||||||||||||||||||||||||||||||||||||||||||||||||||||||||||||||||||||||||||||||||||||||||||||||||||||||||||||||||||||||||||||||||||||||||||||||||||||||||||||||||||||||||||||||||||||||||||||||||||||||||||||||||||||||||||||||||||||||||||||||||||||||||||||||||||||||||||||||||||||||
| Title produced by software: ARIMA Backward Selection | ||||||||||||||||||||||||||||||||||||||||||||||||||||||||||||||||||||||||||||||||||||||||||||||||||||||||||||||||||||||||||||||||||||||||||||||||||||||||||||||||||||||||||||||||||||||||||||||||||||||||||||||||||||||||||||||||||||||||||||||||||||||||||||||||||||||||||||||||||||||||||||||||||||||||
| Date of computation: Tue, 07 Dec 2010 18:55:54 +0000 | ||||||||||||||||||||||||||||||||||||||||||||||||||||||||||||||||||||||||||||||||||||||||||||||||||||||||||||||||||||||||||||||||||||||||||||||||||||||||||||||||||||||||||||||||||||||||||||||||||||||||||||||||||||||||||||||||||||||||||||||||||||||||||||||||||||||||||||||||||||||||||||||||||||||||
| Cite this page as follows: | ||||||||||||||||||||||||||||||||||||||||||||||||||||||||||||||||||||||||||||||||||||||||||||||||||||||||||||||||||||||||||||||||||||||||||||||||||||||||||||||||||||||||||||||||||||||||||||||||||||||||||||||||||||||||||||||||||||||||||||||||||||||||||||||||||||||||||||||||||||||||||||||||||||||||
| Statistical Computations at FreeStatistics.org, Office for Research Development and Education, URL http://www.freestatistics.org/blog/date/2010/Dec/07/t1291748048stv4gi0zegsx12n.htm/, Retrieved Tue, 07 Dec 2010 19:54:08 +0100 | ||||||||||||||||||||||||||||||||||||||||||||||||||||||||||||||||||||||||||||||||||||||||||||||||||||||||||||||||||||||||||||||||||||||||||||||||||||||||||||||||||||||||||||||||||||||||||||||||||||||||||||||||||||||||||||||||||||||||||||||||||||||||||||||||||||||||||||||||||||||||||||||||||||||||
| BibTeX entries for LaTeX users: | ||||||||||||||||||||||||||||||||||||||||||||||||||||||||||||||||||||||||||||||||||||||||||||||||||||||||||||||||||||||||||||||||||||||||||||||||||||||||||||||||||||||||||||||||||||||||||||||||||||||||||||||||||||||||||||||||||||||||||||||||||||||||||||||||||||||||||||||||||||||||||||||||||||||||
@Manual{KEY,
    author = {{YOUR NAME}},
    publisher = {Office for Research Development and Education},
    title = {Statistical Computations at FreeStatistics.org, URL http://www.freestatistics.org/blog/date/2010/Dec/07/t1291748048stv4gi0zegsx12n.htm/},
    year = {2010},
}
@Manual{R,
    title = {R: A Language and Environment for Statistical Computing},
    author = {{R Development Core Team}},
    organization = {R Foundation for Statistical Computing},
    address = {Vienna, Austria},
    year = {2010},
    note = {{ISBN} 3-900051-07-0},
    url = {http://www.R-project.org},
}
| ||||||||||||||||||||||||||||||||||||||||||||||||||||||||||||||||||||||||||||||||||||||||||||||||||||||||||||||||||||||||||||||||||||||||||||||||||||||||||||||||||||||||||||||||||||||||||||||||||||||||||||||||||||||||||||||||||||||||||||||||||||||||||||||||||||||||||||||||||||||||||||||||||||||||
| Original text written by user: | ||||||||||||||||||||||||||||||||||||||||||||||||||||||||||||||||||||||||||||||||||||||||||||||||||||||||||||||||||||||||||||||||||||||||||||||||||||||||||||||||||||||||||||||||||||||||||||||||||||||||||||||||||||||||||||||||||||||||||||||||||||||||||||||||||||||||||||||||||||||||||||||||||||||||
| IsPrivate? | ||||||||||||||||||||||||||||||||||||||||||||||||||||||||||||||||||||||||||||||||||||||||||||||||||||||||||||||||||||||||||||||||||||||||||||||||||||||||||||||||||||||||||||||||||||||||||||||||||||||||||||||||||||||||||||||||||||||||||||||||||||||||||||||||||||||||||||||||||||||||||||||||||||||||
| No (this computation is public) | ||||||||||||||||||||||||||||||||||||||||||||||||||||||||||||||||||||||||||||||||||||||||||||||||||||||||||||||||||||||||||||||||||||||||||||||||||||||||||||||||||||||||||||||||||||||||||||||||||||||||||||||||||||||||||||||||||||||||||||||||||||||||||||||||||||||||||||||||||||||||||||||||||||||||
| User-defined keywords: | ||||||||||||||||||||||||||||||||||||||||||||||||||||||||||||||||||||||||||||||||||||||||||||||||||||||||||||||||||||||||||||||||||||||||||||||||||||||||||||||||||||||||||||||||||||||||||||||||||||||||||||||||||||||||||||||||||||||||||||||||||||||||||||||||||||||||||||||||||||||||||||||||||||||||
| Dataseries X: | ||||||||||||||||||||||||||||||||||||||||||||||||||||||||||||||||||||||||||||||||||||||||||||||||||||||||||||||||||||||||||||||||||||||||||||||||||||||||||||||||||||||||||||||||||||||||||||||||||||||||||||||||||||||||||||||||||||||||||||||||||||||||||||||||||||||||||||||||||||||||||||||||||||||||
| » Textbox « » Textfile « » CSV « | ||||||||||||||||||||||||||||||||||||||||||||||||||||||||||||||||||||||||||||||||||||||||||||||||||||||||||||||||||||||||||||||||||||||||||||||||||||||||||||||||||||||||||||||||||||||||||||||||||||||||||||||||||||||||||||||||||||||||||||||||||||||||||||||||||||||||||||||||||||||||||||||||||||||||
| 655362 873127 1107897 1555964 1671159 1493308 2957796 2638691 1305669 1280496 921900 867888 652586 913831 1108544 1555827 1699283 1509458 3268975 2425016 1312703 1365498 934453 775019 651142 843192 1146766 1652601 1465906 1652734 2922334 2702805 1458956 1410363 1019279 936574 708917 885295 1099663 1576220 1487870 1488635 2882530 2677026 1404398 1344370 936865 872705 628151 953712 1160384 1400618 1661511 1495347 2918786 2775677 1407026 1370199 964526 850851 683118 847224 1073256 1514326 1503734 1507712 2865698 2788128 1391596 1366378 946295 859626 | ||||||||||||||||||||||||||||||||||||||||||||||||||||||||||||||||||||||||||||||||||||||||||||||||||||||||||||||||||||||||||||||||||||||||||||||||||||||||||||||||||||||||||||||||||||||||||||||||||||||||||||||||||||||||||||||||||||||||||||||||||||||||||||||||||||||||||||||||||||||||||||||||||||||||
| Output produced by software: | ||||||||||||||||||||||||||||||||||||||||||||||||||||||||||||||||||||||||||||||||||||||||||||||||||||||||||||||||||||||||||||||||||||||||||||||||||||||||||||||||||||||||||||||||||||||||||||||||||||||||||||||||||||||||||||||||||||||||||||||||||||||||||||||||||||||||||||||||||||||||||||||||||||||||
| ||||||||||||||||||||||||||||||||||||||||||||||||||||||||||||||||||||||||||||||||||||||||||||||||||||||||||||||||||||||||||||||||||||||||||||||||||||||||||||||||||||||||||||||||||||||||||||||||||||||||||||||||||||||||||||||||||||||||||||||||||||||||||||||||||||||||||||||||||||||||||||||||||||||||
| Charts produced by software: | ||||||||||||||||||||||||||||||||||||||||||||||||||||||||||||||||||||||||||||||||||||||||||||||||||||||||||||||||||||||||||||||||||||||||||||||||||||||||||||||||||||||||||||||||||||||||||||||||||||||||||||||||||||||||||||||||||||||||||||||||||||||||||||||||||||||||||||||||||||||||||||||||||||||||
| ||||||||||||||||||||||||||||||||||||||||||||||||||||||||||||||||||||||||||||||||||||||||||||||||||||||||||||||||||||||||||||||||||||||||||||||||||||||||||||||||||||||||||||||||||||||||||||||||||||||||||||||||||||||||||||||||||||||||||||||||||||||||||||||||||||||||||||||||||||||||||||||||||||||||
| Parameters (Session): | ||||||||||||||||||||||||||||||||||||||||||||||||||||||||||||||||||||||||||||||||||||||||||||||||||||||||||||||||||||||||||||||||||||||||||||||||||||||||||||||||||||||||||||||||||||||||||||||||||||||||||||||||||||||||||||||||||||||||||||||||||||||||||||||||||||||||||||||||||||||||||||||||||||||||
| par1 = 48 ; par2 = 1 ; par3 = 2 ; par4 = 0 ; par5 = 12 ; par6 = White Noise ; par7 = 0.95 ; | ||||||||||||||||||||||||||||||||||||||||||||||||||||||||||||||||||||||||||||||||||||||||||||||||||||||||||||||||||||||||||||||||||||||||||||||||||||||||||||||||||||||||||||||||||||||||||||||||||||||||||||||||||||||||||||||||||||||||||||||||||||||||||||||||||||||||||||||||||||||||||||||||||||||||
| Parameters (R input): | ||||||||||||||||||||||||||||||||||||||||||||||||||||||||||||||||||||||||||||||||||||||||||||||||||||||||||||||||||||||||||||||||||||||||||||||||||||||||||||||||||||||||||||||||||||||||||||||||||||||||||||||||||||||||||||||||||||||||||||||||||||||||||||||||||||||||||||||||||||||||||||||||||||||||
| par1 = TRUE ; par2 = 1 ; par3 = 1 ; par4 = 1 ; par5 = 12 ; par6 = 3 ; par7 = 1 ; par8 = 2 ; par9 = 1 ; | ||||||||||||||||||||||||||||||||||||||||||||||||||||||||||||||||||||||||||||||||||||||||||||||||||||||||||||||||||||||||||||||||||||||||||||||||||||||||||||||||||||||||||||||||||||||||||||||||||||||||||||||||||||||||||||||||||||||||||||||||||||||||||||||||||||||||||||||||||||||||||||||||||||||||
| R code (references can be found in the software module): | ||||||||||||||||||||||||||||||||||||||||||||||||||||||||||||||||||||||||||||||||||||||||||||||||||||||||||||||||||||||||||||||||||||||||||||||||||||||||||||||||||||||||||||||||||||||||||||||||||||||||||||||||||||||||||||||||||||||||||||||||||||||||||||||||||||||||||||||||||||||||||||||||||||||||
| library(lattice)
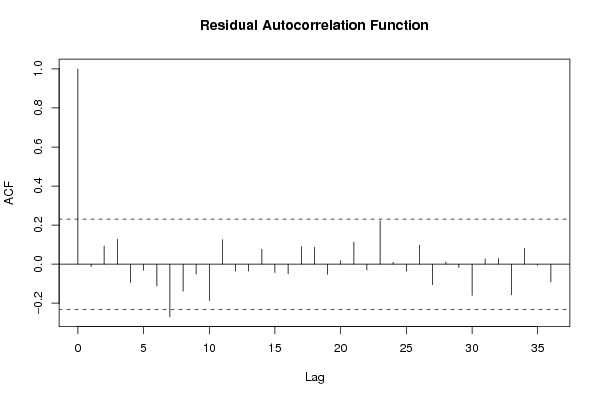
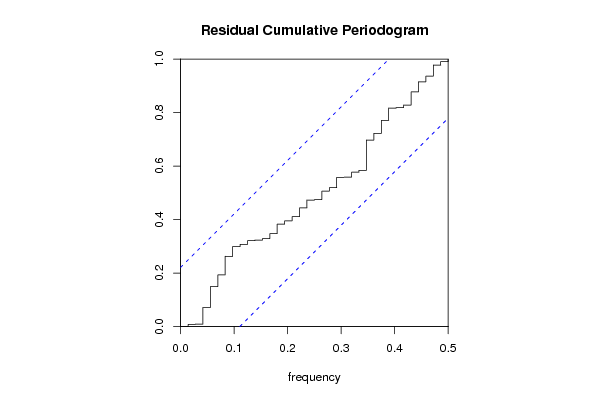
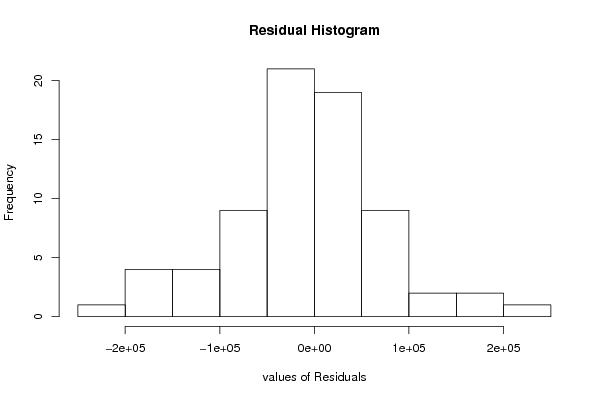
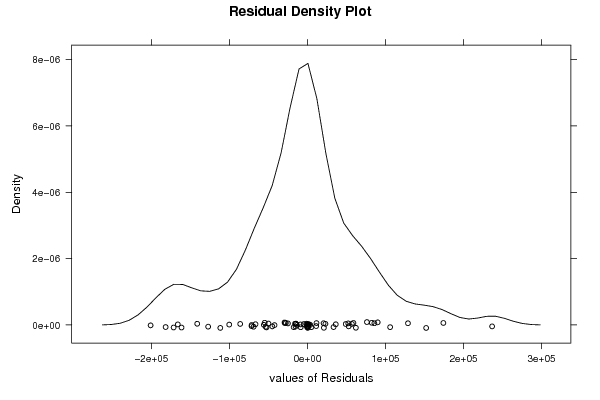
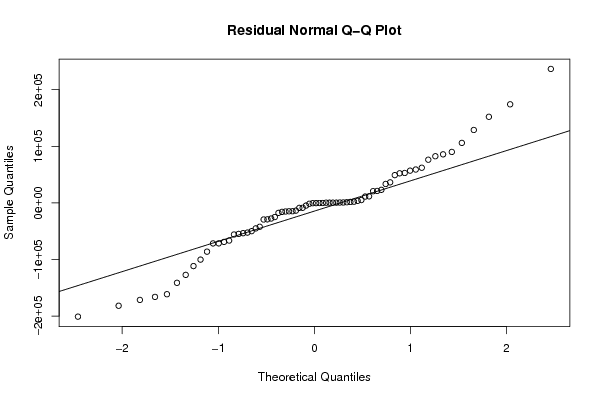
if (par1 == 'TRUE') par1 <- TRUE if (par1 == 'FALSE') par1 <- FALSE par2 <- as.numeric(par2) #Box-Cox lambda transformation parameter par3 <- as.numeric(par3) #degree of non-seasonal differencing par4 <- as.numeric(par4) #degree of seasonal differencing par5 <- as.numeric(par5) #seasonal period par6 <- as.numeric(par6) #degree (p) of the non-seasonal AR(p) polynomial par7 <- as.numeric(par7) #degree (q) of the non-seasonal MA(q) polynomial par8 <- as.numeric(par8) #degree (P) of the seasonal AR(P) polynomial par9 <- as.numeric(par9) #degree (Q) of the seasonal MA(Q) polynomial armaGR <- function(arima.out, names, n){ try1 <- arima.out$coef try2 <- sqrt(diag(arima.out$var.coef)) try.data.frame <- data.frame(matrix(NA,ncol=4,nrow=length(names))) dimnames(try.data.frame) <- list(names,c('coef','std','tstat','pv')) try.data.frame[,1] <- try1 for(i in 1:length(try2)) try.data.frame[which(rownames(try.data.frame)==names(try2)[i]),2] <- try2[i] try.data.frame[,3] <- try.data.frame[,1] / try.data.frame[,2] try.data.frame[,4] <- round((1-pt(abs(try.data.frame[,3]),df=n-(length(try2)+1)))*2,5) vector <- rep(NA,length(names)) vector[is.na(try.data.frame[,4])] <- 0 maxi <- which.max(try.data.frame[,4]) continue <- max(try.data.frame[,4],na.rm=TRUE) > .05 vector[maxi] <- 0 list(summary=try.data.frame,next.vector=vector,continue=continue) } arimaSelect <- function(series, order=c(13,0,0), seasonal=list(order=c(2,0,0),period=12), include.mean=F){ nrc <- order[1]+order[3]+seasonal$order[1]+seasonal$order[3] coeff <- matrix(NA, nrow=nrc*2, ncol=nrc) pval <- matrix(NA, nrow=nrc*2, ncol=nrc) mylist <- rep(list(NULL), nrc) names <- NULL if(order[1] > 0) names <- paste('ar',1:order[1],sep='') if(order[3] > 0) names <- c( names , paste('ma',1:order[3],sep='') ) if(seasonal$order[1] > 0) names <- c(names, paste('sar',1:seasonal$order[1],sep='')) if(seasonal$order[3] > 0) names <- c(names, paste('sma',1:seasonal$order[3],sep='')) arima.out <- arima(series, order=order, seasonal=seasonal, include.mean=include.mean, method='ML') mylist[[1]] <- arima.out last.arma <- armaGR(arima.out, names, length(series)) mystop <- FALSE i <- 1 coeff[i,] <- last.arma[[1]][,1] pval [i,] <- last.arma[[1]][,4] i <- 2 aic <- arima.out$aic while(!mystop){ mylist[[i]] <- arima.out arima.out <- arima(series, order=order, seasonal=seasonal, include.mean=include.mean, method='ML', fixed=last.arma$next.vector) aic <- c(aic, arima.out$aic) last.arma <- armaGR(arima.out, names, length(series)) mystop <- !last.arma$continue coeff[i,] <- last.arma[[1]][,1] pval [i,] <- last.arma[[1]][,4] i <- i+1 } list(coeff, pval, mylist, aic=aic) } arimaSelectplot <- function(arimaSelect.out,noms,choix){ noms <- names(arimaSelect.out[[3]][[1]]$coef) coeff <- arimaSelect.out[[1]] k <- min(which(is.na(coeff[,1])))-1 coeff <- coeff[1:k,] pval <- arimaSelect.out[[2]][1:k,] aic <- arimaSelect.out$aic[1:k] coeff[coeff==0] <- NA n <- ncol(coeff) if(missing(choix)) choix <- k layout(matrix(c(1,1,1,2, 3,3,3,2, 3,3,3,4, 5,6,7,7),nr=4), widths=c(10,35,45,15), heights=c(30,30,15,15)) couleurs <- rainbow(75)[1:50]#(50) ticks <- pretty(coeff) par(mar=c(1,1,3,1)) plot(aic,k:1-.5,type='o',pch=21,bg='blue',cex=2,axes=F,lty=2,xpd=NA) points(aic[choix],k-choix+.5,pch=21,cex=4,bg=2,xpd=NA) title('aic',line=2) par(mar=c(3,0,0,0)) plot(0,axes=F,xlab='',ylab='',xlim=range(ticks),ylim=c(.1,1)) rect(xleft = min(ticks) + (0:49)/50*(max(ticks)-min(ticks)), xright = min(ticks) + (1:50)/50*(max(ticks)-min(ticks)), ytop = rep(1,50), ybottom= rep(0,50),col=couleurs,border=NA) axis(1,ticks) rect(xleft=min(ticks),xright=max(ticks),ytop=1,ybottom=0) text(mean(coeff,na.rm=T),.5,'coefficients',cex=2,font=2) par(mar=c(1,1,3,1)) image(1:n,1:k,t(coeff[k:1,]),axes=F,col=couleurs,zlim=range(ticks)) for(i in 1:n) for(j in 1:k) if(!is.na(coeff[j,i])) { if(pval[j,i]<.01) symb = 'green' else if( (pval[j,i]<.05) & (pval[j,i]>=.01)) symb = 'orange' else if( (pval[j,i]<.1) & (pval[j,i]>=.05)) symb = 'red' else symb = 'black' polygon(c(i+.5 ,i+.2 ,i+.5 ,i+.5), c(k-j+0.5,k-j+0.5,k-j+0.8,k-j+0.5), col=symb) if(j==choix) { rect(xleft=i-.5, xright=i+.5, ybottom=k-j+1.5, ytop=k-j+.5, lwd=4) text(i, k-j+1, round(coeff[j,i],2), cex=1.2, font=2) } else{ rect(xleft=i-.5,xright=i+.5,ybottom=k-j+1.5,ytop=k-j+.5) text(i,k-j+1,round(coeff[j,i],2),cex=1.2,font=1) } } axis(3,1:n,noms) par(mar=c(0.5,0,0,0.5)) plot(0,axes=F,xlab='',ylab='',type='n',xlim=c(0,8),ylim=c(-.2,.8)) cols <- c('green','orange','red','black') niv <- c('0','0.01','0.05','0.1') for(i in 0:3){ polygon(c(1+2*i ,1+2*i ,1+2*i-.5 ,1+2*i), c(.4 ,.7 , .4 , .4), col=cols[i+1]) text(2*i,0.5,niv[i+1],cex=1.5) } text(8,.5,1,cex=1.5) text(4,0,'p-value',cex=2) box() residus <- arimaSelect.out[[3]][[choix]]$res par(mar=c(1,2,4,1)) acf(residus,main='') title('acf',line=.5) par(mar=c(1,2,4,1)) pacf(residus,main='') title('pacf',line=.5) par(mar=c(2,2,4,1)) qqnorm(residus,main='') title('qq-norm',line=.5) qqline(residus) residus } if (par2 == 0) x <- log(x) if (par2 != 0) x <- x^par2 (selection <- arimaSelect(x, order=c(par6,par3,par7), seasonal=list(order=c(par8,par4,par9), period=par5))) bitmap(file='test1.png') resid <- arimaSelectplot(selection) dev.off() resid bitmap(file='test2.png') acf(resid,length(resid)/2, main='Residual Autocorrelation Function') dev.off() bitmap(file='test3.png') pacf(resid,length(resid)/2, main='Residual Partial Autocorrelation Function') dev.off() bitmap(file='test4.png') cpgram(resid, main='Residual Cumulative Periodogram') dev.off() bitmap(file='test5.png') hist(resid, main='Residual Histogram', xlab='values of Residuals') dev.off() bitmap(file='test6.png') densityplot(~resid,col='black',main='Residual Density Plot', xlab='values of Residuals') dev.off() bitmap(file='test7.png') qqnorm(resid, main='Residual Normal Q-Q Plot') qqline(resid) dev.off() ncols <- length(selection[[1]][1,]) nrows <- length(selection[[2]][,1])-1 load(file='createtable') a<-table.start() a<-table.row.start(a) a<-table.element(a,'ARIMA Parameter Estimation and Backward Selection', ncols+1,TRUE) a<-table.row.end(a) a<-table.row.start(a) a<-table.element(a,'Iteration', header=TRUE) for (i in 1:ncols) { a<-table.element(a,names(selection[[3]][[1]]$coef)[i],header=TRUE) } a<-table.row.end(a) for (j in 1:nrows) { a<-table.row.start(a) mydum <- 'Estimates (' mydum <- paste(mydum,j) mydum <- paste(mydum,')') a<-table.element(a,mydum, header=TRUE) for (i in 1:ncols) { a<-table.element(a,round(selection[[1]][j,i],4)) } a<-table.row.end(a) a<-table.row.start(a) a<-table.element(a,'(p-val)', header=TRUE) for (i in 1:ncols) { mydum <- '(' mydum <- paste(mydum,round(selection[[2]][j,i],4),sep='') mydum <- paste(mydum,')') a<-table.element(a,mydum) } a<-table.row.end(a) } a<-table.end(a) table.save(a,file='mytable.tab') a<-table.start() a<-table.row.start(a) a<-table.element(a,'Estimated ARIMA Residuals', 1,TRUE) a<-table.row.end(a) a<-table.row.start(a) a<-table.element(a,'Value', 1,TRUE) a<-table.row.end(a) for (i in (par4*par5+par3):length(resid)) { a<-table.row.start(a) a<-table.element(a,resid[i]) a<-table.row.end(a) } a<-table.end(a) table.save(a,file='mytable1.tab') | ||||||||||||||||||||||||||||||||||||||||||||||||||||||||||||||||||||||||||||||||||||||||||||||||||||||||||||||||||||||||||||||||||||||||||||||||||||||||||||||||||||||||||||||||||||||||||||||||||||||||||||||||||||||||||||||||||||||||||||||||||||||||||||||||||||||||||||||||||||||||||||||||||||||||


Copyright

This work is licensed under a
Creative Commons Attribution-Noncommercial-Share Alike 3.0 License.
Software written by Ed van Stee & Patrick Wessa
Disclaimer
Information provided on this web site is provided "AS IS" without warranty of any kind, either express or implied, including, without limitation, warranties of merchantability, fitness for a particular purpose, and noninfringement. We use reasonable efforts to include accurate and timely information and periodically update the information, and software without notice. However, we make no warranties or representations as to the accuracy or completeness of such information (or software), and we assume no liability or responsibility for errors or omissions in the content of this web site, or any software bugs in online applications. Your use of this web site is AT YOUR OWN RISK. Under no circumstances and under no legal theory shall we be liable to you or any other person for any direct, indirect, special, incidental, exemplary, or consequential damages arising from your access to, or use of, this web site.
Privacy Policy
We may request personal information to be submitted to our servers in order to be able to:
- personalize online software applications according to your needs
- enforce strict security rules with respect to the data that you upload (e.g. statistical data)
- manage user sessions of online applications
- alert you about important changes or upgrades in resources or applications
We NEVER allow other companies to directly offer registered users information about their products and services. Banner references and hyperlinks of third parties NEVER contain any personal data of the visitor.
We do NOT sell, nor transmit by any means, personal information, nor statistical data series uploaded by you to third parties.
We carefully protect your data from loss, misuse, alteration,
and destruction. However, at any time, and under any circumstance you
are solely responsible for managing your passwords, and keeping them
secret.
We store a unique ANONYMOUS USER ID in the form of a small 'Cookie' on your computer. This allows us to track your progress when using this website which is necessary to create state-dependent features. The cookie is used for NO OTHER PURPOSE. At any time you may opt to disallow cookies from this website - this will not affect other features of this website.
We examine cookies that are used by third-parties (banner and online ads) very closely: abuse from third-parties automatically results in termination of the advertising contract without refund. We have very good reason to believe that the cookies that are produced by third parties (banner ads) do NOT cause any privacy or security risk.
FreeStatistics.org is safe. There is no need to download any software to use the applications and services contained in this website. Hence, your system's security is not compromised by their use, and your personal data - other than data you submit in the account application form, and the user-agent information that is transmitted by your browser - is never transmitted to our servers.
As a general rule, we do not log on-line behavior of individuals (other than normal logging of webserver 'hits'). However, in cases of abuse, hacking, unauthorized access, Denial of Service attacks, illegal copying, hotlinking, non-compliance with international webstandards (such as robots.txt), or any other harmful behavior, our system engineers are empowered to log, track, identify, publish, and ban misbehaving individuals - even if this leads to ban entire blocks of IP addresses, or disclosing user's identity.