Free Statistics

of Irreproducible Research!

Author's title

Author*The author of this computation has been verified*
R Software Modulerwasp_arimabackwardselection.wasp
Title produced by softwareARIMA Backward Selection
Date of computationSun, 05 Dec 2010 12:30:04 +0000
Cite this page as followsStatistical Computations at FreeStatistics.org, Office for Research Development and Education, URL https://freestatistics.org/blog/index.php?v=date/2010/Dec/05/t1291552096capw6jv30xla94y.htm/, Retrieved Wed, 08 May 2024 10:21:15 +0000
Statistical Computations at FreeStatistics.org, Office for Research Development and Education, URL https://freestatistics.org/blog/index.php?pk=105362, Retrieved Wed, 08 May 2024 10:21:15 +0000
QR Codes:

Original text written by user:
IsPrivate?No (this computation is public)
User-defined keywords
Estimated Impact145
Family? (F = Feedback message, R = changed R code, M = changed R Module, P = changed Parameters, D = changed Data)
-     [Univariate Data Series] [data set] [2008-12-01 19:54:57] [b98453cac15ba1066b407e146608df68]
- RMP   [Standard Deviation-Mean Plot] [Unemployment] [2010-11-29 10:34:47] [b98453cac15ba1066b407e146608df68]
- RMP     [ARIMA Backward Selection] [Unemployment] [2010-11-29 17:10:28] [b98453cac15ba1066b407e146608df68]
-   PD      [ARIMA Backward Selection] [W9] [2010-12-03 11:55:01] [56d90b683fcd93137645f9226b43c62b]
-   PD          [ARIMA Backward Selection] [W9 voor paper] [2010-12-05 12:30:04] [59f7d3e7fcb6374015f4e6b9053b0f01] [Current]
Feedback Forum

Post a new message
Dataseries X:
17848
19592
21092
20889
25890
24965
22225
20977
22897
22785
22769
19637
20203
20450
23083
21738
26766
25280
22574
22729
21378
22902
24989
21116
15169
15846
20927
18273
22538
15596
14034
11366
14861
15149
13577
13026
13190
13196
15826
14733
16307
15703
14589
12043
15057
14053
12698
10888
10045
11549
13767
12424
13116
14211
12266
12602
15714
13742
12745
10491
10057
10900
11771
11992
11993
14504
11727
11477
13578
11555
11846
11397
10066
10269
14279
13870
13695
14420
11424
9704
12464
14301
13464
9893
11572
12380
16692
16052
16459
14761
13654
13480
18068
16560
14530
10650
11651
13735
13360
17818
20613
16231
13862
12004
17734
15034
12609
12320
10833
11350
13648
14890
16325
18045
15616
11926
16855
15083
12520
12355


Summary of computational transaction
Raw Inputview raw input (R code)
Raw Outputview raw output of R engine
Computing time11 seconds
R Server'George Udny Yule' @ 72.249.76.132

\begin{tabular}{lllllllll}
\hline
Summary of computational transaction \tabularnewline
Raw Input & view raw input (R code)  \tabularnewline
Raw Output & view raw output of R engine  \tabularnewline
Computing time & 11 seconds \tabularnewline
R Server & 'George Udny Yule' @ 72.249.76.132 \tabularnewline
\hline
\end{tabular}
%Source: https://freestatistics.org/blog/index.php?pk=105362&T=0

[TABLE]
[ROW][C]Summary of computational transaction[/C][/ROW]
[ROW][C]Raw Input[/C][C]view raw input (R code) [/C][/ROW]
[ROW][C]Raw Output[/C][C]view raw output of R engine [/C][/ROW]
[ROW][C]Computing time[/C][C]11 seconds[/C][/ROW]
[ROW][C]R Server[/C][C]'George Udny Yule' @ 72.249.76.132[/C][/ROW]
[/TABLE]
Source: https://freestatistics.org/blog/index.php?pk=105362&T=0

Globally Unique Identifier (entire table): ba.freestatistics.org/blog/index.php?pk=105362&T=0

As an alternative you can also use a QR Code:  

The GUIDs for individual cells are displayed in the table below:

Summary of computational transaction
Raw Inputview raw input (R code)
Raw Outputview raw output of R engine
Computing time11 seconds
R Server'George Udny Yule' @ 72.249.76.132


ARIMA Parameter Estimation and Backward Selection
Iterationma1sma1
Estimates ( 1 )-0.4871-0.724
(p-val)(0 )(0 )
Estimates ( 2 )0-0.6703
(p-val)(NA )(0 )
Estimates ( 3 )NANA
(p-val)(NA )(NA )

\begin{tabular}{lllllllll}
\hline
ARIMA Parameter Estimation and Backward Selection \tabularnewline
Iteration & ma1 & sma1 \tabularnewline
Estimates ( 1 ) & -0.4871 & -0.724 \tabularnewline
(p-val) & (0 ) & (0 ) \tabularnewline
Estimates ( 2 ) & 0 & -0.6703 \tabularnewline
(p-val) & (NA ) & (0 ) \tabularnewline
Estimates ( 3 ) & NA & NA \tabularnewline
(p-val) & (NA ) & (NA ) \tabularnewline
\hline
\end{tabular}
%Source: https://freestatistics.org/blog/index.php?pk=105362&T=1

[TABLE]
[ROW][C]ARIMA Parameter Estimation and Backward Selection[/C][/ROW]
[ROW][C]Iteration[/C][C]ma1[/C][C]sma1[/C][/ROW]
[ROW][C]Estimates ( 1 )[/C][C]-0.4871[/C][C]-0.724[/C][/ROW]
[ROW][C](p-val)[/C][C](0 )[/C][C](0 )[/C][/ROW]
[ROW][C]Estimates ( 2 )[/C][C]0[/C][C]-0.6703[/C][/ROW]
[ROW][C](p-val)[/C][C](NA )[/C][C](0 )[/C][/ROW]
[ROW][C]Estimates ( 3 )[/C][C]NA[/C][C]NA[/C][/ROW]
[ROW][C](p-val)[/C][C](NA )[/C][C](NA )[/C][/ROW]
[/TABLE]
Source: https://freestatistics.org/blog/index.php?pk=105362&T=1

Globally Unique Identifier (entire table): ba.freestatistics.org/blog/index.php?pk=105362&T=1

As an alternative you can also use a QR Code:  

The GUIDs for individual cells are displayed in the table below:

ARIMA Parameter Estimation and Backward Selection
Iterationma1sma1
Estimates ( 1 )-0.4871-0.724
(p-val)(0 )(0 )
Estimates ( 2 )0-0.6703
(p-val)(NA )(0 )
Estimates ( 3 )NANA
(p-val)(NA )(NA )


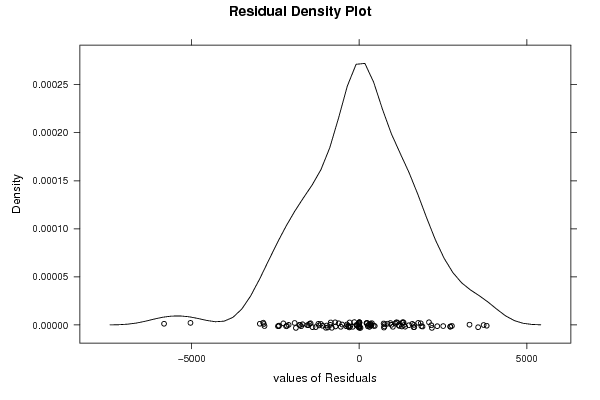
Estimated ARIMA Residuals
Value
-65.7886692023958
-1090.24367484819
430.585659502419
-716.196274911575
-324.815604320244
-612.262829694972
-270.607050591343
1004.55534842077
-2160.15087708942
272.903385308934
1836.27628767198
294.209023532974
-5036.42498500461
-2425.76148024945
1584.03717564569
-935.315370369908
-1145.25649894006
-5824.61639558718
-1769.05823118654
-2846.68855984107
1643.7163579688
378.254513714072
-2264.21551035044
1630.85888964840
3713.04669981441
928.935564757552
-146.517517985878
337.775796603019
-2867.36564083224
1324.18461343758
1760.82554732474
-297.863141200508
1335.33532324400
-863.610221452122
-1781.9791967927
-326.348368170571
755.873576664157
1273.27285812770
-193.225760322829
-59.6357581870998
-2966.78867113702
2081.56597632501
961.312485704218
2505.96571285172
2328.69489276303
-850.321697167459
-993.449669411257
-549.289086189081
752.999974905661
352.650616905747
-1732.65445548433
729.385131239915
-2395.84331415130
2716.32982956748
462.14022282523
1078.31837345603
303.540103346865
-1298.84052721797
235.379425563868
1856.20344784013
737.793811585268
-286.259346901873
1624.62649826189
1286.60435993284
-1511.2679988553
257.411004567131
-706.777150102872
-1198.17265399614
-86.0915684537755
2766.58864342742
844.53491991253
-1452.48017436344
2169.0298152043
1194.31269726531
2150.18551098837
1172.82959824073
-384.468180382503
-1890.05446553883
365.502071321458
1106.43038767528
2719.66374227134
6.49798380689502
-1548.18680799867
-2401.56163031232
218.756409982652
1481.53027364114
-2827.51747929102
3804.4225054705
3548.56341280605
-2179.88266855881
-1394.55524739916
-1691.44337410457
1889.24878643206
-1220.81367988151
-2107.90839533671
1371.25993003001
-816.210118086015
-969.342424715293
-365.420240735014
352.287899280744
37.6386809742901
3292.01653218924
1303.12504419209
-1927.29076084498
221.170251137824
-511.93914653335
-1480.66326641426
1135.36167531019

\begin{tabular}{lllllllll}
\hline
Estimated ARIMA Residuals \tabularnewline
Value \tabularnewline
-65.7886692023958 \tabularnewline
-1090.24367484819 \tabularnewline
430.585659502419 \tabularnewline
-716.196274911575 \tabularnewline
-324.815604320244 \tabularnewline
-612.262829694972 \tabularnewline
-270.607050591343 \tabularnewline
1004.55534842077 \tabularnewline
-2160.15087708942 \tabularnewline
272.903385308934 \tabularnewline
1836.27628767198 \tabularnewline
294.209023532974 \tabularnewline
-5036.42498500461 \tabularnewline
-2425.76148024945 \tabularnewline
1584.03717564569 \tabularnewline
-935.315370369908 \tabularnewline
-1145.25649894006 \tabularnewline
-5824.61639558718 \tabularnewline
-1769.05823118654 \tabularnewline
-2846.68855984107 \tabularnewline
1643.7163579688 \tabularnewline
378.254513714072 \tabularnewline
-2264.21551035044 \tabularnewline
1630.85888964840 \tabularnewline
3713.04669981441 \tabularnewline
928.935564757552 \tabularnewline
-146.517517985878 \tabularnewline
337.775796603019 \tabularnewline
-2867.36564083224 \tabularnewline
1324.18461343758 \tabularnewline
1760.82554732474 \tabularnewline
-297.863141200508 \tabularnewline
1335.33532324400 \tabularnewline
-863.610221452122 \tabularnewline
-1781.9791967927 \tabularnewline
-326.348368170571 \tabularnewline
755.873576664157 \tabularnewline
1273.27285812770 \tabularnewline
-193.225760322829 \tabularnewline
-59.6357581870998 \tabularnewline
-2966.78867113702 \tabularnewline
2081.56597632501 \tabularnewline
961.312485704218 \tabularnewline
2505.96571285172 \tabularnewline
2328.69489276303 \tabularnewline
-850.321697167459 \tabularnewline
-993.449669411257 \tabularnewline
-549.289086189081 \tabularnewline
752.999974905661 \tabularnewline
352.650616905747 \tabularnewline
-1732.65445548433 \tabularnewline
729.385131239915 \tabularnewline
-2395.84331415130 \tabularnewline
2716.32982956748 \tabularnewline
462.14022282523 \tabularnewline
1078.31837345603 \tabularnewline
303.540103346865 \tabularnewline
-1298.84052721797 \tabularnewline
235.379425563868 \tabularnewline
1856.20344784013 \tabularnewline
737.793811585268 \tabularnewline
-286.259346901873 \tabularnewline
1624.62649826189 \tabularnewline
1286.60435993284 \tabularnewline
-1511.2679988553 \tabularnewline
257.411004567131 \tabularnewline
-706.777150102872 \tabularnewline
-1198.17265399614 \tabularnewline
-86.0915684537755 \tabularnewline
2766.58864342742 \tabularnewline
844.53491991253 \tabularnewline
-1452.48017436344 \tabularnewline
2169.0298152043 \tabularnewline
1194.31269726531 \tabularnewline
2150.18551098837 \tabularnewline
1172.82959824073 \tabularnewline
-384.468180382503 \tabularnewline
-1890.05446553883 \tabularnewline
365.502071321458 \tabularnewline
1106.43038767528 \tabularnewline
2719.66374227134 \tabularnewline
6.49798380689502 \tabularnewline
-1548.18680799867 \tabularnewline
-2401.56163031232 \tabularnewline
218.756409982652 \tabularnewline
1481.53027364114 \tabularnewline
-2827.51747929102 \tabularnewline
3804.4225054705 \tabularnewline
3548.56341280605 \tabularnewline
-2179.88266855881 \tabularnewline
-1394.55524739916 \tabularnewline
-1691.44337410457 \tabularnewline
1889.24878643206 \tabularnewline
-1220.81367988151 \tabularnewline
-2107.90839533671 \tabularnewline
1371.25993003001 \tabularnewline
-816.210118086015 \tabularnewline
-969.342424715293 \tabularnewline
-365.420240735014 \tabularnewline
352.287899280744 \tabularnewline
37.6386809742901 \tabularnewline
3292.01653218924 \tabularnewline
1303.12504419209 \tabularnewline
-1927.29076084498 \tabularnewline
221.170251137824 \tabularnewline
-511.93914653335 \tabularnewline
-1480.66326641426 \tabularnewline
1135.36167531019 \tabularnewline
\hline
\end{tabular}
%Source: https://freestatistics.org/blog/index.php?pk=105362&T=2

[TABLE]
[ROW][C]Estimated ARIMA Residuals[/C][/ROW]
[ROW][C]Value[/C][/ROW]
[ROW][C]-65.7886692023958[/C][/ROW]
[ROW][C]-1090.24367484819[/C][/ROW]
[ROW][C]430.585659502419[/C][/ROW]
[ROW][C]-716.196274911575[/C][/ROW]
[ROW][C]-324.815604320244[/C][/ROW]
[ROW][C]-612.262829694972[/C][/ROW]
[ROW][C]-270.607050591343[/C][/ROW]
[ROW][C]1004.55534842077[/C][/ROW]
[ROW][C]-2160.15087708942[/C][/ROW]
[ROW][C]272.903385308934[/C][/ROW]
[ROW][C]1836.27628767198[/C][/ROW]
[ROW][C]294.209023532974[/C][/ROW]
[ROW][C]-5036.42498500461[/C][/ROW]
[ROW][C]-2425.76148024945[/C][/ROW]
[ROW][C]1584.03717564569[/C][/ROW]
[ROW][C]-935.315370369908[/C][/ROW]
[ROW][C]-1145.25649894006[/C][/ROW]
[ROW][C]-5824.61639558718[/C][/ROW]
[ROW][C]-1769.05823118654[/C][/ROW]
[ROW][C]-2846.68855984107[/C][/ROW]
[ROW][C]1643.7163579688[/C][/ROW]
[ROW][C]378.254513714072[/C][/ROW]
[ROW][C]-2264.21551035044[/C][/ROW]
[ROW][C]1630.85888964840[/C][/ROW]
[ROW][C]3713.04669981441[/C][/ROW]
[ROW][C]928.935564757552[/C][/ROW]
[ROW][C]-146.517517985878[/C][/ROW]
[ROW][C]337.775796603019[/C][/ROW]
[ROW][C]-2867.36564083224[/C][/ROW]
[ROW][C]1324.18461343758[/C][/ROW]
[ROW][C]1760.82554732474[/C][/ROW]
[ROW][C]-297.863141200508[/C][/ROW]
[ROW][C]1335.33532324400[/C][/ROW]
[ROW][C]-863.610221452122[/C][/ROW]
[ROW][C]-1781.9791967927[/C][/ROW]
[ROW][C]-326.348368170571[/C][/ROW]
[ROW][C]755.873576664157[/C][/ROW]
[ROW][C]1273.27285812770[/C][/ROW]
[ROW][C]-193.225760322829[/C][/ROW]
[ROW][C]-59.6357581870998[/C][/ROW]
[ROW][C]-2966.78867113702[/C][/ROW]
[ROW][C]2081.56597632501[/C][/ROW]
[ROW][C]961.312485704218[/C][/ROW]
[ROW][C]2505.96571285172[/C][/ROW]
[ROW][C]2328.69489276303[/C][/ROW]
[ROW][C]-850.321697167459[/C][/ROW]
[ROW][C]-993.449669411257[/C][/ROW]
[ROW][C]-549.289086189081[/C][/ROW]
[ROW][C]752.999974905661[/C][/ROW]
[ROW][C]352.650616905747[/C][/ROW]
[ROW][C]-1732.65445548433[/C][/ROW]
[ROW][C]729.385131239915[/C][/ROW]
[ROW][C]-2395.84331415130[/C][/ROW]
[ROW][C]2716.32982956748[/C][/ROW]
[ROW][C]462.14022282523[/C][/ROW]
[ROW][C]1078.31837345603[/C][/ROW]
[ROW][C]303.540103346865[/C][/ROW]
[ROW][C]-1298.84052721797[/C][/ROW]
[ROW][C]235.379425563868[/C][/ROW]
[ROW][C]1856.20344784013[/C][/ROW]
[ROW][C]737.793811585268[/C][/ROW]
[ROW][C]-286.259346901873[/C][/ROW]
[ROW][C]1624.62649826189[/C][/ROW]
[ROW][C]1286.60435993284[/C][/ROW]
[ROW][C]-1511.2679988553[/C][/ROW]
[ROW][C]257.411004567131[/C][/ROW]
[ROW][C]-706.777150102872[/C][/ROW]
[ROW][C]-1198.17265399614[/C][/ROW]
[ROW][C]-86.0915684537755[/C][/ROW]
[ROW][C]2766.58864342742[/C][/ROW]
[ROW][C]844.53491991253[/C][/ROW]
[ROW][C]-1452.48017436344[/C][/ROW]
[ROW][C]2169.0298152043[/C][/ROW]
[ROW][C]1194.31269726531[/C][/ROW]
[ROW][C]2150.18551098837[/C][/ROW]
[ROW][C]1172.82959824073[/C][/ROW]
[ROW][C]-384.468180382503[/C][/ROW]
[ROW][C]-1890.05446553883[/C][/ROW]
[ROW][C]365.502071321458[/C][/ROW]
[ROW][C]1106.43038767528[/C][/ROW]
[ROW][C]2719.66374227134[/C][/ROW]
[ROW][C]6.49798380689502[/C][/ROW]
[ROW][C]-1548.18680799867[/C][/ROW]
[ROW][C]-2401.56163031232[/C][/ROW]
[ROW][C]218.756409982652[/C][/ROW]
[ROW][C]1481.53027364114[/C][/ROW]
[ROW][C]-2827.51747929102[/C][/ROW]
[ROW][C]3804.4225054705[/C][/ROW]
[ROW][C]3548.56341280605[/C][/ROW]
[ROW][C]-2179.88266855881[/C][/ROW]
[ROW][C]-1394.55524739916[/C][/ROW]
[ROW][C]-1691.44337410457[/C][/ROW]
[ROW][C]1889.24878643206[/C][/ROW]
[ROW][C]-1220.81367988151[/C][/ROW]
[ROW][C]-2107.90839533671[/C][/ROW]
[ROW][C]1371.25993003001[/C][/ROW]
[ROW][C]-816.210118086015[/C][/ROW]
[ROW][C]-969.342424715293[/C][/ROW]
[ROW][C]-365.420240735014[/C][/ROW]
[ROW][C]352.287899280744[/C][/ROW]
[ROW][C]37.6386809742901[/C][/ROW]
[ROW][C]3292.01653218924[/C][/ROW]
[ROW][C]1303.12504419209[/C][/ROW]
[ROW][C]-1927.29076084498[/C][/ROW]
[ROW][C]221.170251137824[/C][/ROW]
[ROW][C]-511.93914653335[/C][/ROW]
[ROW][C]-1480.66326641426[/C][/ROW]
[ROW][C]1135.36167531019[/C][/ROW]
[/TABLE]
Source: https://freestatistics.org/blog/index.php?pk=105362&T=2

Globally Unique Identifier (entire table): ba.freestatistics.org/blog/index.php?pk=105362&T=2

As an alternative you can also use a QR Code:  

The GUIDs for individual cells are displayed in the table below:

Estimated ARIMA Residuals
Value
-65.7886692023958
-1090.24367484819
430.585659502419
-716.196274911575
-324.815604320244
-612.262829694972
-270.607050591343
1004.55534842077
-2160.15087708942
272.903385308934
1836.27628767198
294.209023532974
-5036.42498500461
-2425.76148024945
1584.03717564569
-935.315370369908
-1145.25649894006
-5824.61639558718
-1769.05823118654
-2846.68855984107
1643.7163579688
378.254513714072
-2264.21551035044
1630.85888964840
3713.04669981441
928.935564757552
-146.517517985878
337.775796603019
-2867.36564083224
1324.18461343758
1760.82554732474
-297.863141200508
1335.33532324400
-863.610221452122
-1781.9791967927
-326.348368170571
755.873576664157
1273.27285812770
-193.225760322829
-59.6357581870998
-2966.78867113702
2081.56597632501
961.312485704218
2505.96571285172
2328.69489276303
-850.321697167459
-993.449669411257
-549.289086189081
752.999974905661
352.650616905747
-1732.65445548433
729.385131239915
-2395.84331415130
2716.32982956748
462.14022282523
1078.31837345603
303.540103346865
-1298.84052721797
235.379425563868
1856.20344784013
737.793811585268
-286.259346901873
1624.62649826189
1286.60435993284
-1511.2679988553
257.411004567131
-706.777150102872
-1198.17265399614
-86.0915684537755
2766.58864342742
844.53491991253
-1452.48017436344
2169.0298152043
1194.31269726531
2150.18551098837
1172.82959824073
-384.468180382503
-1890.05446553883
365.502071321458
1106.43038767528
2719.66374227134
6.49798380689502
-1548.18680799867
-2401.56163031232
218.756409982652
1481.53027364114
-2827.51747929102
3804.4225054705
3548.56341280605
-2179.88266855881
-1394.55524739916
-1691.44337410457
1889.24878643206
-1220.81367988151
-2107.90839533671
1371.25993003001
-816.210118086015
-969.342424715293
-365.420240735014
352.287899280744
37.6386809742901
3292.01653218924
1303.12504419209
-1927.29076084498
221.170251137824
-511.93914653335
-1480.66326641426
1135.36167531019


Parameters (Session):
Parameters (R input):
par1 = FALSE ; par2 = 1 ; par3 = 1 ; par4 = 1 ; par5 = 12 ; par6 = 0 ; par7 = 1 ; par8 = 0 ; par9 = 1 ;
R code (references can be found in the software module):
library(lattice)
if (par1 == 'TRUE') par1 <- TRUE
if (par1 == 'FALSE') par1 <- FALSE
par2 <- as.numeric(par2) #Box-Cox lambda transformation parameter
par3 <- as.numeric(par3) #degree of non-seasonal differencing
par4 <- as.numeric(par4) #degree of seasonal differencing
par5 <- as.numeric(par5) #seasonal period
par6 <- as.numeric(par6) #degree (p) of the non-seasonal AR(p) polynomial
par7 <- as.numeric(par7) #degree (q) of the non-seasonal MA(q) polynomial
par8 <- as.numeric(par8) #degree (P) of the seasonal AR(P) polynomial
par9 <- as.numeric(par9) #degree (Q) of the seasonal MA(Q) polynomial
armaGR <- function(arima.out, names, n){
try1 <- arima.out$coef
try2 <- sqrt(diag(arima.out$var.coef))
try.data.frame <- data.frame(matrix(NA,ncol=4,nrow=length(names)))
dimnames(try.data.frame) <- list(names,c('coef','std','tstat','pv'))
try.data.frame[,1] <- try1
for(i in 1:length(try2)) try.data.frame[which(rownames(try.data.frame)==names(try2)[i]),2] <- try2[i]
try.data.frame[,3] <- try.data.frame[,1] / try.data.frame[,2]
try.data.frame[,4] <- round((1-pt(abs(try.data.frame[,3]),df=n-(length(try2)+1)))*2,5)
vector <- rep(NA,length(names))
vector[is.na(try.data.frame[,4])] <- 0
maxi <- which.max(try.data.frame[,4])
continue <- max(try.data.frame[,4],na.rm=TRUE) > .05
vector[maxi] <- 0
list(summary=try.data.frame,next.vector=vector,continue=continue)
}
arimaSelect <- function(series, order=c(13,0,0), seasonal=list(order=c(2,0,0),period=12), include.mean=F){
nrc <- order[1]+order[3]+seasonal$order[1]+seasonal$order[3]
coeff <- matrix(NA, nrow=nrc*2, ncol=nrc)
pval <- matrix(NA, nrow=nrc*2, ncol=nrc)
mylist <- rep(list(NULL), nrc)
names <- NULL
if(order[1] > 0) names <- paste('ar',1:order[1],sep='')
if(order[3] > 0) names <- c( names , paste('ma',1:order[3],sep='') )
if(seasonal$order[1] > 0) names <- c(names, paste('sar',1:seasonal$order[1],sep=''))
if(seasonal$order[3] > 0) names <- c(names, paste('sma',1:seasonal$order[3],sep=''))
arima.out <- arima(series, order=order, seasonal=seasonal, include.mean=include.mean, method='ML')
mylist[[1]] <- arima.out
last.arma <- armaGR(arima.out, names, length(series))
mystop <- FALSE
i <- 1
coeff[i,] <- last.arma[[1]][,1]
pval [i,] <- last.arma[[1]][,4]
i <- 2
aic <- arima.out$aic
while(!mystop){
mylist[[i]] <- arima.out
arima.out <- arima(series, order=order, seasonal=seasonal, include.mean=include.mean, method='ML', fixed=last.arma$next.vector)
aic <- c(aic, arima.out$aic)
last.arma <- armaGR(arima.out, names, length(series))
mystop <- !last.arma$continue
coeff[i,] <- last.arma[[1]][,1]
pval [i,] <- last.arma[[1]][,4]
i <- i+1
}
list(coeff, pval, mylist, aic=aic)
}
arimaSelectplot <- function(arimaSelect.out,noms,choix){
noms <- names(arimaSelect.out[[3]][[1]]$coef)
coeff <- arimaSelect.out[[1]]
k <- min(which(is.na(coeff[,1])))-1
coeff <- coeff[1:k,]
pval <- arimaSelect.out[[2]][1:k,]
aic <- arimaSelect.out$aic[1:k]
coeff[coeff==0] <- NA
n <- ncol(coeff)
if(missing(choix)) choix <- k
layout(matrix(c(1,1,1,2,
3,3,3,2,
3,3,3,4,
5,6,7,7),nr=4),
widths=c(10,35,45,15),
heights=c(30,30,15,15))
couleurs <- rainbow(75)[1:50]#(50)
ticks <- pretty(coeff)
par(mar=c(1,1,3,1))
plot(aic,k:1-.5,type='o',pch=21,bg='blue',cex=2,axes=F,lty=2,xpd=NA)
points(aic[choix],k-choix+.5,pch=21,cex=4,bg=2,xpd=NA)
title('aic',line=2)
par(mar=c(3,0,0,0))
plot(0,axes=F,xlab='',ylab='',xlim=range(ticks),ylim=c(.1,1))
rect(xleft = min(ticks) + (0:49)/50*(max(ticks)-min(ticks)),
xright = min(ticks) + (1:50)/50*(max(ticks)-min(ticks)),
ytop = rep(1,50),
ybottom= rep(0,50),col=couleurs,border=NA)
axis(1,ticks)
rect(xleft=min(ticks),xright=max(ticks),ytop=1,ybottom=0)
text(mean(coeff,na.rm=T),.5,'coefficients',cex=2,font=2)
par(mar=c(1,1,3,1))
image(1:n,1:k,t(coeff[k:1,]),axes=F,col=couleurs,zlim=range(ticks))
for(i in 1:n) for(j in 1:k) if(!is.na(coeff[j,i])) {
if(pval[j,i]<.01) symb = 'green'
else if( (pval[j,i]<.05) & (pval[j,i]>=.01)) symb = 'orange'
else if( (pval[j,i]<.1) & (pval[j,i]>=.05)) symb = 'red'
else symb = 'black'
polygon(c(i+.5 ,i+.2 ,i+.5 ,i+.5),
c(k-j+0.5,k-j+0.5,k-j+0.8,k-j+0.5),
col=symb)
if(j==choix) {
rect(xleft=i-.5,
xright=i+.5,
ybottom=k-j+1.5,
ytop=k-j+.5,
lwd=4)
text(i,
k-j+1,
round(coeff[j,i],2),
cex=1.2,
font=2)
}
else{
rect(xleft=i-.5,xright=i+.5,ybottom=k-j+1.5,ytop=k-j+.5)
text(i,k-j+1,round(coeff[j,i],2),cex=1.2,font=1)
}
}
axis(3,1:n,noms)
par(mar=c(0.5,0,0,0.5))
plot(0,axes=F,xlab='',ylab='',type='n',xlim=c(0,8),ylim=c(-.2,.8))
cols <- c('green','orange','red','black')
niv <- c('0','0.01','0.05','0.1')
for(i in 0:3){
polygon(c(1+2*i ,1+2*i ,1+2*i-.5 ,1+2*i),
c(.4 ,.7 , .4 , .4),
col=cols[i+1])
text(2*i,0.5,niv[i+1],cex=1.5)
}
text(8,.5,1,cex=1.5)
text(4,0,'p-value',cex=2)
box()
residus <- arimaSelect.out[[3]][[choix]]$res
par(mar=c(1,2,4,1))
acf(residus,main='')
title('acf',line=.5)
par(mar=c(1,2,4,1))
pacf(residus,main='')
title('pacf',line=.5)
par(mar=c(2,2,4,1))
qqnorm(residus,main='')
title('qq-norm',line=.5)
qqline(residus)
residus
}
if (par2 == 0) x <- log(x)
if (par2 != 0) x <- x^par2
(selection <- arimaSelect(x, order=c(par6,par3,par7), seasonal=list(order=c(par8,par4,par9), period=par5)))
bitmap(file='test1.png')
resid <- arimaSelectplot(selection)
dev.off()
resid
bitmap(file='test2.png')
acf(resid,length(resid)/2, main='Residual Autocorrelation Function')
dev.off()
bitmap(file='test3.png')
pacf(resid,length(resid)/2, main='Residual Partial Autocorrelation Function')
dev.off()
bitmap(file='test4.png')
cpgram(resid, main='Residual Cumulative Periodogram')
dev.off()
bitmap(file='test5.png')
hist(resid, main='Residual Histogram', xlab='values of Residuals')
dev.off()
bitmap(file='test6.png')
densityplot(~resid,col='black',main='Residual Density Plot', xlab='values of Residuals')
dev.off()
bitmap(file='test7.png')
qqnorm(resid, main='Residual Normal Q-Q Plot')
qqline(resid)
dev.off()
ncols <- length(selection[[1]][1,])
nrows <- length(selection[[2]][,1])-1
load(file='createtable')
a<-table.start()
a<-table.row.start(a)
a<-table.element(a,'ARIMA Parameter Estimation and Backward Selection', ncols+1,TRUE)
a<-table.row.end(a)
a<-table.row.start(a)
a<-table.element(a,'Iteration', header=TRUE)
for (i in 1:ncols) {
a<-table.element(a,names(selection[[3]][[1]]$coef)[i],header=TRUE)
}
a<-table.row.end(a)
for (j in 1:nrows) {
a<-table.row.start(a)
mydum <- 'Estimates ('
mydum <- paste(mydum,j)
mydum <- paste(mydum,')')
a<-table.element(a,mydum, header=TRUE)
for (i in 1:ncols) {
a<-table.element(a,round(selection[[1]][j,i],4))
}
a<-table.row.end(a)
a<-table.row.start(a)
a<-table.element(a,'(p-val)', header=TRUE)
for (i in 1:ncols) {
mydum <- '('
mydum <- paste(mydum,round(selection[[2]][j,i],4),sep='')
mydum <- paste(mydum,')')
a<-table.element(a,mydum)
}
a<-table.row.end(a)
}
a<-table.end(a)
table.save(a,file='mytable.tab')
a<-table.start()
a<-table.row.start(a)
a<-table.element(a,'Estimated ARIMA Residuals', 1,TRUE)
a<-table.row.end(a)
a<-table.row.start(a)
a<-table.element(a,'Value', 1,TRUE)
a<-table.row.end(a)
for (i in (par4*par5+par3):length(resid)) {
a<-table.row.start(a)
a<-table.element(a,resid[i])
a<-table.row.end(a)
}
a<-table.end(a)
table.save(a,file='mytable1.tab')