Workshop 9 - Arima Huwelijken (1) | |||||||||||||||||||||||||||||||||||||||||||||||||||||||||||||||||||||||||||||||||||||||||||||||||||||||||||||||||||||||||||||||||||||||||||||||||||||||||||||||||||||||||||||||||||||||||||||||||||||||||||||||||||||||||||||||||||||||||||||||||||||||||||||||||||||||||||||||||||||||||||||||||||||||||||||||||||||||||||||||||
| *The author of this computation has been verified* | |||||||||||||||||||||||||||||||||||||||||||||||||||||||||||||||||||||||||||||||||||||||||||||||||||||||||||||||||||||||||||||||||||||||||||||||||||||||||||||||||||||||||||||||||||||||||||||||||||||||||||||||||||||||||||||||||||||||||||||||||||||||||||||||||||||||||||||||||||||||||||||||||||||||||||||||||||||||||||||||||
| R Software Module: /rwasp_arimabackwardselection.wasp (opens new window with default values) | |||||||||||||||||||||||||||||||||||||||||||||||||||||||||||||||||||||||||||||||||||||||||||||||||||||||||||||||||||||||||||||||||||||||||||||||||||||||||||||||||||||||||||||||||||||||||||||||||||||||||||||||||||||||||||||||||||||||||||||||||||||||||||||||||||||||||||||||||||||||||||||||||||||||||||||||||||||||||||||||||
| Title produced by software: ARIMA Backward Selection | |||||||||||||||||||||||||||||||||||||||||||||||||||||||||||||||||||||||||||||||||||||||||||||||||||||||||||||||||||||||||||||||||||||||||||||||||||||||||||||||||||||||||||||||||||||||||||||||||||||||||||||||||||||||||||||||||||||||||||||||||||||||||||||||||||||||||||||||||||||||||||||||||||||||||||||||||||||||||||||||||
| Date of computation: Fri, 03 Dec 2010 16:08:16 +0000 | |||||||||||||||||||||||||||||||||||||||||||||||||||||||||||||||||||||||||||||||||||||||||||||||||||||||||||||||||||||||||||||||||||||||||||||||||||||||||||||||||||||||||||||||||||||||||||||||||||||||||||||||||||||||||||||||||||||||||||||||||||||||||||||||||||||||||||||||||||||||||||||||||||||||||||||||||||||||||||||||||
| Cite this page as follows: | |||||||||||||||||||||||||||||||||||||||||||||||||||||||||||||||||||||||||||||||||||||||||||||||||||||||||||||||||||||||||||||||||||||||||||||||||||||||||||||||||||||||||||||||||||||||||||||||||||||||||||||||||||||||||||||||||||||||||||||||||||||||||||||||||||||||||||||||||||||||||||||||||||||||||||||||||||||||||||||||||
| Statistical Computations at FreeStatistics.org, Office for Research Development and Education, URL http://www.freestatistics.org/blog/date/2010/Dec/03/t1291392384bth55ht5m1kdnaa.htm/, Retrieved Fri, 03 Dec 2010 17:06:24 +0100 | |||||||||||||||||||||||||||||||||||||||||||||||||||||||||||||||||||||||||||||||||||||||||||||||||||||||||||||||||||||||||||||||||||||||||||||||||||||||||||||||||||||||||||||||||||||||||||||||||||||||||||||||||||||||||||||||||||||||||||||||||||||||||||||||||||||||||||||||||||||||||||||||||||||||||||||||||||||||||||||||||
| BibTeX entries for LaTeX users: | |||||||||||||||||||||||||||||||||||||||||||||||||||||||||||||||||||||||||||||||||||||||||||||||||||||||||||||||||||||||||||||||||||||||||||||||||||||||||||||||||||||||||||||||||||||||||||||||||||||||||||||||||||||||||||||||||||||||||||||||||||||||||||||||||||||||||||||||||||||||||||||||||||||||||||||||||||||||||||||||||
@Manual{KEY,
    author = {{YOUR NAME}},
    publisher = {Office for Research Development and Education},
    title = {Statistical Computations at FreeStatistics.org, URL http://www.freestatistics.org/blog/date/2010/Dec/03/t1291392384bth55ht5m1kdnaa.htm/},
    year = {2010},
}
@Manual{R,
    title = {R: A Language and Environment for Statistical Computing},
    author = {{R Development Core Team}},
    organization = {R Foundation for Statistical Computing},
    address = {Vienna, Austria},
    year = {2010},
    note = {{ISBN} 3-900051-07-0},
    url = {http://www.R-project.org},
}
| |||||||||||||||||||||||||||||||||||||||||||||||||||||||||||||||||||||||||||||||||||||||||||||||||||||||||||||||||||||||||||||||||||||||||||||||||||||||||||||||||||||||||||||||||||||||||||||||||||||||||||||||||||||||||||||||||||||||||||||||||||||||||||||||||||||||||||||||||||||||||||||||||||||||||||||||||||||||||||||||||
| Original text written by user: | |||||||||||||||||||||||||||||||||||||||||||||||||||||||||||||||||||||||||||||||||||||||||||||||||||||||||||||||||||||||||||||||||||||||||||||||||||||||||||||||||||||||||||||||||||||||||||||||||||||||||||||||||||||||||||||||||||||||||||||||||||||||||||||||||||||||||||||||||||||||||||||||||||||||||||||||||||||||||||||||||
| IsPrivate? | |||||||||||||||||||||||||||||||||||||||||||||||||||||||||||||||||||||||||||||||||||||||||||||||||||||||||||||||||||||||||||||||||||||||||||||||||||||||||||||||||||||||||||||||||||||||||||||||||||||||||||||||||||||||||||||||||||||||||||||||||||||||||||||||||||||||||||||||||||||||||||||||||||||||||||||||||||||||||||||||||
| No (this computation is public) | |||||||||||||||||||||||||||||||||||||||||||||||||||||||||||||||||||||||||||||||||||||||||||||||||||||||||||||||||||||||||||||||||||||||||||||||||||||||||||||||||||||||||||||||||||||||||||||||||||||||||||||||||||||||||||||||||||||||||||||||||||||||||||||||||||||||||||||||||||||||||||||||||||||||||||||||||||||||||||||||||
| User-defined keywords: | |||||||||||||||||||||||||||||||||||||||||||||||||||||||||||||||||||||||||||||||||||||||||||||||||||||||||||||||||||||||||||||||||||||||||||||||||||||||||||||||||||||||||||||||||||||||||||||||||||||||||||||||||||||||||||||||||||||||||||||||||||||||||||||||||||||||||||||||||||||||||||||||||||||||||||||||||||||||||||||||||
| Dataseries X: | |||||||||||||||||||||||||||||||||||||||||||||||||||||||||||||||||||||||||||||||||||||||||||||||||||||||||||||||||||||||||||||||||||||||||||||||||||||||||||||||||||||||||||||||||||||||||||||||||||||||||||||||||||||||||||||||||||||||||||||||||||||||||||||||||||||||||||||||||||||||||||||||||||||||||||||||||||||||||||||||||
| » Textbox « » Textfile « » CSV « | |||||||||||||||||||||||||||||||||||||||||||||||||||||||||||||||||||||||||||||||||||||||||||||||||||||||||||||||||||||||||||||||||||||||||||||||||||||||||||||||||||||||||||||||||||||||||||||||||||||||||||||||||||||||||||||||||||||||||||||||||||||||||||||||||||||||||||||||||||||||||||||||||||||||||||||||||||||||||||||||||
| 1579 2146 2462 3695 4831 5134 6250 5760 6249 2917 1741 2359 1511 2059 2635 2867 4403 5720 4502 5749 5627 2846 1762 2429 1169 2154 2249 2687 4359 5382 4459 6398 4596 3024 1887 2070 1351 2218 2461 3028 4784 4975 4607 6249 4809 3157 1910 2228 1594 2467 2222 3607 4685 4962 5770 5480 5000 3228 1993 2288 1580 2111 2192 3601 4665 4876 5813 5589 5331 3075 2002 2306 1507 1992 2487 3490 4647 5594 5611 5788 6204 3013 1931 2549 1504 2090 2702 2939 4500 6208 6415 5657 5964 3163 1997 2422 | |||||||||||||||||||||||||||||||||||||||||||||||||||||||||||||||||||||||||||||||||||||||||||||||||||||||||||||||||||||||||||||||||||||||||||||||||||||||||||||||||||||||||||||||||||||||||||||||||||||||||||||||||||||||||||||||||||||||||||||||||||||||||||||||||||||||||||||||||||||||||||||||||||||||||||||||||||||||||||||||||
| Output produced by software: | |||||||||||||||||||||||||||||||||||||||||||||||||||||||||||||||||||||||||||||||||||||||||||||||||||||||||||||||||||||||||||||||||||||||||||||||||||||||||||||||||||||||||||||||||||||||||||||||||||||||||||||||||||||||||||||||||||||||||||||||||||||||||||||||||||||||||||||||||||||||||||||||||||||||||||||||||||||||||||||||||
| |||||||||||||||||||||||||||||||||||||||||||||||||||||||||||||||||||||||||||||||||||||||||||||||||||||||||||||||||||||||||||||||||||||||||||||||||||||||||||||||||||||||||||||||||||||||||||||||||||||||||||||||||||||||||||||||||||||||||||||||||||||||||||||||||||||||||||||||||||||||||||||||||||||||||||||||||||||||||||||||||
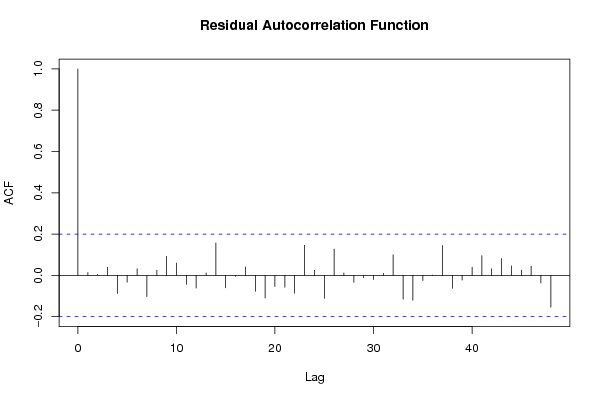
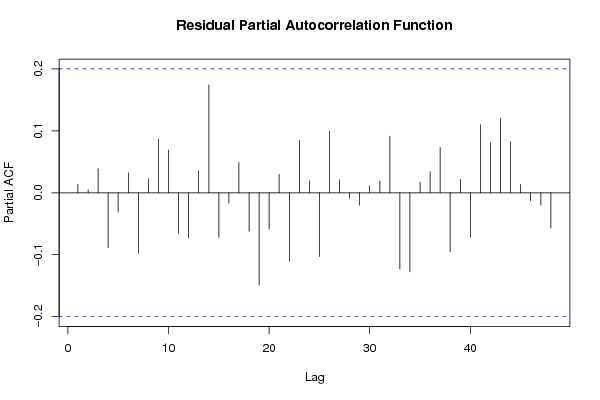
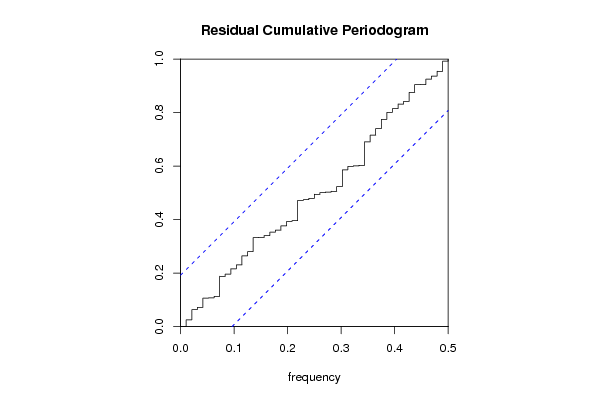
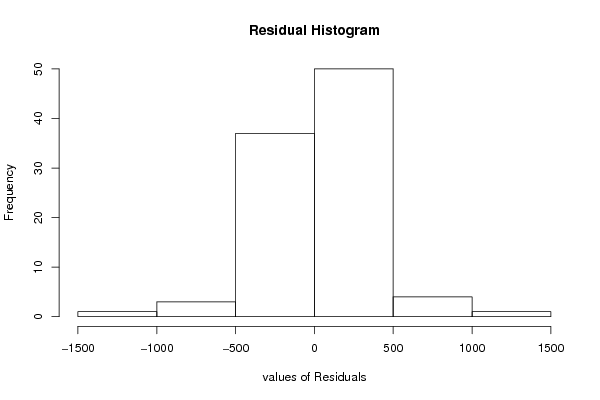
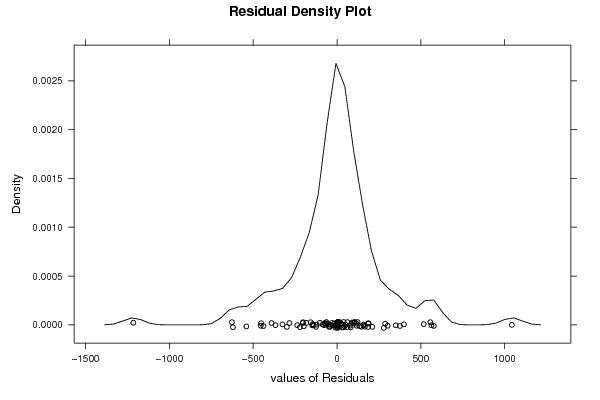
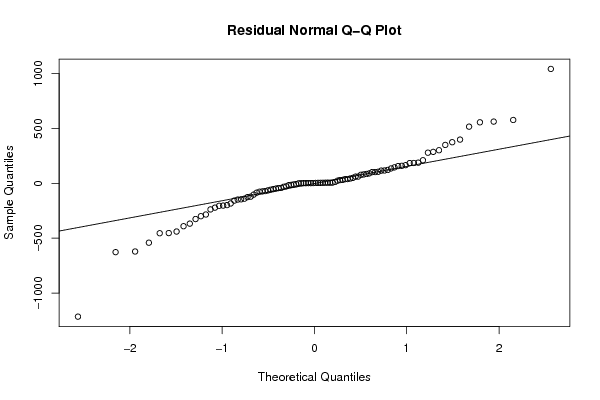
| Charts produced by software: | |||||||||||||||||||||||||||||||||||||||||||||||||||||||||||||||||||||||||||||||||||||||||||||||||||||||||||||||||||||||||||||||||||||||||||||||||||||||||||||||||||||||||||||||||||||||||||||||||||||||||||||||||||||||||||||||||||||||||||||||||||||||||||||||||||||||||||||||||||||||||||||||||||||||||||||||||||||||||||||||||
| |||||||||||||||||||||||||||||||||||||||||||||||||||||||||||||||||||||||||||||||||||||||||||||||||||||||||||||||||||||||||||||||||||||||||||||||||||||||||||||||||||||||||||||||||||||||||||||||||||||||||||||||||||||||||||||||||||||||||||||||||||||||||||||||||||||||||||||||||||||||||||||||||||||||||||||||||||||||||||||||||
| Parameters (Session): | |||||||||||||||||||||||||||||||||||||||||||||||||||||||||||||||||||||||||||||||||||||||||||||||||||||||||||||||||||||||||||||||||||||||||||||||||||||||||||||||||||||||||||||||||||||||||||||||||||||||||||||||||||||||||||||||||||||||||||||||||||||||||||||||||||||||||||||||||||||||||||||||||||||||||||||||||||||||||||||||||
| par1 = 48 ; par2 = 1 ; par3 = 0 ; par4 = 0 ; par5 = 12 ; par6 = White Noise ; par7 = 0.95 ; | |||||||||||||||||||||||||||||||||||||||||||||||||||||||||||||||||||||||||||||||||||||||||||||||||||||||||||||||||||||||||||||||||||||||||||||||||||||||||||||||||||||||||||||||||||||||||||||||||||||||||||||||||||||||||||||||||||||||||||||||||||||||||||||||||||||||||||||||||||||||||||||||||||||||||||||||||||||||||||||||||
| Parameters (R input): | |||||||||||||||||||||||||||||||||||||||||||||||||||||||||||||||||||||||||||||||||||||||||||||||||||||||||||||||||||||||||||||||||||||||||||||||||||||||||||||||||||||||||||||||||||||||||||||||||||||||||||||||||||||||||||||||||||||||||||||||||||||||||||||||||||||||||||||||||||||||||||||||||||||||||||||||||||||||||||||||||
| par1 = FALSE ; par2 = 1 ; par3 = 0 ; par4 = 1 ; par5 = 12 ; par6 = 3 ; par7 = 1 ; par8 = 2 ; par9 = 1 ; | |||||||||||||||||||||||||||||||||||||||||||||||||||||||||||||||||||||||||||||||||||||||||||||||||||||||||||||||||||||||||||||||||||||||||||||||||||||||||||||||||||||||||||||||||||||||||||||||||||||||||||||||||||||||||||||||||||||||||||||||||||||||||||||||||||||||||||||||||||||||||||||||||||||||||||||||||||||||||||||||||
| R code (references can be found in the software module): | |||||||||||||||||||||||||||||||||||||||||||||||||||||||||||||||||||||||||||||||||||||||||||||||||||||||||||||||||||||||||||||||||||||||||||||||||||||||||||||||||||||||||||||||||||||||||||||||||||||||||||||||||||||||||||||||||||||||||||||||||||||||||||||||||||||||||||||||||||||||||||||||||||||||||||||||||||||||||||||||||
| library(lattice)
if (par1 == 'TRUE') par1 <- TRUE if (par1 == 'FALSE') par1 <- FALSE par2 <- as.numeric(par2) #Box-Cox lambda transformation parameter par3 <- as.numeric(par3) #degree of non-seasonal differencing par4 <- as.numeric(par4) #degree of seasonal differencing par5 <- as.numeric(par5) #seasonal period par6 <- as.numeric(par6) #degree (p) of the non-seasonal AR(p) polynomial par7 <- as.numeric(par7) #degree (q) of the non-seasonal MA(q) polynomial par8 <- as.numeric(par8) #degree (P) of the seasonal AR(P) polynomial par9 <- as.numeric(par9) #degree (Q) of the seasonal MA(Q) polynomial armaGR <- function(arima.out, names, n){ try1 <- arima.out$coef try2 <- sqrt(diag(arima.out$var.coef)) try.data.frame <- data.frame(matrix(NA,ncol=4,nrow=length(names))) dimnames(try.data.frame) <- list(names,c('coef','std','tstat','pv')) try.data.frame[,1] <- try1 for(i in 1:length(try2)) try.data.frame[which(rownames(try.data.frame)==names(try2)[i]),2] <- try2[i] try.data.frame[,3] <- try.data.frame[,1] / try.data.frame[,2] try.data.frame[,4] <- round((1-pt(abs(try.data.frame[,3]),df=n-(length(try2)+1)))*2,5) vector <- rep(NA,length(names)) vector[is.na(try.data.frame[,4])] <- 0 maxi <- which.max(try.data.frame[,4]) continue <- max(try.data.frame[,4],na.rm=TRUE) > .05 vector[maxi] <- 0 list(summary=try.data.frame,next.vector=vector,continue=continue) } arimaSelect <- function(series, order=c(13,0,0), seasonal=list(order=c(2,0,0),period=12), include.mean=F){ nrc <- order[1]+order[3]+seasonal$order[1]+seasonal$order[3] coeff <- matrix(NA, nrow=nrc*2, ncol=nrc) pval <- matrix(NA, nrow=nrc*2, ncol=nrc) mylist <- rep(list(NULL), nrc) names <- NULL if(order[1] > 0) names <- paste('ar',1:order[1],sep='') if(order[3] > 0) names <- c( names , paste('ma',1:order[3],sep='') ) if(seasonal$order[1] > 0) names <- c(names, paste('sar',1:seasonal$order[1],sep='')) if(seasonal$order[3] > 0) names <- c(names, paste('sma',1:seasonal$order[3],sep='')) arima.out <- arima(series, order=order, seasonal=seasonal, include.mean=include.mean, method='ML') mylist[[1]] <- arima.out last.arma <- armaGR(arima.out, names, length(series)) mystop <- FALSE i <- 1 coeff[i,] <- last.arma[[1]][,1] pval [i,] <- last.arma[[1]][,4] i <- 2 aic <- arima.out$aic while(!mystop){ mylist[[i]] <- arima.out arima.out <- arima(series, order=order, seasonal=seasonal, include.mean=include.mean, method='ML', fixed=last.arma$next.vector) aic <- c(aic, arima.out$aic) last.arma <- armaGR(arima.out, names, length(series)) mystop <- !last.arma$continue coeff[i,] <- last.arma[[1]][,1] pval [i,] <- last.arma[[1]][,4] i <- i+1 } list(coeff, pval, mylist, aic=aic) } arimaSelectplot <- function(arimaSelect.out,noms,choix){ noms <- names(arimaSelect.out[[3]][[1]]$coef) coeff <- arimaSelect.out[[1]] k <- min(which(is.na(coeff[,1])))-1 coeff <- coeff[1:k,] pval <- arimaSelect.out[[2]][1:k,] aic <- arimaSelect.out$aic[1:k] coeff[coeff==0] <- NA n <- ncol(coeff) if(missing(choix)) choix <- k layout(matrix(c(1,1,1,2, 3,3,3,2, 3,3,3,4, 5,6,7,7),nr=4), widths=c(10,35,45,15), heights=c(30,30,15,15)) couleurs <- rainbow(75)[1:50]#(50) ticks <- pretty(coeff) par(mar=c(1,1,3,1)) plot(aic,k:1-.5,type='o',pch=21,bg='blue',cex=2,axes=F,lty=2,xpd=NA) points(aic[choix],k-choix+.5,pch=21,cex=4,bg=2,xpd=NA) title('aic',line=2) par(mar=c(3,0,0,0)) plot(0,axes=F,xlab='',ylab='',xlim=range(ticks),ylim=c(.1,1)) rect(xleft = min(ticks) + (0:49)/50*(max(ticks)-min(ticks)), xright = min(ticks) + (1:50)/50*(max(ticks)-min(ticks)), ytop = rep(1,50), ybottom= rep(0,50),col=couleurs,border=NA) axis(1,ticks) rect(xleft=min(ticks),xright=max(ticks),ytop=1,ybottom=0) text(mean(coeff,na.rm=T),.5,'coefficients',cex=2,font=2) par(mar=c(1,1,3,1)) image(1:n,1:k,t(coeff[k:1,]),axes=F,col=couleurs,zlim=range(ticks)) for(i in 1:n) for(j in 1:k) if(!is.na(coeff[j,i])) { if(pval[j,i]<.01) symb = 'green' else if( (pval[j,i]<.05) & (pval[j,i]>=.01)) symb = 'orange' else if( (pval[j,i]<.1) & (pval[j,i]>=.05)) symb = 'red' else symb = 'black' polygon(c(i+.5 ,i+.2 ,i+.5 ,i+.5), c(k-j+0.5,k-j+0.5,k-j+0.8,k-j+0.5), col=symb) if(j==choix) { rect(xleft=i-.5, xright=i+.5, ybottom=k-j+1.5, ytop=k-j+.5, lwd=4) text(i, k-j+1, round(coeff[j,i],2), cex=1.2, font=2) } else{ rect(xleft=i-.5,xright=i+.5,ybottom=k-j+1.5,ytop=k-j+.5) text(i,k-j+1,round(coeff[j,i],2),cex=1.2,font=1) } } axis(3,1:n,noms) par(mar=c(0.5,0,0,0.5)) plot(0,axes=F,xlab='',ylab='',type='n',xlim=c(0,8),ylim=c(-.2,.8)) cols <- c('green','orange','red','black') niv <- c('0','0.01','0.05','0.1') for(i in 0:3){ polygon(c(1+2*i ,1+2*i ,1+2*i-.5 ,1+2*i), c(.4 ,.7 , .4 , .4), col=cols[i+1]) text(2*i,0.5,niv[i+1],cex=1.5) } text(8,.5,1,cex=1.5) text(4,0,'p-value',cex=2) box() residus <- arimaSelect.out[[3]][[choix]]$res par(mar=c(1,2,4,1)) acf(residus,main='') title('acf',line=.5) par(mar=c(1,2,4,1)) pacf(residus,main='') title('pacf',line=.5) par(mar=c(2,2,4,1)) qqnorm(residus,main='') title('qq-norm',line=.5) qqline(residus) residus } if (par2 == 0) x <- log(x) if (par2 != 0) x <- x^par2 (selection <- arimaSelect(x, order=c(par6,par3,par7), seasonal=list(order=c(par8,par4,par9), period=par5))) bitmap(file='test1.png') resid <- arimaSelectplot(selection) dev.off() resid bitmap(file='test2.png') acf(resid,length(resid)/2, main='Residual Autocorrelation Function') dev.off() bitmap(file='test3.png') pacf(resid,length(resid)/2, main='Residual Partial Autocorrelation Function') dev.off() bitmap(file='test4.png') cpgram(resid, main='Residual Cumulative Periodogram') dev.off() bitmap(file='test5.png') hist(resid, main='Residual Histogram', xlab='values of Residuals') dev.off() bitmap(file='test6.png') densityplot(~resid,col='black',main='Residual Density Plot', xlab='values of Residuals') dev.off() bitmap(file='test7.png') qqnorm(resid, main='Residual Normal Q-Q Plot') qqline(resid) dev.off() ncols <- length(selection[[1]][1,]) nrows <- length(selection[[2]][,1])-1 load(file='createtable') a<-table.start() a<-table.row.start(a) a<-table.element(a,'ARIMA Parameter Estimation and Backward Selection', ncols+1,TRUE) a<-table.row.end(a) a<-table.row.start(a) a<-table.element(a,'Iteration', header=TRUE) for (i in 1:ncols) { a<-table.element(a,names(selection[[3]][[1]]$coef)[i],header=TRUE) } a<-table.row.end(a) for (j in 1:nrows) { a<-table.row.start(a) mydum <- 'Estimates (' mydum <- paste(mydum,j) mydum <- paste(mydum,')') a<-table.element(a,mydum, header=TRUE) for (i in 1:ncols) { a<-table.element(a,round(selection[[1]][j,i],4)) } a<-table.row.end(a) a<-table.row.start(a) a<-table.element(a,'(p-val)', header=TRUE) for (i in 1:ncols) { mydum <- '(' mydum <- paste(mydum,round(selection[[2]][j,i],4),sep='') mydum <- paste(mydum,')') a<-table.element(a,mydum) } a<-table.row.end(a) } a<-table.end(a) table.save(a,file='mytable.tab') a<-table.start() a<-table.row.start(a) a<-table.element(a,'Estimated ARIMA Residuals', 1,TRUE) a<-table.row.end(a) a<-table.row.start(a) a<-table.element(a,'Value', 1,TRUE) a<-table.row.end(a) for (i in (par4*par5+par3):length(resid)) { a<-table.row.start(a) a<-table.element(a,resid[i]) a<-table.row.end(a) } a<-table.end(a) table.save(a,file='mytable1.tab') | |||||||||||||||||||||||||||||||||||||||||||||||||||||||||||||||||||||||||||||||||||||||||||||||||||||||||||||||||||||||||||||||||||||||||||||||||||||||||||||||||||||||||||||||||||||||||||||||||||||||||||||||||||||||||||||||||||||||||||||||||||||||||||||||||||||||||||||||||||||||||||||||||||||||||||||||||||||||||||||||||

Copyright

This work is licensed under a
Creative Commons Attribution-Noncommercial-Share Alike 3.0 License.
Software written by Ed van Stee & Patrick Wessa
Disclaimer
Information provided on this web site is provided "AS IS" without warranty of any kind, either express or implied, including, without limitation, warranties of merchantability, fitness for a particular purpose, and noninfringement. We use reasonable efforts to include accurate and timely information and periodically update the information, and software without notice. However, we make no warranties or representations as to the accuracy or completeness of such information (or software), and we assume no liability or responsibility for errors or omissions in the content of this web site, or any software bugs in online applications. Your use of this web site is AT YOUR OWN RISK. Under no circumstances and under no legal theory shall we be liable to you or any other person for any direct, indirect, special, incidental, exemplary, or consequential damages arising from your access to, or use of, this web site.
Privacy Policy
We may request personal information to be submitted to our servers in order to be able to:
- personalize online software applications according to your needs
- enforce strict security rules with respect to the data that you upload (e.g. statistical data)
- manage user sessions of online applications
- alert you about important changes or upgrades in resources or applications
We NEVER allow other companies to directly offer registered users information about their products and services. Banner references and hyperlinks of third parties NEVER contain any personal data of the visitor.
We do NOT sell, nor transmit by any means, personal information, nor statistical data series uploaded by you to third parties.
We carefully protect your data from loss, misuse, alteration,
and destruction. However, at any time, and under any circumstance you
are solely responsible for managing your passwords, and keeping them
secret.
We store a unique ANONYMOUS USER ID in the form of a small 'Cookie' on your computer. This allows us to track your progress when using this website which is necessary to create state-dependent features. The cookie is used for NO OTHER PURPOSE. At any time you may opt to disallow cookies from this website - this will not affect other features of this website.
We examine cookies that are used by third-parties (banner and online ads) very closely: abuse from third-parties automatically results in termination of the advertising contract without refund. We have very good reason to believe that the cookies that are produced by third parties (banner ads) do NOT cause any privacy or security risk.
FreeStatistics.org is safe. There is no need to download any software to use the applications and services contained in this website. Hence, your system's security is not compromised by their use, and your personal data - other than data you submit in the account application form, and the user-agent information that is transmitted by your browser - is never transmitted to our servers.
As a general rule, we do not log on-line behavior of individuals (other than normal logging of webserver 'hits'). However, in cases of abuse, hacking, unauthorized access, Denial of Service attacks, illegal copying, hotlinking, non-compliance with international webstandards (such as robots.txt), or any other harmful behavior, our system engineers are empowered to log, track, identify, publish, and ban misbehaving individuals - even if this leads to ban entire blocks of IP addresses, or disclosing user's identity.