Free Statistics
of Irreproducible Research!
Description of Statistical Computation | |||||||||||||||||||||||||||||||||||||||||||||||||||||
|---|---|---|---|---|---|---|---|---|---|---|---|---|---|---|---|---|---|---|---|---|---|---|---|---|---|---|---|---|---|---|---|---|---|---|---|---|---|---|---|---|---|---|---|---|---|---|---|---|---|---|---|---|---|
| Author's title | |||||||||||||||||||||||||||||||||||||||||||||||||||||
| Author | *The author of this computation has been verified* | ||||||||||||||||||||||||||||||||||||||||||||||||||||
| R Software Module | rwasp_edauni.wasp | ||||||||||||||||||||||||||||||||||||||||||||||||||||
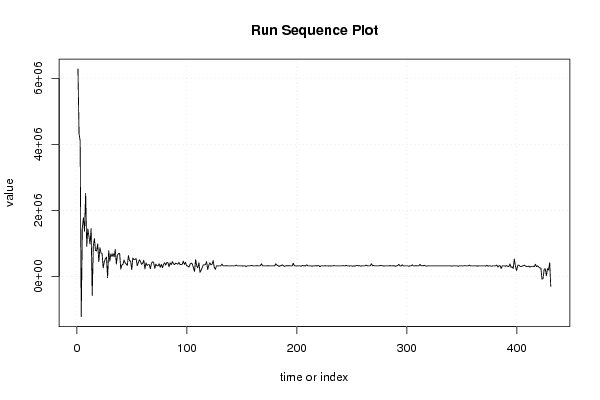
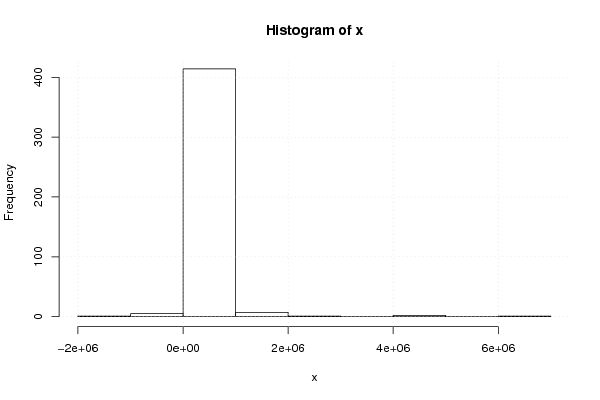
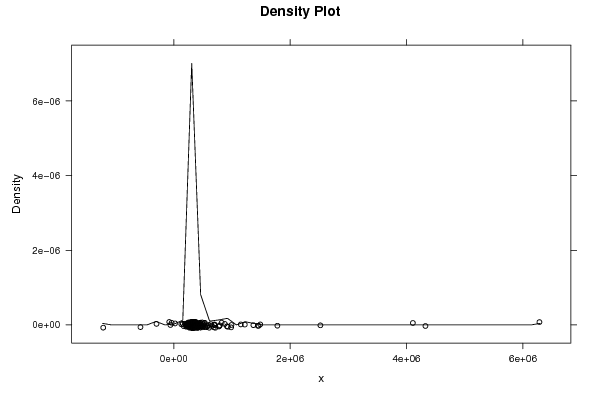
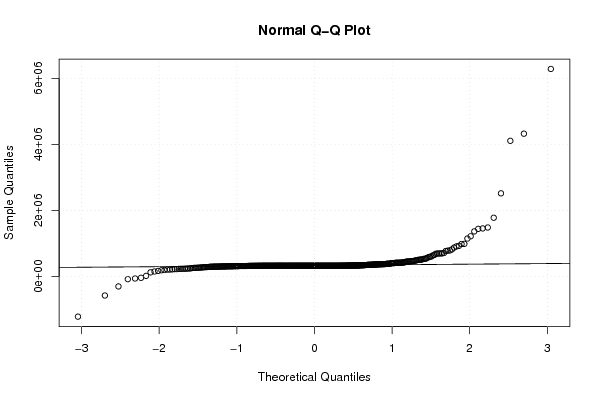
| Title produced by software | Univariate Explorative Data Analysis | ||||||||||||||||||||||||||||||||||||||||||||||||||||
| Date of computation | Thu, 02 Dec 2010 15:42:43 +0000 | ||||||||||||||||||||||||||||||||||||||||||||||||||||
| Cite this page as follows | Statistical Computations at FreeStatistics.org, Office for Research Development and Education, URL https://freestatistics.org/blog/index.php?v=date/2010/Dec/02/t1291304625pan5kwoyv4pjzrx.htm/, Retrieved Thu, 01 Jan 2026 02:12:54 +0000 | ||||||||||||||||||||||||||||||||||||||||||||||||||||
| Statistical Computations at FreeStatistics.org, Office for Research Development and Education, URL https://freestatistics.org/blog/index.php?pk=104336, Retrieved Thu, 01 Jan 2026 02:12:54 +0000 | |||||||||||||||||||||||||||||||||||||||||||||||||||||
| QR Codes: | |||||||||||||||||||||||||||||||||||||||||||||||||||||
|
| |||||||||||||||||||||||||||||||||||||||||||||||||||||
| Original text written by user: | |||||||||||||||||||||||||||||||||||||||||||||||||||||
| IsPrivate? | No (this computation is public) | ||||||||||||||||||||||||||||||||||||||||||||||||||||
| User-defined keywords | |||||||||||||||||||||||||||||||||||||||||||||||||||||
| Estimated Impact | 470 | ||||||||||||||||||||||||||||||||||||||||||||||||||||
Tree of Dependent Computations | |||||||||||||||||||||||||||||||||||||||||||||||||||||
| Family? (F = Feedback message, R = changed R code, M = changed R Module, P = changed Parameters, D = changed Data) | |||||||||||||||||||||||||||||||||||||||||||||||||||||
| - [Multiple Regression] [Competence to learn] [2010-11-17 07:43:53] [b98453cac15ba1066b407e146608df68] - R PD [Multiple Regression] [WS7 Tutorial] [2010-11-18 16:04:53] [afe9379cca749d06b3d6872e02cc47ed] - D [Multiple Regression] [WS7 Tutorial Popu...] [2010-11-22 10:41:15] [afe9379cca749d06b3d6872e02cc47ed] - RMPD [Univariate Explorative Data Analysis] [] [2010-12-02 15:42:43] [f3ebcd8ed76b32fdadb8ee7c5dc81ded] [Current] - R D [Univariate Explorative Data Analysis] [Run Sequence Plot...] [2010-12-02 19:58:40] [69c775ce4d55db2aa75a88e773e8d700] | |||||||||||||||||||||||||||||||||||||||||||||||||||||
| Feedback Forum | |||||||||||||||||||||||||||||||||||||||||||||||||||||
Post a new message | |||||||||||||||||||||||||||||||||||||||||||||||||||||
Dataset | |||||||||||||||||||||||||||||||||||||||||||||||||||||
| Dataseries X: | |||||||||||||||||||||||||||||||||||||||||||||||||||||
6282929 4324047 4108272 -1212617 1485329 1779876 1367203 2519076 912684 1443586 1220017 984885 1457425 -572920 929144 1151176 790090 774497 990576 454195 876607 711969 702380 264449 450033 541063 588864 -37216 783310 467359 688779 608419 696348 597793 821730 377934 651939 697458 700368 225986 348695 373683 501709 413743 379825 336260 636765 481231 469107 211928 563925 511939 521016 543856 329304 423262 509665 455881 367772 406339 493408 232942 416002 337430 361517 360962 235561 408247 450296 418799 247405 378519 326638 328233 386225 283662 370225 269236 365732 420383 345811 431809 418876 297476 416776 357257 458343 388386 358934 407560 392558 373177 428370 369419 358649 376641 467427 364885 436230 329118 317365 286849 376685 407198 377772 271483 153661 513294 324881 264512 420968 129302 191521 268673 353179 354624 363713 456657 211742 338381 418530 351483 372928 485538 279268 219060 325560 325314 322046 325560 325599 377028 325560 323850 325560 331514 325632 325560 325560 325560 322265 325560 325906 325985 346145 325898 325560 325356 325560 325930 318020 326389 325560 302925 325540 325560 325560 326736 340580 325560 325560 325560 325560 331828 323299 325560 325560 387722 325560 325560 325560 324598 325560 328726 325560 325043 325560 325806 325560 325560 387732 349729 332202 305442 329537 327055 356245 328451 307062 325560 331345 325560 331824 325560 325685 325560 404480 325560 325560 318314 325560 325560 325560 311807 337724 326431 327556 325560 356850 325560 325560 325560 322741 310902 324295 325560 326156 326960 325560 333411 297761 325560 325536 325560 325762 327957 325560 325560 318521 325560 319775 325560 325560 332128 325560 325486 325560 325838 325560 325560 325560 331767 325560 324523 339995 325560 325560 319582 325560 325560 307245 325560 317967 331488 335452 325560 334184 313213 325560 325560 325560 325560 348678 328727 325560 325560 325560 387978 325560 336704 325560 325560 325560 322076 325560 334272 338197 325560 321024 322145 325560 325560 323351 325560 327748 325560 325560 328157 325560 311594 325560 335962 372426 325560 319844 355822 325560 325560 325560 325560 324047 311464 325560 325560 353417 325590 325560 328576 326126 325560 325560 369376 325560 332013 325871 342165 324967 314832 325557 325560 325560 325560 325560 325560 325560 322649 325560 325560 325560 325560 325560 325560 325560 324598 325567 325560 324005 325560 325748 323385 315409 325560 325560 325560 325560 325560 312275 325560 325560 325560 320576 325246 332961 323010 325560 325560 345253 325560 325560 325560 325559 325560 325560 319634 319951 325560 325560 325560 325560 325560 325560 318519 343222 317234 325560 325560 314025 320249 325560 325560 325560 349365 289197 325560 329245 240869 327182 322876 323117 306351 335137 308271 301731 382409 279230 298731 243650 532682 319771 171493 347262 343945 311874 302211 316708 333463 344282 319635 301186 300381 318765 286146 306844 307705 312448 299715 373399 299446 325586 291221 261173 255027 -78375 -58143 227033 235098 21267 238675 197687 418341 -297706 | |||||||||||||||||||||||||||||||||||||||||||||||||||||
Tables (Output of Computation) | |||||||||||||||||||||||||||||||||||||||||||||||||||||
| |||||||||||||||||||||||||||||||||||||||||||||||||||||
Figures (Output of Computation) | |||||||||||||||||||||||||||||||||||||||||||||||||||||
Input Parameters & R Code | |||||||||||||||||||||||||||||||||||||||||||||||||||||
| Parameters (Session): | |||||||||||||||||||||||||||||||||||||||||||||||||||||
| par1 = 0 ; par2 = 0 ; | |||||||||||||||||||||||||||||||||||||||||||||||||||||
| Parameters (R input): | |||||||||||||||||||||||||||||||||||||||||||||||||||||
| par1 = 0 ; par2 = 0 ; | |||||||||||||||||||||||||||||||||||||||||||||||||||||
| R code (references can be found in the software module): | |||||||||||||||||||||||||||||||||||||||||||||||||||||
par1 <- as.numeric(par1) | |||||||||||||||||||||||||||||||||||||||||||||||||||||