Free Statistics
of Irreproducible Research!
Description of Statistical Computation | |||||||||||||||||||||||||||||||||
|---|---|---|---|---|---|---|---|---|---|---|---|---|---|---|---|---|---|---|---|---|---|---|---|---|---|---|---|---|---|---|---|---|---|
| Author's title | |||||||||||||||||||||||||||||||||
| Author | *Unverified author* | ||||||||||||||||||||||||||||||||
| R Software Module | rwasp_density.wasp | ||||||||||||||||||||||||||||||||
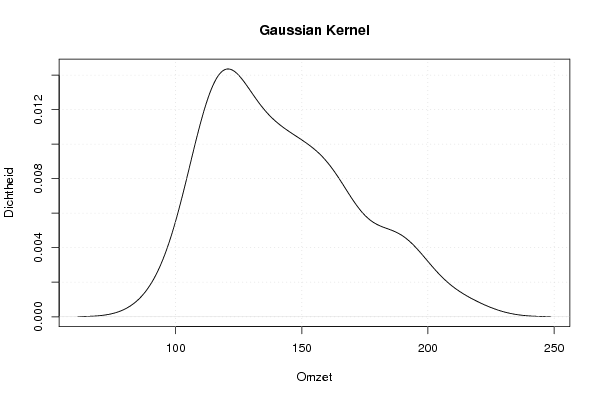
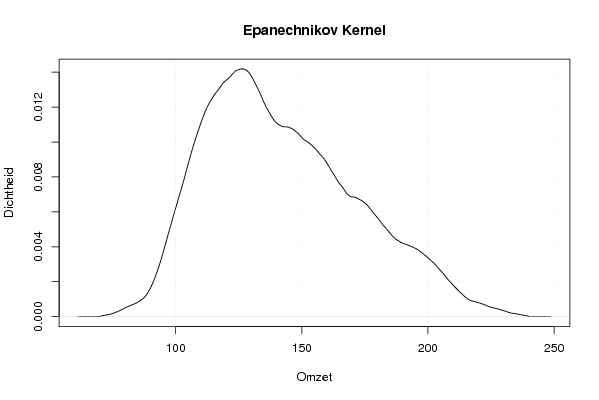
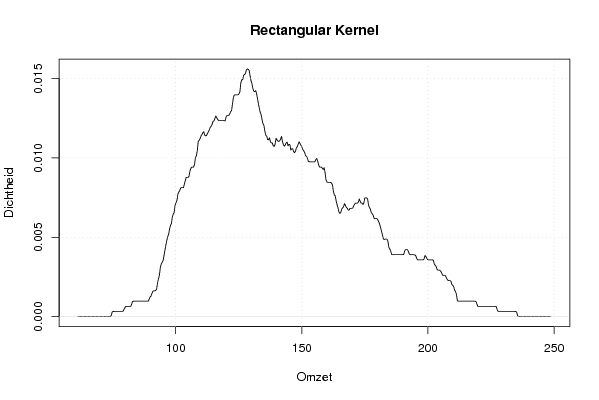
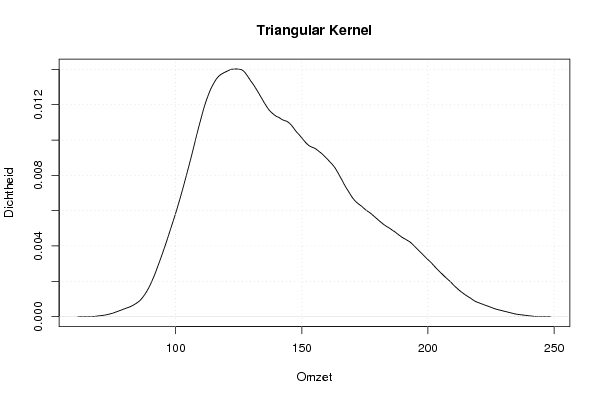
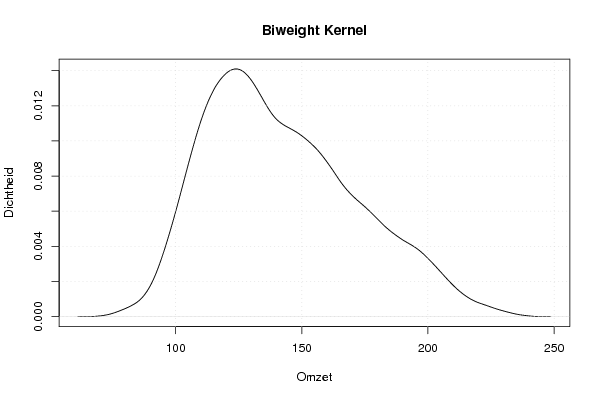
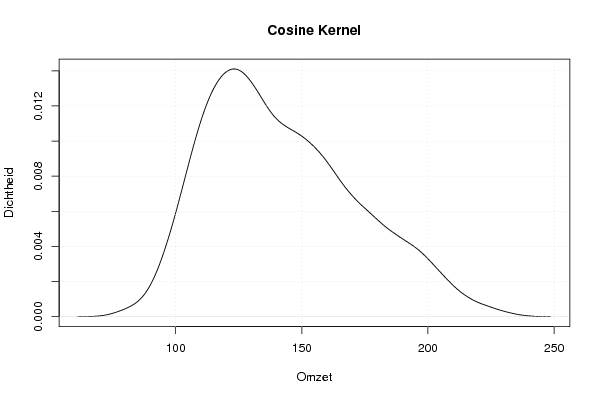
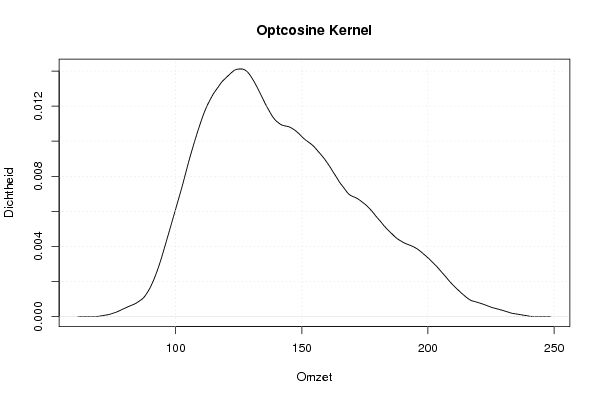
| Title produced by software | Kernel Density Estimation | ||||||||||||||||||||||||||||||||
| Date of computation | Sun, 15 Aug 2010 12:36:45 +0000 | ||||||||||||||||||||||||||||||||
| Cite this page as follows | Statistical Computations at FreeStatistics.org, Office for Research Development and Education, URL https://freestatistics.org/blog/index.php?v=date/2010/Aug/15/t12818758078pd9nhhpn5ge8c6.htm/, Retrieved Sun, 06 Jul 2025 12:42:11 +0000 | ||||||||||||||||||||||||||||||||
| Statistical Computations at FreeStatistics.org, Office for Research Development and Education, URL https://freestatistics.org/blog/index.php?pk=78841, Retrieved Sun, 06 Jul 2025 12:42:11 +0000 | |||||||||||||||||||||||||||||||||
| QR Codes: | |||||||||||||||||||||||||||||||||
|
| |||||||||||||||||||||||||||||||||
| Original text written by user: | |||||||||||||||||||||||||||||||||
| IsPrivate? | No (this computation is public) | ||||||||||||||||||||||||||||||||
| User-defined keywords | |||||||||||||||||||||||||||||||||
| Estimated Impact | 331 | ||||||||||||||||||||||||||||||||
Tree of Dependent Computations | |||||||||||||||||||||||||||||||||
| Family? (F = Feedback message, R = changed R code, M = changed R Module, P = changed Parameters, D = changed Data) | |||||||||||||||||||||||||||||||||
| - [Univariate Data Series] [Auto productie] [2010-02-25 15:21:10] [268ea95fef628aaa77b5f343b7444613] - R PD [Univariate Data Series] [Omzet product X] [2010-07-23 11:33:23] [f5ecd041e4b32af12787a4e421b18aaf] - P [Univariate Data Series] [Omzet product X] [2010-07-23 11:36:31] [f5ecd041e4b32af12787a4e421b18aaf] - RMP [Histogram] [Histogram omzet p...] [2010-07-23 11:52:23] [f5ecd041e4b32af12787a4e421b18aaf] - [Histogram] [Histogram omzet p...] [2010-08-15 12:32:40] [f5ecd041e4b32af12787a4e421b18aaf] - RMPD [Kernel Density Estimation] [Dichtheidsgrafiek...] [2010-08-15 12:36:45] [05b8da000f2ebbd12b039a4b088dd3f2] [Current] - RMP [Notched Boxplots] [Notched Boxplots ...] [2010-08-15 12:46:09] [f5ecd041e4b32af12787a4e421b18aaf] - RMP [Harrell-Davis Quantiles] [Harell-Davis Deci...] [2010-08-15 12:57:46] [f5ecd041e4b32af12787a4e421b18aaf] - P [Harrell-Davis Quantiles] [Harell-Davis Deci...] [2010-08-15 13:06:36] [f5ecd041e4b32af12787a4e421b18aaf] - [Harrell-Davis Quantiles] [Harell-Davis Perc...] [2010-08-15 13:10:56] [f5ecd041e4b32af12787a4e421b18aaf] - RMPD [Central Tendency] [Centrummaten omze...] [2010-08-15 13:20:01] [f5ecd041e4b32af12787a4e421b18aaf] | |||||||||||||||||||||||||||||||||
| Feedback Forum | |||||||||||||||||||||||||||||||||
Post a new message | |||||||||||||||||||||||||||||||||
Dataset | |||||||||||||||||||||||||||||||||
| Dataseries X: | |||||||||||||||||||||||||||||||||
118 117 116 114 112 111 112 114 115 115 116 118 126 131 122 124 119 112 109 108 117 122 127 124 129 141 127 133 114 98 93 101 111 128 126 134 140 158 144 146 138 119 113 120 127 141 144 150 156 174 163 167 160 141 132 144 155 164 162 181 187 209 189 201 193 177 159 158 155 164 163 185 191 217 193 192 184 166 145 146 138 149 145 166 | |||||||||||||||||||||||||||||||||
Tables (Output of Computation) | |||||||||||||||||||||||||||||||||
| |||||||||||||||||||||||||||||||||
Figures (Output of Computation) | |||||||||||||||||||||||||||||||||
Input Parameters & R Code | |||||||||||||||||||||||||||||||||
| Parameters (Session): | |||||||||||||||||||||||||||||||||
| par1 = 0 ; | |||||||||||||||||||||||||||||||||
| Parameters (R input): | |||||||||||||||||||||||||||||||||
| par1 = 0 ; | |||||||||||||||||||||||||||||||||
| R code (references can be found in the software module): | |||||||||||||||||||||||||||||||||
if (par1 == '0') bw <- 'nrd0' | |||||||||||||||||||||||||||||||||