WS3 Yt/Xt assumpties | ||||||||||||||||||||||||||||||||||||||||||||||||||||||||||||
| *The author of this computation has been verified* | ||||||||||||||||||||||||||||||||||||||||||||||||||||||||||||
| R Software Module: rwasp_edauni.wasp (opens new window with default values) | ||||||||||||||||||||||||||||||||||||||||||||||||||||||||||||
| Title produced by software: Univariate Explorative Data Analysis | ||||||||||||||||||||||||||||||||||||||||||||||||||||||||||||
| Date of computation: Tue, 27 Oct 2009 19:40:53 -0600 | ||||||||||||||||||||||||||||||||||||||||||||||||||||||||||||
| Cite this page as follows: | ||||||||||||||||||||||||||||||||||||||||||||||||||||||||||||
| Statistical Computations at FreeStatistics.org, Office for Research Development and Education, URL http://www.freestatistics.org/blog/date/2009/Oct/28/t1256694143uhozzh9q18f9e96.htm/, Retrieved Wed, 28 Oct 2009 02:42:23 +0100 | ||||||||||||||||||||||||||||||||||||||||||||||||||||||||||||
| BibTeX entries for LaTeX users: | ||||||||||||||||||||||||||||||||||||||||||||||||||||||||||||
@Manual{KEY,
    author = {{YOUR NAME}},
    publisher = {Office for Research Development and Education},
    title = {Statistical Computations at FreeStatistics.org, URL http://www.freestatistics.org/blog/date/2009/Oct/28/t1256694143uhozzh9q18f9e96.htm/},
    year = {2009},
}
@Manual{R,
    title = {R: A Language and Environment for Statistical Computing},
    author = {{R Development Core Team}},
    organization = {R Foundation for Statistical Computing},
    address = {Vienna, Austria},
    year = {2009},
    note = {{ISBN} 3-900051-07-0},
    url = {http://www.R-project.org},
}
| ||||||||||||||||||||||||||||||||||||||||||||||||||||||||||||
| Original text written by user: | ||||||||||||||||||||||||||||||||||||||||||||||||||||||||||||
| IsPrivate? | ||||||||||||||||||||||||||||||||||||||||||||||||||||||||||||
| No (this computation is public) | ||||||||||||||||||||||||||||||||||||||||||||||||||||||||||||
| User-defined keywords: | ||||||||||||||||||||||||||||||||||||||||||||||||||||||||||||
| assumpties | ||||||||||||||||||||||||||||||||||||||||||||||||||||||||||||
| Dataseries X: | ||||||||||||||||||||||||||||||||||||||||||||||||||||||||||||
| » Textbox « » Textfile « » CSV « | ||||||||||||||||||||||||||||||||||||||||||||||||||||||||||||
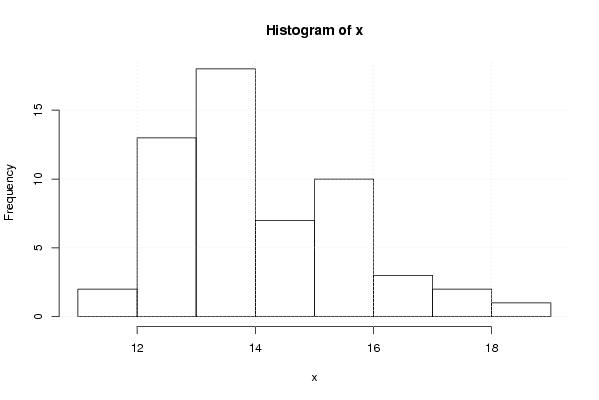
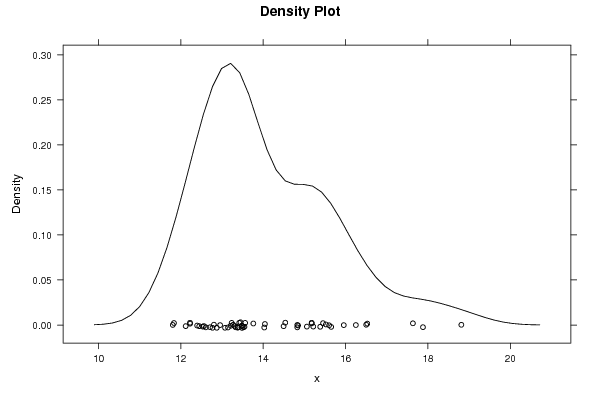
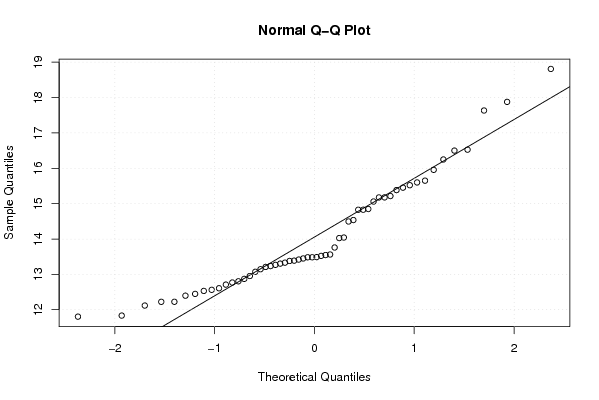
| 11.80352941 11.83372093 12.11764706 12.80365854 12.95308642 13.41772152 12.53139535 12.44712644 12.60689655 12.87176471 12.76904762 12.56235294 12.22298851 12.22413793 12.39651163 12.70941176 13.07228916 13.56125 13.30365854 13.48271605 13.2345679 13.26875 13.44936709 13.4835443 13.145 13.21 13.54556962 13.4875 14.04155844 15.05972222 14.536 14.84794521 15.52142857 15.65 15.95571429 15.38333333 15.17534247 15.6 16.52647059 17.634375 18.80983607 17.87846154 15.17662338 14.49493671 15.21466667 16.24927536 16.5 15.45217391 13.75974026 13.37875 13.3875 14.02597403 14.82739726 14.82702703 13.52222222 13.33012048 | ||||||||||||||||||||||||||||||||||||||||||||||||||||||||||||
| Output produced by software: | ||||||||||||||||||||||||||||||||||||||||||||||||||||||||||||
| Charts produced by software: |
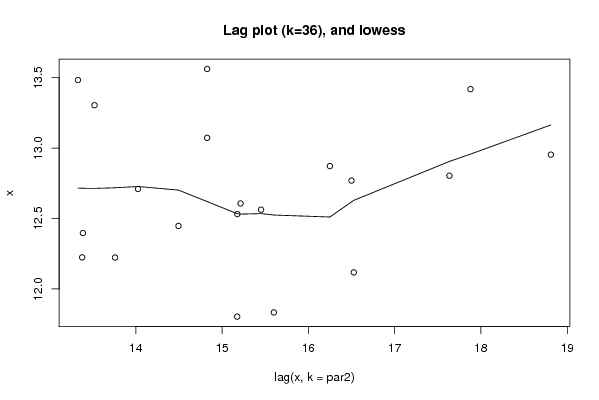
| Parameters (Session): | par1 = 0 ; | | Parameters (R input): | par1 = 0 ; par2 = 36 ; | | R code (references can be found in the software module): | par1 <- as.numeric(par1)
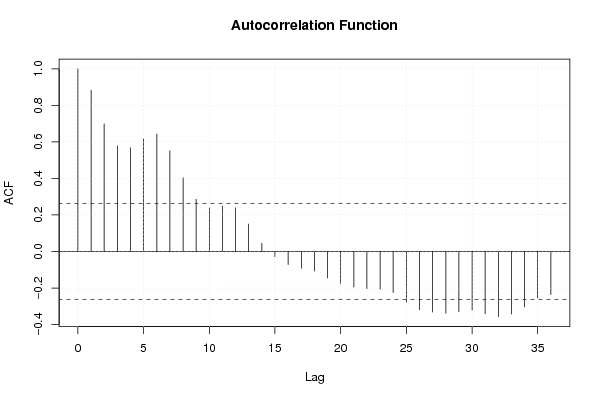
| par2 <- as.numeric(par2) x <- as.ts(x) library(lattice) bitmap(file='pic1.png') plot(x,type='l',main='Run Sequence Plot',xlab='time or index',ylab='value') grid() dev.off() bitmap(file='pic2.png') hist(x) grid() dev.off() bitmap(file='pic3.png') if (par1 > 0) { densityplot(~x,col='black',main=paste('Density Plot bw = ',par1),bw=par1) } else { densityplot(~x,col='black',main='Density Plot') } dev.off() bitmap(file='pic4.png') qqnorm(x) qqline(x) grid() dev.off() if (par2 > 0) { bitmap(file='lagplot1.png') dum <- cbind(lag(x,k=1),x) dum dum1 <- dum[2:length(x),] dum1 z <- as.data.frame(dum1) z plot(z,main='Lag plot (k=1), lowess, and regression line') lines(lowess(z)) abline(lm(z)) dev.off() if (par2 > 1) { bitmap(file='lagplotpar2.png') dum <- cbind(lag(x,k=par2),x) dum dum1 <- dum[(par2+1):length(x),] dum1 z <- as.data.frame(dum1) z mylagtitle <- 'Lag plot (k=' mylagtitle <- paste(mylagtitle,par2,sep='') mylagtitle <- paste(mylagtitle,'), and lowess',sep='') plot(z,main=mylagtitle) lines(lowess(z)) dev.off() } bitmap(file='pic5.png') acf(x,lag.max=par2,main='Autocorrelation Function') grid() dev.off() } summary(x) load(file='createtable') a<-table.start() a<-table.row.start(a) a<-table.element(a,'Descriptive Statistics',2,TRUE) a<-table.row.end(a) a<-table.row.start(a) a<-table.element(a,'# observations',header=TRUE) a<-table.element(a,length(x)) a<-table.row.end(a) a<-table.row.start(a) a<-table.element(a,'minimum',header=TRUE) a<-table.element(a,min(x)) a<-table.row.end(a) a<-table.row.start(a) a<-table.element(a,'Q1',header=TRUE) a<-table.element(a,quantile(x,0.25)) a<-table.row.end(a) a<-table.row.start(a) a<-table.element(a,'median',header=TRUE) a<-table.element(a,median(x)) a<-table.row.end(a) a<-table.row.start(a) a<-table.element(a,'mean',header=TRUE) a<-table.element(a,mean(x)) a<-table.row.end(a) a<-table.row.start(a) a<-table.element(a,'Q3',header=TRUE) a<-table.element(a,quantile(x,0.75)) a<-table.row.end(a) a<-table.row.start(a) a<-table.element(a,'maximum',header=TRUE) a<-table.element(a,max(x)) a<-table.row.end(a) a<-table.end(a) table.save(a,file='mytable.tab') | Copyright
Software written by Ed van Stee & Patrick Wessa Disclaimer Information provided on this web site is provided "AS IS" without warranty of any kind, either express or implied, including, without limitation, warranties of merchantability, fitness for a particular purpose, and noninfringement. We use reasonable efforts to include accurate and timely information and periodically update the information, and software without notice. However, we make no warranties or representations as to the accuracy or completeness of such information (or software), and we assume no liability or responsibility for errors or omissions in the content of this web site, or any software bugs in online applications. Your use of this web site is AT YOUR OWN RISK. Under no circumstances and under no legal theory shall we be liable to you or any other person for any direct, indirect, special, incidental, exemplary, or consequential damages arising from your access to, or use of, this web site. Privacy Policy We may request personal information to be submitted to our servers in order to be able to:
We NEVER allow other companies to directly offer registered users information about their products and services. Banner references and hyperlinks of third parties NEVER contain any personal data of the visitor. We do NOT sell, nor transmit by any means, personal information, nor statistical data series uploaded by you to third parties.
We store a unique ANONYMOUS USER ID in the form of a small 'Cookie' on your computer. This allows us to track your progress when using this website which is necessary to create state-dependent features. The cookie is used for NO OTHER PURPOSE. At any time you may opt to disallow cookies from this website - this will not affect other features of this website. We examine cookies that are used by third-parties (banner and online ads) very closely: abuse from third-parties automatically results in termination of the advertising contract without refund. We have very good reason to believe that the cookies that are produced by third parties (banner ads) do NOT cause any privacy or security risk. FreeStatistics.org is safe. There is no need to download any software to use the applications and services contained in this website. Hence, your system's security is not compromised by their use, and your personal data - other than data you submit in the account application form, and the user-agent information that is transmitted by your browser - is never transmitted to our servers. As a general rule, we do not log on-line behavior of individuals (other than normal logging of webserver 'hits'). However, in cases of abuse, hacking, unauthorized access, Denial of Service attacks, illegal copying, hotlinking, non-compliance with international webstandards (such as robots.txt), or any other harmful behavior, our system engineers are empowered to log, track, identify, publish, and ban misbehaving individuals - even if this leads to ban entire blocks of IP addresses, or disclosing user's identity. | ||||||||||||||||||||||||||||||||||||||||||||||||