workshop 4/part 2 | |||||||||||||||||||||||||||||||||||||||||||||||||||||||||||||||||||||
| *The author of this computation has been verified* | |||||||||||||||||||||||||||||||||||||||||||||||||||||||||||||||||||||
| R Software Module: rwasp_edabi.wasp (opens new window with default values) | |||||||||||||||||||||||||||||||||||||||||||||||||||||||||||||||||||||
| Title produced by software: Bivariate Explorative Data Analysis | |||||||||||||||||||||||||||||||||||||||||||||||||||||||||||||||||||||
| Date of computation: Tue, 27 Oct 2009 09:31:17 -0600 | |||||||||||||||||||||||||||||||||||||||||||||||||||||||||||||||||||||
| Cite this page as follows: | |||||||||||||||||||||||||||||||||||||||||||||||||||||||||||||||||||||
| Statistical Computations at FreeStatistics.org, Office for Research Development and Education, URL http://www.freestatistics.org/blog/date/2009/Oct/27/t1256657797im6n8zb75mw215j.htm/, Retrieved Tue, 27 Oct 2009 16:36:46 +0100 | |||||||||||||||||||||||||||||||||||||||||||||||||||||||||||||||||||||
| BibTeX entries for LaTeX users: | |||||||||||||||||||||||||||||||||||||||||||||||||||||||||||||||||||||
@Manual{KEY,
    author = {{YOUR NAME}},
    publisher = {Office for Research Development and Education},
    title = {Statistical Computations at FreeStatistics.org, URL http://www.freestatistics.org/blog/date/2009/Oct/27/t1256657797im6n8zb75mw215j.htm/},
    year = {2009},
}
@Manual{R,
    title = {R: A Language and Environment for Statistical Computing},
    author = {{R Development Core Team}},
    organization = {R Foundation for Statistical Computing},
    address = {Vienna, Austria},
    year = {2009},
    note = {{ISBN} 3-900051-07-0},
    url = {http://www.R-project.org},
}
| |||||||||||||||||||||||||||||||||||||||||||||||||||||||||||||||||||||
| Original text written by user: | |||||||||||||||||||||||||||||||||||||||||||||||||||||||||||||||||||||
| IsPrivate? | |||||||||||||||||||||||||||||||||||||||||||||||||||||||||||||||||||||
| No (this computation is public) | |||||||||||||||||||||||||||||||||||||||||||||||||||||||||||||||||||||
| User-defined keywords: | |||||||||||||||||||||||||||||||||||||||||||||||||||||||||||||||||||||
| Dataseries X: | |||||||||||||||||||||||||||||||||||||||||||||||||||||||||||||||||||||
| » Textbox « » Textfile « » CSV « | |||||||||||||||||||||||||||||||||||||||||||||||||||||||||||||||||||||
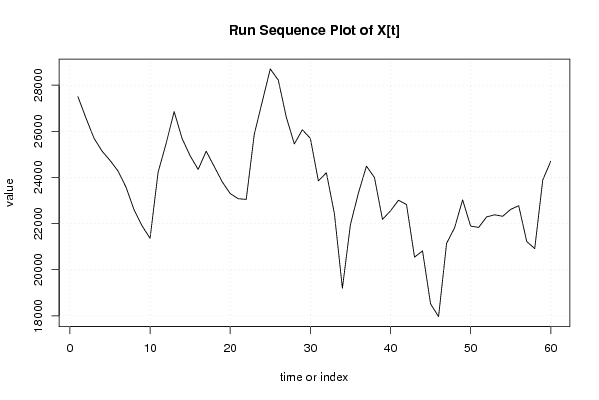
| 27501 26577 25705 25147 24740 24281 23577 22598 21903 21360 24226 25468 26858 25684 24938 24347 25137 24479 23810 23301 23076 23049 25870 27291 28706 28220 26612 25453 26066 25696 23851 24203 22433 19195 21955 23326 24490 23996 22181 22550 23013 22826 20544 20814 18518 17964 21139 21818 23028 21890 21833 22289 22380 22316 22614 22775 21221 20915 23889 24703 | |||||||||||||||||||||||||||||||||||||||||||||||||||||||||||||||||||||
| Dataseries Y: | |||||||||||||||||||||||||||||||||||||||||||||||||||||||||||||||||||||
| » Textbox « » Textfile « » CSV « | |||||||||||||||||||||||||||||||||||||||||||||||||||||||||||||||||||||
| 19139 18826 18660 18642 18738 18892 18800 18519 18219 17978 18647 18731 18919 18398 18261 18158 19344 19041 19092 18937 19049 19111 19942 20130 20346 19962 19649 19512 19987 19928 18893 19214 18623 16014 16698 17223 17058 17043 16458 16625 17247 17269 15895 16127 15247 15174 16309 16374 16255 16092 16395 16951 17202 17438 17594 17999 17375 17307 18496 18647 | |||||||||||||||||||||||||||||||||||||||||||||||||||||||||||||||||||||
| Output produced by software: | |||||||||||||||||||||||||||||||||||||||||||||||||||||||||||||||||||||
| Charts produced by software: |
| Parameters (Session): | par1 = 0 ; par2 = 36 ; | | Parameters (R input): | par1 = 0 ; par2 = 36 ; | | R code (references can be found in the software module): | par1 <- as.numeric(par1)
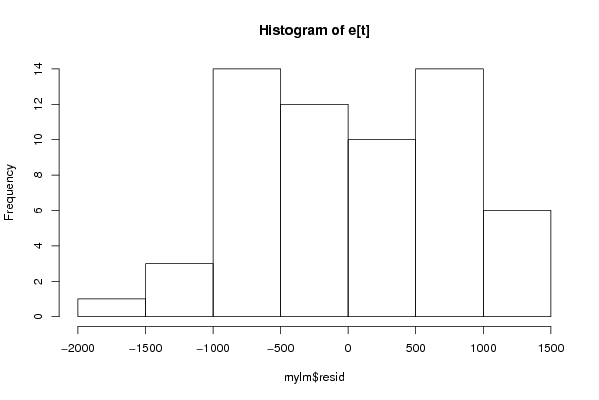
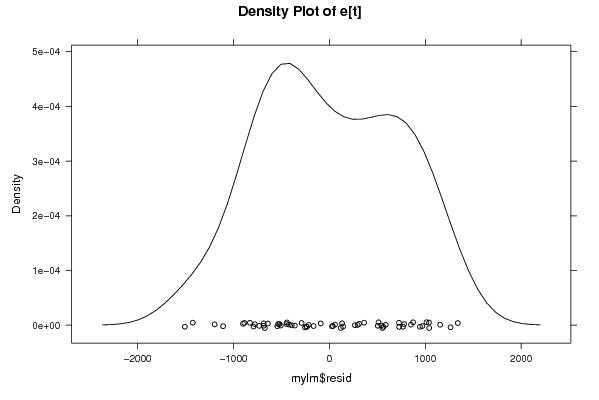
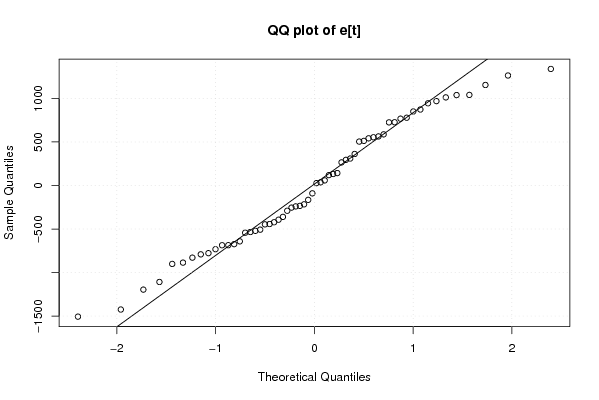
| par2 <- as.numeric(par2) x <- as.ts(x) y <- as.ts(y) mylm <- lm(y~x) cbind(mylm$resid) library(lattice) bitmap(file='pic1.png') plot(y,type='l',main='Run Sequence Plot of Y[t]',xlab='time or index',ylab='value') grid() dev.off() bitmap(file='pic1a.png') plot(x,type='l',main='Run Sequence Plot of X[t]',xlab='time or index',ylab='value') grid() dev.off() bitmap(file='pic1b.png') plot(x,y,main='Scatter Plot',xlab='X[t]',ylab='Y[t]') grid() dev.off() bitmap(file='pic1c.png') plot(mylm$resid,type='l',main='Run Sequence Plot of e[t]',xlab='time or index',ylab='value') grid() dev.off() bitmap(file='pic2.png') hist(mylm$resid,main='Histogram of e[t]') dev.off() bitmap(file='pic3.png') if (par1 > 0) { densityplot(~mylm$resid,col='black',main=paste('Density Plot of e[t] bw = ',par1),bw=par1) } else { densityplot(~mylm$resid,col='black',main='Density Plot of e[t]') } dev.off() bitmap(file='pic4.png') qqnorm(mylm$resid,main='QQ plot of e[t]') qqline(mylm$resid) grid() dev.off() if (par2 > 0) { bitmap(file='pic5.png') acf(mylm$resid,lag.max=par2,main='Residual Autocorrelation Function') grid() dev.off() } summary(x) load(file='createtable') a<-table.start() a<-table.row.start(a) a<-table.element(a,'Model: Y[t] = c + b X[t] + e[t]',2,TRUE) a<-table.row.end(a) a<-table.row.start(a) a<-table.element(a,'c',1,TRUE) a<-table.element(a,mylm$coeff[[1]]) a<-table.row.end(a) a<-table.row.start(a) a<-table.element(a,'b',1,TRUE) a<-table.element(a,mylm$coeff[[2]]) a<-table.row.end(a) a<-table.end(a) table.save(a,file='mytable.tab') a<-table.start() a<-table.row.start(a) a<-table.element(a,'Descriptive Statistics about e[t]',2,TRUE) a<-table.row.end(a) a<-table.row.start(a) a<-table.element(a,'# observations',header=TRUE) a<-table.element(a,length(mylm$resid)) a<-table.row.end(a) a<-table.row.start(a) a<-table.element(a,'minimum',header=TRUE) a<-table.element(a,min(mylm$resid)) a<-table.row.end(a) a<-table.row.start(a) a<-table.element(a,'Q1',header=TRUE) a<-table.element(a,quantile(mylm$resid,0.25)) a<-table.row.end(a) a<-table.row.start(a) a<-table.element(a,'median',header=TRUE) a<-table.element(a,median(mylm$resid)) a<-table.row.end(a) a<-table.row.start(a) a<-table.element(a,'mean',header=TRUE) a<-table.element(a,mean(mylm$resid)) a<-table.row.end(a) a<-table.row.start(a) a<-table.element(a,'Q3',header=TRUE) a<-table.element(a,quantile(mylm$resid,0.75)) a<-table.row.end(a) a<-table.row.start(a) a<-table.element(a,'maximum',header=TRUE) a<-table.element(a,max(mylm$resid)) a<-table.row.end(a) a<-table.end(a) table.save(a,file='mytable.tab') | Copyright
Software written by Ed van Stee & Patrick Wessa Disclaimer Information provided on this web site is provided "AS IS" without warranty of any kind, either express or implied, including, without limitation, warranties of merchantability, fitness for a particular purpose, and noninfringement. We use reasonable efforts to include accurate and timely information and periodically update the information, and software without notice. However, we make no warranties or representations as to the accuracy or completeness of such information (or software), and we assume no liability or responsibility for errors or omissions in the content of this web site, or any software bugs in online applications. Your use of this web site is AT YOUR OWN RISK. Under no circumstances and under no legal theory shall we be liable to you or any other person for any direct, indirect, special, incidental, exemplary, or consequential damages arising from your access to, or use of, this web site. Privacy Policy We may request personal information to be submitted to our servers in order to be able to:
We NEVER allow other companies to directly offer registered users information about their products and services. Banner references and hyperlinks of third parties NEVER contain any personal data of the visitor. We do NOT sell, nor transmit by any means, personal information, nor statistical data series uploaded by you to third parties.
We store a unique ANONYMOUS USER ID in the form of a small 'Cookie' on your computer. This allows us to track your progress when using this website which is necessary to create state-dependent features. The cookie is used for NO OTHER PURPOSE. At any time you may opt to disallow cookies from this website - this will not affect other features of this website. We examine cookies that are used by third-parties (banner and online ads) very closely: abuse from third-parties automatically results in termination of the advertising contract without refund. We have very good reason to believe that the cookies that are produced by third parties (banner ads) do NOT cause any privacy or security risk. FreeStatistics.org is safe. There is no need to download any software to use the applications and services contained in this website. Hence, your system's security is not compromised by their use, and your personal data - other than data you submit in the account application form, and the user-agent information that is transmitted by your browser - is never transmitted to our servers. As a general rule, we do not log on-line behavior of individuals (other than normal logging of webserver 'hits'). However, in cases of abuse, hacking, unauthorized access, Denial of Service attacks, illegal copying, hotlinking, non-compliance with international webstandards (such as robots.txt), or any other harmful behavior, our system engineers are empowered to log, track, identify, publish, and ban misbehaving individuals - even if this leads to ban entire blocks of IP addresses, or disclosing user's identity. | |||||||||||||||||||||||||||||||||||||||||||||||||||||||||