Free Statistics
of Irreproducible Research!
Description of Statistical Computation | |||||||||||||||||||||||||||||||||||||||||
|---|---|---|---|---|---|---|---|---|---|---|---|---|---|---|---|---|---|---|---|---|---|---|---|---|---|---|---|---|---|---|---|---|---|---|---|---|---|---|---|---|---|
| Author's title | |||||||||||||||||||||||||||||||||||||||||
| Author | *The author of this computation has been verified* | ||||||||||||||||||||||||||||||||||||||||
| R Software Module | rwasp_univariatedataseries.wasp | ||||||||||||||||||||||||||||||||||||||||
| Title produced by software | Univariate Data Series | ||||||||||||||||||||||||||||||||||||||||
| Date of computation | Sun, 11 Oct 2009 05:47:42 -0600 | ||||||||||||||||||||||||||||||||||||||||
| Cite this page as follows | Statistical Computations at FreeStatistics.org, Office for Research Development and Education, URL https://freestatistics.org/blog/index.php?v=date/2009/Oct/11/t1255261720jnmyjxlt9nvwemn.htm/, Retrieved Wed, 01 May 2024 20:39:29 +0000 | ||||||||||||||||||||||||||||||||||||||||
| Statistical Computations at FreeStatistics.org, Office for Research Development and Education, URL https://freestatistics.org/blog/index.php?pk=45272, Retrieved Wed, 01 May 2024 20:39:29 +0000 | |||||||||||||||||||||||||||||||||||||||||
| QR Codes: | |||||||||||||||||||||||||||||||||||||||||
|
| |||||||||||||||||||||||||||||||||||||||||
| Original text written by user: | |||||||||||||||||||||||||||||||||||||||||
| IsPrivate? | No (this computation is public) | ||||||||||||||||||||||||||||||||||||||||
| User-defined keywords | |||||||||||||||||||||||||||||||||||||||||
| Estimated Impact | 188 | ||||||||||||||||||||||||||||||||||||||||
Tree of Dependent Computations | |||||||||||||||||||||||||||||||||||||||||
| Family? (F = Feedback message, R = changed R code, M = changed R Module, P = changed Parameters, D = changed Data) | |||||||||||||||||||||||||||||||||||||||||
| - [Univariate Data Series] [Univariate Time S...] [2009-10-11 11:47:42] [2e4ef2c1b76db9b31c0a03b96e94ad77] [Current] - MPD [Univariate Data Series] [] [2009-12-03 18:10:42] [cf890101a20378422561610e0d41fd9c] - P [Univariate Data Series] [] [2009-12-03 18:19:08] [cf890101a20378422561610e0d41fd9c] - MPD [Univariate Data Series] [] [2009-12-03 18:16:41] [cf890101a20378422561610e0d41fd9c] - RMP [Univariate Explorative Data Analysis] [EDA univariaat] [2009-12-05 14:04:43] [6e4e01d7eb22a9f33d58ebb35753a195] | |||||||||||||||||||||||||||||||||||||||||
| Feedback Forum | |||||||||||||||||||||||||||||||||||||||||
Post a new message | |||||||||||||||||||||||||||||||||||||||||
Dataset | |||||||||||||||||||||||||||||||||||||||||
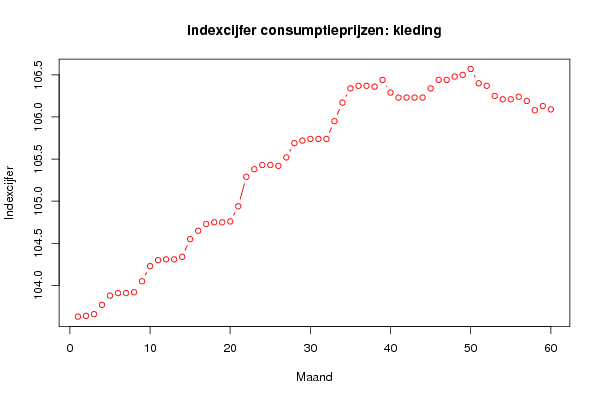
| Dataseries X: | |||||||||||||||||||||||||||||||||||||||||
103.63 103.64 103.66 103.77 103.88 103.91 103.91 103.92 104.05 104.23 104.3 104.31 104.31 104.34 104.55 104.65 104.73 104.75 104.75 104.76 104.94 105.29 105.38 105.43 105.43 105.42 105.52 105.69 105.72 105.74 105.74 105.74 105.95 106.17 106.34 106.37 106.37 106.36 106.44 106.29 106.23 106.23 106.23 106.23 106.34 106.44 106.44 106.48 106.5 106.57 106.4 106.37 106.25 106.21 106.21 106.24 106.19 106.08 106.13 106.09 | |||||||||||||||||||||||||||||||||||||||||
Tables (Output of Computation) | |||||||||||||||||||||||||||||||||||||||||
| |||||||||||||||||||||||||||||||||||||||||
Figures (Output of Computation) | |||||||||||||||||||||||||||||||||||||||||
Input Parameters & R Code | |||||||||||||||||||||||||||||||||||||||||
| Parameters (Session): | |||||||||||||||||||||||||||||||||||||||||
| par1 = Univariate time series ; par2 = www.nbb.be/belgostat/PresentationLinker?TableId=51000059&Lang=N ; par3 = Maandelijks Indexcijfer van de consumptieprijzen per groep van producten: Bovenkleding (Heren,Dames,Kinderen) periode 01/2001 t.e.m. 12/2005 ; | |||||||||||||||||||||||||||||||||||||||||
| Parameters (R input): | |||||||||||||||||||||||||||||||||||||||||
| par1 = Univariate time series ; par2 = www.nbb.be/belgostat/PresentationLinker?TableId=51000059&Lang=N ; par3 = Maandelijks Indexcijfer van de consumptieprijzen per groep van producten: Bovenkleding (Heren,Dames,Kinderen) periode 01/2001 t.e.m. 12/2005 ; | |||||||||||||||||||||||||||||||||||||||||
| R code (references can be found in the software module): | |||||||||||||||||||||||||||||||||||||||||
bitmap(file='test1.png') | |||||||||||||||||||||||||||||||||||||||||