Free Statistics

of Irreproducible Research!

Author's title

Author*The author of this computation has been verified*
R Software Modulerwasp_multipleregression.wasp
Title produced by softwareMultiple Regression
Date of computationSat, 28 Nov 2009 01:31:03 -0700
Cite this page as followsStatistical Computations at FreeStatistics.org, Office for Research Development and Education, URL https://freestatistics.org/blog/index.php?v=date/2009/Nov/28/t1259397123odjx7i27ay7l4vm.htm/, Retrieved Sat, 27 Apr 2024 13:15:38 +0000
Statistical Computations at FreeStatistics.org, Office for Research Development and Education, URL https://freestatistics.org/blog/index.php?pk=61373, Retrieved Sat, 27 Apr 2024 13:15:38 +0000
QR Codes:

Original text written by user:
IsPrivate?No (this computation is public)
User-defined keywords
Estimated Impact164
Family? (F = Feedback message, R = changed R code, M = changed R Module, P = changed Parameters, D = changed Data)
-     [Multiple Regression] [Q1 The Seatbeltlaw] [2007-11-14 19:27:43] [8cd6641b921d30ebe00b648d1481bba0]
- RMPD  [Multiple Regression] [Seatbelt] [2009-11-12 13:54:52] [b98453cac15ba1066b407e146608df68]
-    D    [Multiple Regression] [Workshop 7] [2009-11-19 16:33:52] [85be98bd9ebcfd4d73e77f8552419c9a]
-    D      [Multiple Regression] [1e link] [2009-11-20 15:40:59] [4fe1472705bb0a32f118ba3ca90ffa8e]
-   PD          [Multiple Regression] [2e link] [2009-11-28 08:31:03] [ee8fc1691ecec7724e0ca78f0c288737] [Current]
Feedback Forum

Post a new message
Dataseries X:
130	0
136.7	0
138.1	0
139.5	0
140.4	0
144.6	0
151.4	0
147.9	0
141.5	0
143.8	0
143.6	0
150.5	0
150.1	0
154.9	0
162.1	0
176.7	0
186.6	0
194.8	0
196.3	0
228.8	0
267.2	0
237.2	0
254.7	0
258.2	0
257.9	0
269.6	0
266.9	0
269.6	0
253.9	0
258.6	0
274.2	0
301.5	0
304.5	0
285.1	0
287.7	0
265.5	0
264.1	0
276.1	0
258.9	0
239.1	0
250.1	1
276.8	1
297.6	1
295.4	1
283	1
275.8	1
279.7	1
254.6	1
234.6	1
176.9	1
148.1	1
122.7	1
124.9	1
121.6	1
128.4	1
144.5	1
151.8	1
167.1	1
173.8	1
203.7	1
199.8	1


Summary of computational transaction
Raw Inputview raw input (R code)
Raw Outputview raw output of R engine
Computing time8 seconds
R Server'Gwilym Jenkins' @ 72.249.127.135

\begin{tabular}{lllllllll}
\hline
Summary of computational transaction \tabularnewline
Raw Input & view raw input (R code)  \tabularnewline
Raw Output & view raw output of R engine  \tabularnewline
Computing time & 8 seconds \tabularnewline
R Server & 'Gwilym Jenkins' @ 72.249.127.135 \tabularnewline
\hline
\end{tabular}
%Source: https://freestatistics.org/blog/index.php?pk=61373&T=0

[TABLE]
[ROW][C]Summary of computational transaction[/C][/ROW]
[ROW][C]Raw Input[/C][C]view raw input (R code) [/C][/ROW]
[ROW][C]Raw Output[/C][C]view raw output of R engine [/C][/ROW]
[ROW][C]Computing time[/C][C]8 seconds[/C][/ROW]
[ROW][C]R Server[/C][C]'Gwilym Jenkins' @ 72.249.127.135[/C][/ROW]
[/TABLE]
Source: https://freestatistics.org/blog/index.php?pk=61373&T=0

Globally Unique Identifier (entire table): ba.freestatistics.org/blog/index.php?pk=61373&T=0

As an alternative you can also use a QR Code:  

The GUIDs for individual cells are displayed in the table below:

Summary of computational transaction
Raw Inputview raw input (R code)
Raw Outputview raw output of R engine
Computing time8 seconds
R Server'Gwilym Jenkins' @ 72.249.127.135


Multiple Linear Regression - Estimated Regression Equation
Y(t)[t] = + 230.921 -11.0525`X(t)`[t] -21.1535M1[t] -25.8705000000001M2[t] -33.8905000000000M3[t] -39.1905000000001M4[t] -35.3200M5[t] -27.2200000000001M6[t] -16.9200000000001M7[t] -2.88000000000004M8[t] + 3.09999999999996M9[t] -4.70000000000003M10[t] + 1.39999999999995M11[t] + e[t]

\begin{tabular}{lllllllll}
\hline
Multiple Linear Regression - Estimated Regression Equation \tabularnewline
Y(t)[t] =  +  230.921 -11.0525`X(t)`[t] -21.1535M1[t] -25.8705000000001M2[t] -33.8905000000000M3[t] -39.1905000000001M4[t] -35.3200M5[t] -27.2200000000001M6[t] -16.9200000000001M7[t] -2.88000000000004M8[t] +  3.09999999999996M9[t] -4.70000000000003M10[t] +  1.39999999999995M11[t]  + e[t] \tabularnewline
\hline
\end{tabular}
%Source: https://freestatistics.org/blog/index.php?pk=61373&T=1

[TABLE]
[ROW][C]Multiple Linear Regression - Estimated Regression Equation[/C][/ROW]
[ROW][C]Y(t)[t] =  +  230.921 -11.0525`X(t)`[t] -21.1535M1[t] -25.8705000000001M2[t] -33.8905000000000M3[t] -39.1905000000001M4[t] -35.3200M5[t] -27.2200000000001M6[t] -16.9200000000001M7[t] -2.88000000000004M8[t] +  3.09999999999996M9[t] -4.70000000000003M10[t] +  1.39999999999995M11[t]  + e[t][/C][/ROW]
[/TABLE]
Source: https://freestatistics.org/blog/index.php?pk=61373&T=1

Globally Unique Identifier (entire table): ba.freestatistics.org/blog/index.php?pk=61373&T=1

As an alternative you can also use a QR Code:  

The GUIDs for individual cells are displayed in the table below:

Multiple Linear Regression - Estimated Regression Equation
Y(t)[t] = + 230.921 -11.0525`X(t)`[t] -21.1535M1[t] -25.8705000000001M2[t] -33.8905000000000M3[t] -39.1905000000001M4[t] -35.3200M5[t] -27.2200000000001M6[t] -16.9200000000001M7[t] -2.88000000000004M8[t] + 3.09999999999996M9[t] -4.70000000000003M10[t] + 1.39999999999995M11[t] + e[t]


Multiple Linear Regression - Ordinary Least Squares
VariableParameterS.D.T-STATH0: parameter = 02-tail p-value1-tail p-value
(Intercept)230.92130.3075377.619300
`X(t)`-11.052518.02658-0.61310.542690.271345
M1-21.153539.876382-0.53050.5982270.299114
M2-25.870500000000141.786427-0.61910.538770.269385
M3-33.890500000000041.786427-0.8110.4213460.210673
M4-39.190500000000141.786427-0.93790.3530030.176502
M5-35.320041.630604-0.84840.4004180.200209
M6-27.220000000000141.630604-0.65380.5163310.258166
M7-16.920000000000141.630604-0.40640.6862320.343116
M8-2.8800000000000441.630604-0.06920.9451340.472567
M93.0999999999999641.6306040.07450.940950.470475
M10-4.7000000000000341.630604-0.11290.9105830.455291
M111.3999999999999541.6306040.03360.9733120.486656

\begin{tabular}{lllllllll}
\hline
Multiple Linear Regression - Ordinary Least Squares \tabularnewline
Variable & Parameter & S.D. & T-STATH0: parameter = 0 & 2-tail p-value & 1-tail p-value \tabularnewline
(Intercept) & 230.921 & 30.307537 & 7.6193 & 0 & 0 \tabularnewline
`X(t)` & -11.0525 & 18.02658 & -0.6131 & 0.54269 & 0.271345 \tabularnewline
M1 & -21.1535 & 39.876382 & -0.5305 & 0.598227 & 0.299114 \tabularnewline
M2 & -25.8705000000001 & 41.786427 & -0.6191 & 0.53877 & 0.269385 \tabularnewline
M3 & -33.8905000000000 & 41.786427 & -0.811 & 0.421346 & 0.210673 \tabularnewline
M4 & -39.1905000000001 & 41.786427 & -0.9379 & 0.353003 & 0.176502 \tabularnewline
M5 & -35.3200 & 41.630604 & -0.8484 & 0.400418 & 0.200209 \tabularnewline
M6 & -27.2200000000001 & 41.630604 & -0.6538 & 0.516331 & 0.258166 \tabularnewline
M7 & -16.9200000000001 & 41.630604 & -0.4064 & 0.686232 & 0.343116 \tabularnewline
M8 & -2.88000000000004 & 41.630604 & -0.0692 & 0.945134 & 0.472567 \tabularnewline
M9 & 3.09999999999996 & 41.630604 & 0.0745 & 0.94095 & 0.470475 \tabularnewline
M10 & -4.70000000000003 & 41.630604 & -0.1129 & 0.910583 & 0.455291 \tabularnewline
M11 & 1.39999999999995 & 41.630604 & 0.0336 & 0.973312 & 0.486656 \tabularnewline
\hline
\end{tabular}
%Source: https://freestatistics.org/blog/index.php?pk=61373&T=2

[TABLE]
[ROW][C]Multiple Linear Regression - Ordinary Least Squares[/C][/ROW]
[ROW][C]Variable[/C][C]Parameter[/C][C]S.D.[/C][C]T-STATH0: parameter = 0[/C][C]2-tail p-value[/C][C]1-tail p-value[/C][/ROW]
[ROW][C](Intercept)[/C][C]230.921[/C][C]30.307537[/C][C]7.6193[/C][C]0[/C][C]0[/C][/ROW]
[ROW][C]`X(t)`[/C][C]-11.0525[/C][C]18.02658[/C][C]-0.6131[/C][C]0.54269[/C][C]0.271345[/C][/ROW]
[ROW][C]M1[/C][C]-21.1535[/C][C]39.876382[/C][C]-0.5305[/C][C]0.598227[/C][C]0.299114[/C][/ROW]
[ROW][C]M2[/C][C]-25.8705000000001[/C][C]41.786427[/C][C]-0.6191[/C][C]0.53877[/C][C]0.269385[/C][/ROW]
[ROW][C]M3[/C][C]-33.8905000000000[/C][C]41.786427[/C][C]-0.811[/C][C]0.421346[/C][C]0.210673[/C][/ROW]
[ROW][C]M4[/C][C]-39.1905000000001[/C][C]41.786427[/C][C]-0.9379[/C][C]0.353003[/C][C]0.176502[/C][/ROW]
[ROW][C]M5[/C][C]-35.3200[/C][C]41.630604[/C][C]-0.8484[/C][C]0.400418[/C][C]0.200209[/C][/ROW]
[ROW][C]M6[/C][C]-27.2200000000001[/C][C]41.630604[/C][C]-0.6538[/C][C]0.516331[/C][C]0.258166[/C][/ROW]
[ROW][C]M7[/C][C]-16.9200000000001[/C][C]41.630604[/C][C]-0.4064[/C][C]0.686232[/C][C]0.343116[/C][/ROW]
[ROW][C]M8[/C][C]-2.88000000000004[/C][C]41.630604[/C][C]-0.0692[/C][C]0.945134[/C][C]0.472567[/C][/ROW]
[ROW][C]M9[/C][C]3.09999999999996[/C][C]41.630604[/C][C]0.0745[/C][C]0.94095[/C][C]0.470475[/C][/ROW]
[ROW][C]M10[/C][C]-4.70000000000003[/C][C]41.630604[/C][C]-0.1129[/C][C]0.910583[/C][C]0.455291[/C][/ROW]
[ROW][C]M11[/C][C]1.39999999999995[/C][C]41.630604[/C][C]0.0336[/C][C]0.973312[/C][C]0.486656[/C][/ROW]
[/TABLE]
Source: https://freestatistics.org/blog/index.php?pk=61373&T=2

Globally Unique Identifier (entire table): ba.freestatistics.org/blog/index.php?pk=61373&T=2

As an alternative you can also use a QR Code:  

The GUIDs for individual cells are displayed in the table below:

Multiple Linear Regression - Ordinary Least Squares
VariableParameterS.D.T-STATH0: parameter = 02-tail p-value1-tail p-value
(Intercept)230.92130.3075377.619300
`X(t)`-11.052518.02658-0.61310.542690.271345
M1-21.153539.876382-0.53050.5982270.299114
M2-25.870500000000141.786427-0.61910.538770.269385
M3-33.890500000000041.786427-0.8110.4213460.210673
M4-39.190500000000141.786427-0.93790.3530030.176502
M5-35.320041.630604-0.84840.4004180.200209
M6-27.220000000000141.630604-0.65380.5163310.258166
M7-16.920000000000141.630604-0.40640.6862320.343116
M8-2.8800000000000441.630604-0.06920.9451340.472567
M93.0999999999999641.6306040.07450.940950.470475
M10-4.7000000000000341.630604-0.11290.9105830.455291
M111.3999999999999541.6306040.03360.9733120.486656


Multiple Linear Regression - Regression Statistics
Multiple R0.251803141451954
R-squared0.0634048220450726
Adjusted R-squared-0.170743972443659
F-TEST (value)0.270788590577706
F-TEST (DF numerator)12
F-TEST (DF denominator)48
p-value0.99130205130104
Multiple Linear Regression - Residual Statistics
Residual Standard Deviation65.8237637955194
Sum Squared Residuals207972.85825

\begin{tabular}{lllllllll}
\hline
Multiple Linear Regression - Regression Statistics \tabularnewline
Multiple R & 0.251803141451954 \tabularnewline
R-squared & 0.0634048220450726 \tabularnewline
Adjusted R-squared & -0.170743972443659 \tabularnewline
F-TEST (value) & 0.270788590577706 \tabularnewline
F-TEST (DF numerator) & 12 \tabularnewline
F-TEST (DF denominator) & 48 \tabularnewline
p-value & 0.99130205130104 \tabularnewline
Multiple Linear Regression - Residual Statistics \tabularnewline
Residual Standard Deviation & 65.8237637955194 \tabularnewline
Sum Squared Residuals & 207972.85825 \tabularnewline
\hline
\end{tabular}
%Source: https://freestatistics.org/blog/index.php?pk=61373&T=3

[TABLE]
[ROW][C]Multiple Linear Regression - Regression Statistics[/C][/ROW]
[ROW][C]Multiple R[/C][C]0.251803141451954[/C][/ROW]
[ROW][C]R-squared[/C][C]0.0634048220450726[/C][/ROW]
[ROW][C]Adjusted R-squared[/C][C]-0.170743972443659[/C][/ROW]
[ROW][C]F-TEST (value)[/C][C]0.270788590577706[/C][/ROW]
[ROW][C]F-TEST (DF numerator)[/C][C]12[/C][/ROW]
[ROW][C]F-TEST (DF denominator)[/C][C]48[/C][/ROW]
[ROW][C]p-value[/C][C]0.99130205130104[/C][/ROW]
[ROW][C]Multiple Linear Regression - Residual Statistics[/C][/ROW]
[ROW][C]Residual Standard Deviation[/C][C]65.8237637955194[/C][/ROW]
[ROW][C]Sum Squared Residuals[/C][C]207972.85825[/C][/ROW]
[/TABLE]
Source: https://freestatistics.org/blog/index.php?pk=61373&T=3

Globally Unique Identifier (entire table): ba.freestatistics.org/blog/index.php?pk=61373&T=3

As an alternative you can also use a QR Code:  

The GUIDs for individual cells are displayed in the table below:

Multiple Linear Regression - Regression Statistics
Multiple R0.251803141451954
R-squared0.0634048220450726
Adjusted R-squared-0.170743972443659
F-TEST (value)0.270788590577706
F-TEST (DF numerator)12
F-TEST (DF denominator)48
p-value0.99130205130104
Multiple Linear Regression - Residual Statistics
Residual Standard Deviation65.8237637955194
Sum Squared Residuals207972.85825


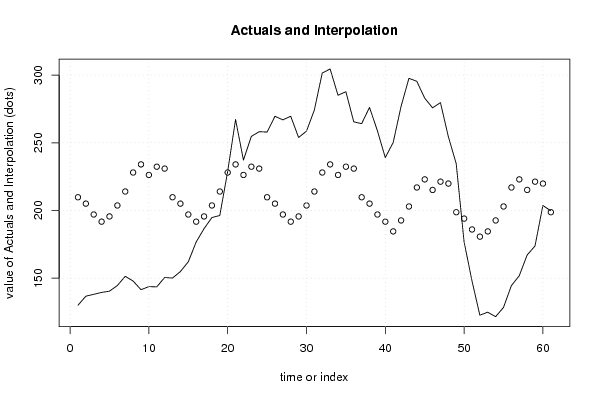
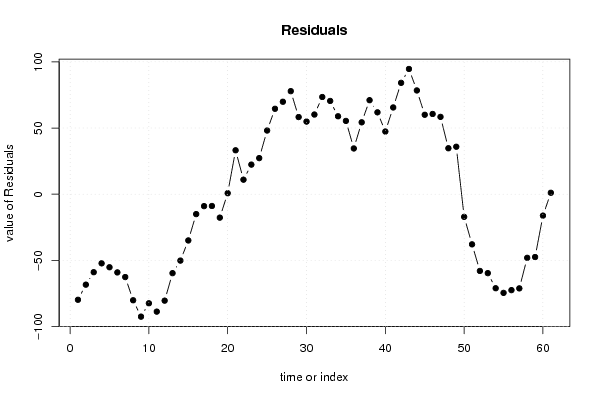
Multiple Linear Regression - Actuals, Interpolation, and Residuals
Time or IndexActualsInterpolationForecastResidualsPrediction Error
1130209.767500000000-79.7674999999997
2136.7205.0505-68.3505000000001
3138.1197.0305-58.9305
4139.5191.7305-52.2304999999999
5140.4195.601-55.2010000000001
6144.6203.701-59.101
7151.4214.001-62.601
8147.9228.041-80.141
9141.5234.021-92.521
10143.8226.221-82.421
11143.6232.321-88.721
12150.5230.921-80.421
13150.1209.7675-59.6675000000001
14154.9205.0505-50.1505
15162.1197.0305-34.9305
16176.7191.7305-15.0305
17186.6195.601-9.00100000000002
18194.8203.701-8.901
19196.3214.001-17.701
20228.8228.0410.759000000000011
21267.2234.02133.179
22237.2226.22110.9790000000000
23254.7232.32122.379
24258.2230.92127.2790000000000
25257.9209.767548.1324999999999
26269.6205.050564.5495
27266.9197.030569.8695
28269.6191.730577.8695
29253.9195.60158.299
30258.6203.70154.899
31274.2214.00160.199
32301.5228.04173.459
33304.5234.02170.479
34285.1226.22158.879
35287.7232.32155.3789999999999
36265.5230.92134.5789999999999
37264.1209.767554.3324999999999
38276.1205.050571.0495
39258.9197.030561.8695
40239.1191.730547.3695
41250.1184.548565.5515
42276.8192.648584.1515
43297.6202.948594.6515
44295.4216.988578.4115
45283222.968560.0315
46275.8215.168560.6315
47279.7221.268558.4315
48254.6219.868534.7315
49234.6198.71535.8849999999999
50176.9193.998-17.0980000000000
51148.1185.978-37.8780000000000
52122.7180.678-57.978
53124.9184.5485-59.6485
54121.6192.6485-71.0485
55128.4202.9485-74.5485
56144.5216.9885-72.4885
57151.8222.9685-71.1685
58167.1215.1685-48.0685
59173.8221.2685-47.4685
60203.7219.8685-16.1685000000000
61199.8198.7151.08499999999997

\begin{tabular}{lllllllll}
\hline
Multiple Linear Regression - Actuals, Interpolation, and Residuals \tabularnewline
Time or Index & Actuals & InterpolationForecast & ResidualsPrediction Error \tabularnewline
1 & 130 & 209.767500000000 & -79.7674999999997 \tabularnewline
2 & 136.7 & 205.0505 & -68.3505000000001 \tabularnewline
3 & 138.1 & 197.0305 & -58.9305 \tabularnewline
4 & 139.5 & 191.7305 & -52.2304999999999 \tabularnewline
5 & 140.4 & 195.601 & -55.2010000000001 \tabularnewline
6 & 144.6 & 203.701 & -59.101 \tabularnewline
7 & 151.4 & 214.001 & -62.601 \tabularnewline
8 & 147.9 & 228.041 & -80.141 \tabularnewline
9 & 141.5 & 234.021 & -92.521 \tabularnewline
10 & 143.8 & 226.221 & -82.421 \tabularnewline
11 & 143.6 & 232.321 & -88.721 \tabularnewline
12 & 150.5 & 230.921 & -80.421 \tabularnewline
13 & 150.1 & 209.7675 & -59.6675000000001 \tabularnewline
14 & 154.9 & 205.0505 & -50.1505 \tabularnewline
15 & 162.1 & 197.0305 & -34.9305 \tabularnewline
16 & 176.7 & 191.7305 & -15.0305 \tabularnewline
17 & 186.6 & 195.601 & -9.00100000000002 \tabularnewline
18 & 194.8 & 203.701 & -8.901 \tabularnewline
19 & 196.3 & 214.001 & -17.701 \tabularnewline
20 & 228.8 & 228.041 & 0.759000000000011 \tabularnewline
21 & 267.2 & 234.021 & 33.179 \tabularnewline
22 & 237.2 & 226.221 & 10.9790000000000 \tabularnewline
23 & 254.7 & 232.321 & 22.379 \tabularnewline
24 & 258.2 & 230.921 & 27.2790000000000 \tabularnewline
25 & 257.9 & 209.7675 & 48.1324999999999 \tabularnewline
26 & 269.6 & 205.0505 & 64.5495 \tabularnewline
27 & 266.9 & 197.0305 & 69.8695 \tabularnewline
28 & 269.6 & 191.7305 & 77.8695 \tabularnewline
29 & 253.9 & 195.601 & 58.299 \tabularnewline
30 & 258.6 & 203.701 & 54.899 \tabularnewline
31 & 274.2 & 214.001 & 60.199 \tabularnewline
32 & 301.5 & 228.041 & 73.459 \tabularnewline
33 & 304.5 & 234.021 & 70.479 \tabularnewline
34 & 285.1 & 226.221 & 58.879 \tabularnewline
35 & 287.7 & 232.321 & 55.3789999999999 \tabularnewline
36 & 265.5 & 230.921 & 34.5789999999999 \tabularnewline
37 & 264.1 & 209.7675 & 54.3324999999999 \tabularnewline
38 & 276.1 & 205.0505 & 71.0495 \tabularnewline
39 & 258.9 & 197.0305 & 61.8695 \tabularnewline
40 & 239.1 & 191.7305 & 47.3695 \tabularnewline
41 & 250.1 & 184.5485 & 65.5515 \tabularnewline
42 & 276.8 & 192.6485 & 84.1515 \tabularnewline
43 & 297.6 & 202.9485 & 94.6515 \tabularnewline
44 & 295.4 & 216.9885 & 78.4115 \tabularnewline
45 & 283 & 222.9685 & 60.0315 \tabularnewline
46 & 275.8 & 215.1685 & 60.6315 \tabularnewline
47 & 279.7 & 221.2685 & 58.4315 \tabularnewline
48 & 254.6 & 219.8685 & 34.7315 \tabularnewline
49 & 234.6 & 198.715 & 35.8849999999999 \tabularnewline
50 & 176.9 & 193.998 & -17.0980000000000 \tabularnewline
51 & 148.1 & 185.978 & -37.8780000000000 \tabularnewline
52 & 122.7 & 180.678 & -57.978 \tabularnewline
53 & 124.9 & 184.5485 & -59.6485 \tabularnewline
54 & 121.6 & 192.6485 & -71.0485 \tabularnewline
55 & 128.4 & 202.9485 & -74.5485 \tabularnewline
56 & 144.5 & 216.9885 & -72.4885 \tabularnewline
57 & 151.8 & 222.9685 & -71.1685 \tabularnewline
58 & 167.1 & 215.1685 & -48.0685 \tabularnewline
59 & 173.8 & 221.2685 & -47.4685 \tabularnewline
60 & 203.7 & 219.8685 & -16.1685000000000 \tabularnewline
61 & 199.8 & 198.715 & 1.08499999999997 \tabularnewline
\hline
\end{tabular}
%Source: https://freestatistics.org/blog/index.php?pk=61373&T=4

[TABLE]
[ROW][C]Multiple Linear Regression - Actuals, Interpolation, and Residuals[/C][/ROW]
[ROW][C]Time or Index[/C][C]Actuals[/C][C]InterpolationForecast[/C][C]ResidualsPrediction Error[/C][/ROW]
[ROW][C]1[/C][C]130[/C][C]209.767500000000[/C][C]-79.7674999999997[/C][/ROW]
[ROW][C]2[/C][C]136.7[/C][C]205.0505[/C][C]-68.3505000000001[/C][/ROW]
[ROW][C]3[/C][C]138.1[/C][C]197.0305[/C][C]-58.9305[/C][/ROW]
[ROW][C]4[/C][C]139.5[/C][C]191.7305[/C][C]-52.2304999999999[/C][/ROW]
[ROW][C]5[/C][C]140.4[/C][C]195.601[/C][C]-55.2010000000001[/C][/ROW]
[ROW][C]6[/C][C]144.6[/C][C]203.701[/C][C]-59.101[/C][/ROW]
[ROW][C]7[/C][C]151.4[/C][C]214.001[/C][C]-62.601[/C][/ROW]
[ROW][C]8[/C][C]147.9[/C][C]228.041[/C][C]-80.141[/C][/ROW]
[ROW][C]9[/C][C]141.5[/C][C]234.021[/C][C]-92.521[/C][/ROW]
[ROW][C]10[/C][C]143.8[/C][C]226.221[/C][C]-82.421[/C][/ROW]
[ROW][C]11[/C][C]143.6[/C][C]232.321[/C][C]-88.721[/C][/ROW]
[ROW][C]12[/C][C]150.5[/C][C]230.921[/C][C]-80.421[/C][/ROW]
[ROW][C]13[/C][C]150.1[/C][C]209.7675[/C][C]-59.6675000000001[/C][/ROW]
[ROW][C]14[/C][C]154.9[/C][C]205.0505[/C][C]-50.1505[/C][/ROW]
[ROW][C]15[/C][C]162.1[/C][C]197.0305[/C][C]-34.9305[/C][/ROW]
[ROW][C]16[/C][C]176.7[/C][C]191.7305[/C][C]-15.0305[/C][/ROW]
[ROW][C]17[/C][C]186.6[/C][C]195.601[/C][C]-9.00100000000002[/C][/ROW]
[ROW][C]18[/C][C]194.8[/C][C]203.701[/C][C]-8.901[/C][/ROW]
[ROW][C]19[/C][C]196.3[/C][C]214.001[/C][C]-17.701[/C][/ROW]
[ROW][C]20[/C][C]228.8[/C][C]228.041[/C][C]0.759000000000011[/C][/ROW]
[ROW][C]21[/C][C]267.2[/C][C]234.021[/C][C]33.179[/C][/ROW]
[ROW][C]22[/C][C]237.2[/C][C]226.221[/C][C]10.9790000000000[/C][/ROW]
[ROW][C]23[/C][C]254.7[/C][C]232.321[/C][C]22.379[/C][/ROW]
[ROW][C]24[/C][C]258.2[/C][C]230.921[/C][C]27.2790000000000[/C][/ROW]
[ROW][C]25[/C][C]257.9[/C][C]209.7675[/C][C]48.1324999999999[/C][/ROW]
[ROW][C]26[/C][C]269.6[/C][C]205.0505[/C][C]64.5495[/C][/ROW]
[ROW][C]27[/C][C]266.9[/C][C]197.0305[/C][C]69.8695[/C][/ROW]
[ROW][C]28[/C][C]269.6[/C][C]191.7305[/C][C]77.8695[/C][/ROW]
[ROW][C]29[/C][C]253.9[/C][C]195.601[/C][C]58.299[/C][/ROW]
[ROW][C]30[/C][C]258.6[/C][C]203.701[/C][C]54.899[/C][/ROW]
[ROW][C]31[/C][C]274.2[/C][C]214.001[/C][C]60.199[/C][/ROW]
[ROW][C]32[/C][C]301.5[/C][C]228.041[/C][C]73.459[/C][/ROW]
[ROW][C]33[/C][C]304.5[/C][C]234.021[/C][C]70.479[/C][/ROW]
[ROW][C]34[/C][C]285.1[/C][C]226.221[/C][C]58.879[/C][/ROW]
[ROW][C]35[/C][C]287.7[/C][C]232.321[/C][C]55.3789999999999[/C][/ROW]
[ROW][C]36[/C][C]265.5[/C][C]230.921[/C][C]34.5789999999999[/C][/ROW]
[ROW][C]37[/C][C]264.1[/C][C]209.7675[/C][C]54.3324999999999[/C][/ROW]
[ROW][C]38[/C][C]276.1[/C][C]205.0505[/C][C]71.0495[/C][/ROW]
[ROW][C]39[/C][C]258.9[/C][C]197.0305[/C][C]61.8695[/C][/ROW]
[ROW][C]40[/C][C]239.1[/C][C]191.7305[/C][C]47.3695[/C][/ROW]
[ROW][C]41[/C][C]250.1[/C][C]184.5485[/C][C]65.5515[/C][/ROW]
[ROW][C]42[/C][C]276.8[/C][C]192.6485[/C][C]84.1515[/C][/ROW]
[ROW][C]43[/C][C]297.6[/C][C]202.9485[/C][C]94.6515[/C][/ROW]
[ROW][C]44[/C][C]295.4[/C][C]216.9885[/C][C]78.4115[/C][/ROW]
[ROW][C]45[/C][C]283[/C][C]222.9685[/C][C]60.0315[/C][/ROW]
[ROW][C]46[/C][C]275.8[/C][C]215.1685[/C][C]60.6315[/C][/ROW]
[ROW][C]47[/C][C]279.7[/C][C]221.2685[/C][C]58.4315[/C][/ROW]
[ROW][C]48[/C][C]254.6[/C][C]219.8685[/C][C]34.7315[/C][/ROW]
[ROW][C]49[/C][C]234.6[/C][C]198.715[/C][C]35.8849999999999[/C][/ROW]
[ROW][C]50[/C][C]176.9[/C][C]193.998[/C][C]-17.0980000000000[/C][/ROW]
[ROW][C]51[/C][C]148.1[/C][C]185.978[/C][C]-37.8780000000000[/C][/ROW]
[ROW][C]52[/C][C]122.7[/C][C]180.678[/C][C]-57.978[/C][/ROW]
[ROW][C]53[/C][C]124.9[/C][C]184.5485[/C][C]-59.6485[/C][/ROW]
[ROW][C]54[/C][C]121.6[/C][C]192.6485[/C][C]-71.0485[/C][/ROW]
[ROW][C]55[/C][C]128.4[/C][C]202.9485[/C][C]-74.5485[/C][/ROW]
[ROW][C]56[/C][C]144.5[/C][C]216.9885[/C][C]-72.4885[/C][/ROW]
[ROW][C]57[/C][C]151.8[/C][C]222.9685[/C][C]-71.1685[/C][/ROW]
[ROW][C]58[/C][C]167.1[/C][C]215.1685[/C][C]-48.0685[/C][/ROW]
[ROW][C]59[/C][C]173.8[/C][C]221.2685[/C][C]-47.4685[/C][/ROW]
[ROW][C]60[/C][C]203.7[/C][C]219.8685[/C][C]-16.1685000000000[/C][/ROW]
[ROW][C]61[/C][C]199.8[/C][C]198.715[/C][C]1.08499999999997[/C][/ROW]
[/TABLE]
Source: https://freestatistics.org/blog/index.php?pk=61373&T=4

Globally Unique Identifier (entire table): ba.freestatistics.org/blog/index.php?pk=61373&T=4

As an alternative you can also use a QR Code:  

The GUIDs for individual cells are displayed in the table below:

Multiple Linear Regression - Actuals, Interpolation, and Residuals
Time or IndexActualsInterpolationForecastResidualsPrediction Error
1130209.767500000000-79.7674999999997
2136.7205.0505-68.3505000000001
3138.1197.0305-58.9305
4139.5191.7305-52.2304999999999
5140.4195.601-55.2010000000001
6144.6203.701-59.101
7151.4214.001-62.601
8147.9228.041-80.141
9141.5234.021-92.521
10143.8226.221-82.421
11143.6232.321-88.721
12150.5230.921-80.421
13150.1209.7675-59.6675000000001
14154.9205.0505-50.1505
15162.1197.0305-34.9305
16176.7191.7305-15.0305
17186.6195.601-9.00100000000002
18194.8203.701-8.901
19196.3214.001-17.701
20228.8228.0410.759000000000011
21267.2234.02133.179
22237.2226.22110.9790000000000
23254.7232.32122.379
24258.2230.92127.2790000000000
25257.9209.767548.1324999999999
26269.6205.050564.5495
27266.9197.030569.8695
28269.6191.730577.8695
29253.9195.60158.299
30258.6203.70154.899
31274.2214.00160.199
32301.5228.04173.459
33304.5234.02170.479
34285.1226.22158.879
35287.7232.32155.3789999999999
36265.5230.92134.5789999999999
37264.1209.767554.3324999999999
38276.1205.050571.0495
39258.9197.030561.8695
40239.1191.730547.3695
41250.1184.548565.5515
42276.8192.648584.1515
43297.6202.948594.6515
44295.4216.988578.4115
45283222.968560.0315
46275.8215.168560.6315
47279.7221.268558.4315
48254.6219.868534.7315
49234.6198.71535.8849999999999
50176.9193.998-17.0980000000000
51148.1185.978-37.8780000000000
52122.7180.678-57.978
53124.9184.5485-59.6485
54121.6192.6485-71.0485
55128.4202.9485-74.5485
56144.5216.9885-72.4885
57151.8222.9685-71.1685
58167.1215.1685-48.0685
59173.8221.2685-47.4685
60203.7219.8685-16.1685000000000
61199.8198.7151.08499999999997


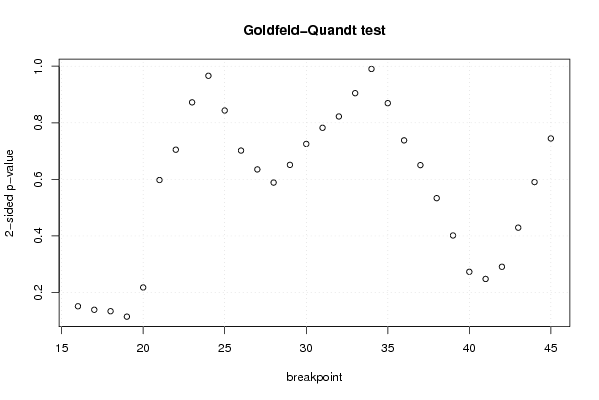
Goldfeld-Quandt test for Heteroskedasticity
p-valuesAlternative Hypothesis
breakpoint indexgreater2-sidedless
160.07567945275938550.1513589055187710.924320547240615
170.06945471289720020.1389094257944000.9305452871028
180.06693100500423240.1338620100084650.933068994995768
190.05731525239180370.1146305047836070.942684747608196
200.1088914986599030.2177829973198060.891108501340097
210.2987946239904960.5975892479809920.701205376009504
220.3524119625278670.7048239250557340.647588037472133
230.4361130340986260.8722260681972510.563886965901374
240.4831020157239950.966204031447990.516897984276005
250.5782805564132360.8434388871735290.421719443586764
260.6490867433607220.7018265132785550.350913256639278
270.6824015621629460.6351968756741080.317598437837054
280.7056616707786430.5886766584427150.294338329221357
290.6743769504151220.6512460991697560.325623049584878
300.6373785031545430.7252429936909150.362621496845457
310.6088308001879450.782338399624110.391169199812055
320.5888338166491560.8223323667016880.411166183350844
330.5476612246073160.9046775507853680.452338775392684
340.495178674335210.990357348670420.50482132566479
350.4346782178269500.8693564356539010.56532178217305
360.3689209644267110.7378419288534210.63107903557329
370.325163702014990.650327404029980.67483629798501
380.2667676573969510.5335353147939020.733232342603049
390.2008385609632630.4016771219265270.799161439036737
400.1365746567225350.2731493134450690.863425343277465
410.1239992879282040.2479985758564090.876000712071796
420.1454773549495790.2909547098991580.854522645050421
430.2146321218971850.4292642437943690.785367878102815
440.2952260317200450.590452063440090.704773968279955
450.3723164993842690.7446329987685380.627683500615731

\begin{tabular}{lllllllll}
\hline
Goldfeld-Quandt test for Heteroskedasticity \tabularnewline
p-values & Alternative Hypothesis \tabularnewline
breakpoint index & greater & 2-sided & less \tabularnewline
16 & 0.0756794527593855 & 0.151358905518771 & 0.924320547240615 \tabularnewline
17 & 0.0694547128972002 & 0.138909425794400 & 0.9305452871028 \tabularnewline
18 & 0.0669310050042324 & 0.133862010008465 & 0.933068994995768 \tabularnewline
19 & 0.0573152523918037 & 0.114630504783607 & 0.942684747608196 \tabularnewline
20 & 0.108891498659903 & 0.217782997319806 & 0.891108501340097 \tabularnewline
21 & 0.298794623990496 & 0.597589247980992 & 0.701205376009504 \tabularnewline
22 & 0.352411962527867 & 0.704823925055734 & 0.647588037472133 \tabularnewline
23 & 0.436113034098626 & 0.872226068197251 & 0.563886965901374 \tabularnewline
24 & 0.483102015723995 & 0.96620403144799 & 0.516897984276005 \tabularnewline
25 & 0.578280556413236 & 0.843438887173529 & 0.421719443586764 \tabularnewline
26 & 0.649086743360722 & 0.701826513278555 & 0.350913256639278 \tabularnewline
27 & 0.682401562162946 & 0.635196875674108 & 0.317598437837054 \tabularnewline
28 & 0.705661670778643 & 0.588676658442715 & 0.294338329221357 \tabularnewline
29 & 0.674376950415122 & 0.651246099169756 & 0.325623049584878 \tabularnewline
30 & 0.637378503154543 & 0.725242993690915 & 0.362621496845457 \tabularnewline
31 & 0.608830800187945 & 0.78233839962411 & 0.391169199812055 \tabularnewline
32 & 0.588833816649156 & 0.822332366701688 & 0.411166183350844 \tabularnewline
33 & 0.547661224607316 & 0.904677550785368 & 0.452338775392684 \tabularnewline
34 & 0.49517867433521 & 0.99035734867042 & 0.50482132566479 \tabularnewline
35 & 0.434678217826950 & 0.869356435653901 & 0.56532178217305 \tabularnewline
36 & 0.368920964426711 & 0.737841928853421 & 0.63107903557329 \tabularnewline
37 & 0.32516370201499 & 0.65032740402998 & 0.67483629798501 \tabularnewline
38 & 0.266767657396951 & 0.533535314793902 & 0.733232342603049 \tabularnewline
39 & 0.200838560963263 & 0.401677121926527 & 0.799161439036737 \tabularnewline
40 & 0.136574656722535 & 0.273149313445069 & 0.863425343277465 \tabularnewline
41 & 0.123999287928204 & 0.247998575856409 & 0.876000712071796 \tabularnewline
42 & 0.145477354949579 & 0.290954709899158 & 0.854522645050421 \tabularnewline
43 & 0.214632121897185 & 0.429264243794369 & 0.785367878102815 \tabularnewline
44 & 0.295226031720045 & 0.59045206344009 & 0.704773968279955 \tabularnewline
45 & 0.372316499384269 & 0.744632998768538 & 0.627683500615731 \tabularnewline
\hline
\end{tabular}
%Source: https://freestatistics.org/blog/index.php?pk=61373&T=5

[TABLE]
[ROW][C]Goldfeld-Quandt test for Heteroskedasticity[/C][/ROW]
[ROW][C]p-values[/C][C]Alternative Hypothesis[/C][/ROW]
[ROW][C]breakpoint index[/C][C]greater[/C][C]2-sided[/C][C]less[/C][/ROW]
[ROW][C]16[/C][C]0.0756794527593855[/C][C]0.151358905518771[/C][C]0.924320547240615[/C][/ROW]
[ROW][C]17[/C][C]0.0694547128972002[/C][C]0.138909425794400[/C][C]0.9305452871028[/C][/ROW]
[ROW][C]18[/C][C]0.0669310050042324[/C][C]0.133862010008465[/C][C]0.933068994995768[/C][/ROW]
[ROW][C]19[/C][C]0.0573152523918037[/C][C]0.114630504783607[/C][C]0.942684747608196[/C][/ROW]
[ROW][C]20[/C][C]0.108891498659903[/C][C]0.217782997319806[/C][C]0.891108501340097[/C][/ROW]
[ROW][C]21[/C][C]0.298794623990496[/C][C]0.597589247980992[/C][C]0.701205376009504[/C][/ROW]
[ROW][C]22[/C][C]0.352411962527867[/C][C]0.704823925055734[/C][C]0.647588037472133[/C][/ROW]
[ROW][C]23[/C][C]0.436113034098626[/C][C]0.872226068197251[/C][C]0.563886965901374[/C][/ROW]
[ROW][C]24[/C][C]0.483102015723995[/C][C]0.96620403144799[/C][C]0.516897984276005[/C][/ROW]
[ROW][C]25[/C][C]0.578280556413236[/C][C]0.843438887173529[/C][C]0.421719443586764[/C][/ROW]
[ROW][C]26[/C][C]0.649086743360722[/C][C]0.701826513278555[/C][C]0.350913256639278[/C][/ROW]
[ROW][C]27[/C][C]0.682401562162946[/C][C]0.635196875674108[/C][C]0.317598437837054[/C][/ROW]
[ROW][C]28[/C][C]0.705661670778643[/C][C]0.588676658442715[/C][C]0.294338329221357[/C][/ROW]
[ROW][C]29[/C][C]0.674376950415122[/C][C]0.651246099169756[/C][C]0.325623049584878[/C][/ROW]
[ROW][C]30[/C][C]0.637378503154543[/C][C]0.725242993690915[/C][C]0.362621496845457[/C][/ROW]
[ROW][C]31[/C][C]0.608830800187945[/C][C]0.78233839962411[/C][C]0.391169199812055[/C][/ROW]
[ROW][C]32[/C][C]0.588833816649156[/C][C]0.822332366701688[/C][C]0.411166183350844[/C][/ROW]
[ROW][C]33[/C][C]0.547661224607316[/C][C]0.904677550785368[/C][C]0.452338775392684[/C][/ROW]
[ROW][C]34[/C][C]0.49517867433521[/C][C]0.99035734867042[/C][C]0.50482132566479[/C][/ROW]
[ROW][C]35[/C][C]0.434678217826950[/C][C]0.869356435653901[/C][C]0.56532178217305[/C][/ROW]
[ROW][C]36[/C][C]0.368920964426711[/C][C]0.737841928853421[/C][C]0.63107903557329[/C][/ROW]
[ROW][C]37[/C][C]0.32516370201499[/C][C]0.65032740402998[/C][C]0.67483629798501[/C][/ROW]
[ROW][C]38[/C][C]0.266767657396951[/C][C]0.533535314793902[/C][C]0.733232342603049[/C][/ROW]
[ROW][C]39[/C][C]0.200838560963263[/C][C]0.401677121926527[/C][C]0.799161439036737[/C][/ROW]
[ROW][C]40[/C][C]0.136574656722535[/C][C]0.273149313445069[/C][C]0.863425343277465[/C][/ROW]
[ROW][C]41[/C][C]0.123999287928204[/C][C]0.247998575856409[/C][C]0.876000712071796[/C][/ROW]
[ROW][C]42[/C][C]0.145477354949579[/C][C]0.290954709899158[/C][C]0.854522645050421[/C][/ROW]
[ROW][C]43[/C][C]0.214632121897185[/C][C]0.429264243794369[/C][C]0.785367878102815[/C][/ROW]
[ROW][C]44[/C][C]0.295226031720045[/C][C]0.59045206344009[/C][C]0.704773968279955[/C][/ROW]
[ROW][C]45[/C][C]0.372316499384269[/C][C]0.744632998768538[/C][C]0.627683500615731[/C][/ROW]
[/TABLE]
Source: https://freestatistics.org/blog/index.php?pk=61373&T=5

Globally Unique Identifier (entire table): ba.freestatistics.org/blog/index.php?pk=61373&T=5

As an alternative you can also use a QR Code:  

The GUIDs for individual cells are displayed in the table below:

Goldfeld-Quandt test for Heteroskedasticity
p-valuesAlternative Hypothesis
breakpoint indexgreater2-sidedless
160.07567945275938550.1513589055187710.924320547240615
170.06945471289720020.1389094257944000.9305452871028
180.06693100500423240.1338620100084650.933068994995768
190.05731525239180370.1146305047836070.942684747608196
200.1088914986599030.2177829973198060.891108501340097
210.2987946239904960.5975892479809920.701205376009504
220.3524119625278670.7048239250557340.647588037472133
230.4361130340986260.8722260681972510.563886965901374
240.4831020157239950.966204031447990.516897984276005
250.5782805564132360.8434388871735290.421719443586764
260.6490867433607220.7018265132785550.350913256639278
270.6824015621629460.6351968756741080.317598437837054
280.7056616707786430.5886766584427150.294338329221357
290.6743769504151220.6512460991697560.325623049584878
300.6373785031545430.7252429936909150.362621496845457
310.6088308001879450.782338399624110.391169199812055
320.5888338166491560.8223323667016880.411166183350844
330.5476612246073160.9046775507853680.452338775392684
340.495178674335210.990357348670420.50482132566479
350.4346782178269500.8693564356539010.56532178217305
360.3689209644267110.7378419288534210.63107903557329
370.325163702014990.650327404029980.67483629798501
380.2667676573969510.5335353147939020.733232342603049
390.2008385609632630.4016771219265270.799161439036737
400.1365746567225350.2731493134450690.863425343277465
410.1239992879282040.2479985758564090.876000712071796
420.1454773549495790.2909547098991580.854522645050421
430.2146321218971850.4292642437943690.785367878102815
440.2952260317200450.590452063440090.704773968279955
450.3723164993842690.7446329987685380.627683500615731


Meta Analysis of Goldfeld-Quandt test for Heteroskedasticity
Description# significant tests% significant testsOK/NOK
1% type I error level00OK
5% type I error level00OK
10% type I error level00OK

\begin{tabular}{lllllllll}
\hline
Meta Analysis of Goldfeld-Quandt test for Heteroskedasticity \tabularnewline
Description & # significant tests & % significant tests & OK/NOK \tabularnewline
1% type I error level & 0 & 0 & OK \tabularnewline
5% type I error level & 0 & 0 & OK \tabularnewline
10% type I error level & 0 & 0 & OK \tabularnewline
\hline
\end{tabular}
%Source: https://freestatistics.org/blog/index.php?pk=61373&T=6

[TABLE]
[ROW][C]Meta Analysis of Goldfeld-Quandt test for Heteroskedasticity[/C][/ROW]
[ROW][C]Description[/C][C]# significant tests[/C][C]% significant tests[/C][C]OK/NOK[/C][/ROW]
[ROW][C]1% type I error level[/C][C]0[/C][C]0[/C][C]OK[/C][/ROW]
[ROW][C]5% type I error level[/C][C]0[/C][C]0[/C][C]OK[/C][/ROW]
[ROW][C]10% type I error level[/C][C]0[/C][C]0[/C][C]OK[/C][/ROW]
[/TABLE]
Source: https://freestatistics.org/blog/index.php?pk=61373&T=6

Globally Unique Identifier (entire table): ba.freestatistics.org/blog/index.php?pk=61373&T=6

As an alternative you can also use a QR Code:  

The GUIDs for individual cells are displayed in the table below:

Meta Analysis of Goldfeld-Quandt test for Heteroskedasticity
Description# significant tests% significant testsOK/NOK
1% type I error level00OK
5% type I error level00OK
10% type I error level00OK


Parameters (Session):
par1 = 1 ; par2 = Include Monthly Dummies ; par3 = No Linear Trend ;
Parameters (R input):
par1 = 1 ; par2 = Include Monthly Dummies ; par3 = No Linear Trend ;
R code (references can be found in the software module):
library(lattice)
library(lmtest)
n25 <- 25 #minimum number of obs. for Goldfeld-Quandt test
par1 <- as.numeric(par1)
x <- t(y)
k <- length(x[1,])
n <- length(x[,1])
x1 <- cbind(x[,par1], x[,1:k!=par1])
mycolnames <- c(colnames(x)[par1], colnames(x)[1:k!=par1])
colnames(x1) <- mycolnames #colnames(x)[par1]
x <- x1
if (par3 == 'First Differences'){
x2 <- array(0, dim=c(n-1,k), dimnames=list(1:(n-1), paste('(1-B)',colnames(x),sep='')))
for (i in 1:n-1) {
for (j in 1:k) {
x2[i,j] <- x[i+1,j] - x[i,j]
}
}
x <- x2
}
if (par2 == 'Include Monthly Dummies'){
x2 <- array(0, dim=c(n,11), dimnames=list(1:n, paste('M', seq(1:11), sep ='')))
for (i in 1:11){
x2[seq(i,n,12),i] <- 1
}
x <- cbind(x, x2)
}
if (par2 == 'Include Quarterly Dummies'){
x2 <- array(0, dim=c(n,3), dimnames=list(1:n, paste('Q', seq(1:3), sep ='')))
for (i in 1:3){
x2[seq(i,n,4),i] <- 1
}
x <- cbind(x, x2)
}
k <- length(x[1,])
if (par3 == 'Linear Trend'){
x <- cbind(x, c(1:n))
colnames(x)[k+1] <- 't'
}
x
k <- length(x[1,])
df <- as.data.frame(x)
(mylm <- lm(df))
(mysum <- summary(mylm))
if (n > n25) {
kp3 <- k + 3
nmkm3 <- n - k - 3
gqarr <- array(NA, dim=c(nmkm3-kp3+1,3))
numgqtests <- 0
numsignificant1 <- 0
numsignificant5 <- 0
numsignificant10 <- 0
for (mypoint in kp3:nmkm3) {
j <- 0
numgqtests <- numgqtests + 1
for (myalt in c('greater', 'two.sided', 'less')) {
j <- j + 1
gqarr[mypoint-kp3+1,j] <- gqtest(mylm, point=mypoint, alternative=myalt)$p.value
}
if (gqarr[mypoint-kp3+1,2] < 0.01) numsignificant1 <- numsignificant1 + 1
if (gqarr[mypoint-kp3+1,2] < 0.05) numsignificant5 <- numsignificant5 + 1
if (gqarr[mypoint-kp3+1,2] < 0.10) numsignificant10 <- numsignificant10 + 1
}
gqarr
}
bitmap(file='test0.png')
plot(x[,1], type='l', main='Actuals and Interpolation', ylab='value of Actuals and Interpolation (dots)', xlab='time or index')
points(x[,1]-mysum$resid)
grid()
dev.off()
bitmap(file='test1.png')
plot(mysum$resid, type='b', pch=19, main='Residuals', ylab='value of Residuals', xlab='time or index')
grid()
dev.off()
bitmap(file='test2.png')
hist(mysum$resid, main='Residual Histogram', xlab='values of Residuals')
grid()
dev.off()
bitmap(file='test3.png')
densityplot(~mysum$resid,col='black',main='Residual Density Plot', xlab='values of Residuals')
dev.off()
bitmap(file='test4.png')
qqnorm(mysum$resid, main='Residual Normal Q-Q Plot')
qqline(mysum$resid)
grid()
dev.off()
(myerror <- as.ts(mysum$resid))
bitmap(file='test5.png')
dum <- cbind(lag(myerror,k=1),myerror)
dum
dum1 <- dum[2:length(myerror),]
dum1
z <- as.data.frame(dum1)
z
plot(z,main=paste('Residual Lag plot, lowess, and regression line'), ylab='values of Residuals', xlab='lagged values of Residuals')
lines(lowess(z))
abline(lm(z))
grid()
dev.off()
bitmap(file='test6.png')
acf(mysum$resid, lag.max=length(mysum$resid)/2, main='Residual Autocorrelation Function')
grid()
dev.off()
bitmap(file='test7.png')
pacf(mysum$resid, lag.max=length(mysum$resid)/2, main='Residual Partial Autocorrelation Function')
grid()
dev.off()
bitmap(file='test8.png')
opar <- par(mfrow = c(2,2), oma = c(0, 0, 1.1, 0))
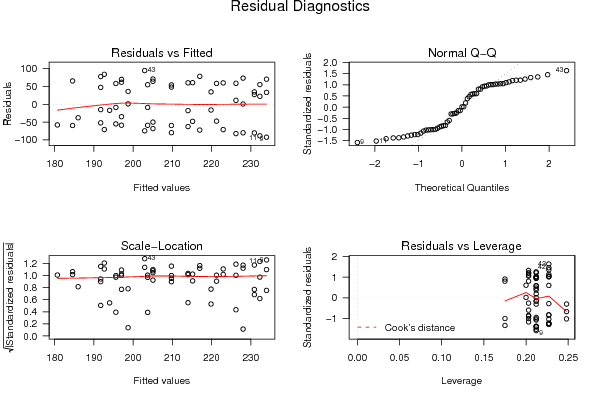
plot(mylm, las = 1, sub='Residual Diagnostics')
par(opar)
dev.off()
if (n > n25) {
bitmap(file='test9.png')
plot(kp3:nmkm3,gqarr[,2], main='Goldfeld-Quandt test',ylab='2-sided p-value',xlab='breakpoint')
grid()
dev.off()
}
load(file='createtable')
a<-table.start()
a<-table.row.start(a)
a<-table.element(a, 'Multiple Linear Regression - Estimated Regression Equation', 1, TRUE)
a<-table.row.end(a)
myeq <- colnames(x)[1]
myeq <- paste(myeq, '[t] = ', sep='')
for (i in 1:k){
if (mysum$coefficients[i,1] > 0) myeq <- paste(myeq, '+', '')
myeq <- paste(myeq, mysum$coefficients[i,1], sep=' ')
if (rownames(mysum$coefficients)[i] != '(Intercept)') {
myeq <- paste(myeq, rownames(mysum$coefficients)[i], sep='')
if (rownames(mysum$coefficients)[i] != 't') myeq <- paste(myeq, '[t]', sep='')
}
}
myeq <- paste(myeq, ' + e[t]')
a<-table.row.start(a)
a<-table.element(a, myeq)
a<-table.row.end(a)
a<-table.end(a)
table.save(a,file='mytable1.tab')
a<-table.start()
a<-table.row.start(a)
a<-table.element(a,hyperlink('ols1.htm','Multiple Linear Regression - Ordinary Least Squares',''), 6, TRUE)
a<-table.row.end(a)
a<-table.row.start(a)
a<-table.element(a,'Variable',header=TRUE)
a<-table.element(a,'Parameter',header=TRUE)
a<-table.element(a,'S.D.',header=TRUE)
a<-table.element(a,'T-STAT
H0: parameter = 0',header=TRUE)
a<-table.element(a,'2-tail p-value',header=TRUE)
a<-table.element(a,'1-tail p-value',header=TRUE)
a<-table.row.end(a)
for (i in 1:k){
a<-table.row.start(a)
a<-table.element(a,rownames(mysum$coefficients)[i],header=TRUE)
a<-table.element(a,mysum$coefficients[i,1])
a<-table.element(a, round(mysum$coefficients[i,2],6))
a<-table.element(a, round(mysum$coefficients[i,3],4))
a<-table.element(a, round(mysum$coefficients[i,4],6))
a<-table.element(a, round(mysum$coefficients[i,4]/2,6))
a<-table.row.end(a)
}
a<-table.end(a)
table.save(a,file='mytable2.tab')
a<-table.start()
a<-table.row.start(a)
a<-table.element(a, 'Multiple Linear Regression - Regression Statistics', 2, TRUE)
a<-table.row.end(a)
a<-table.row.start(a)
a<-table.element(a, 'Multiple R',1,TRUE)
a<-table.element(a, sqrt(mysum$r.squared))
a<-table.row.end(a)
a<-table.row.start(a)
a<-table.element(a, 'R-squared',1,TRUE)
a<-table.element(a, mysum$r.squared)
a<-table.row.end(a)
a<-table.row.start(a)
a<-table.element(a, 'Adjusted R-squared',1,TRUE)
a<-table.element(a, mysum$adj.r.squared)
a<-table.row.end(a)
a<-table.row.start(a)
a<-table.element(a, 'F-TEST (value)',1,TRUE)
a<-table.element(a, mysum$fstatistic[1])
a<-table.row.end(a)
a<-table.row.start(a)
a<-table.element(a, 'F-TEST (DF numerator)',1,TRUE)
a<-table.element(a, mysum$fstatistic[2])
a<-table.row.end(a)
a<-table.row.start(a)
a<-table.element(a, 'F-TEST (DF denominator)',1,TRUE)
a<-table.element(a, mysum$fstatistic[3])
a<-table.row.end(a)
a<-table.row.start(a)
a<-table.element(a, 'p-value',1,TRUE)
a<-table.element(a, 1-pf(mysum$fstatistic[1],mysum$fstatistic[2],mysum$fstatistic[3]))
a<-table.row.end(a)
a<-table.row.start(a)
a<-table.element(a, 'Multiple Linear Regression - Residual Statistics', 2, TRUE)
a<-table.row.end(a)
a<-table.row.start(a)
a<-table.element(a, 'Residual Standard Deviation',1,TRUE)
a<-table.element(a, mysum$sigma)
a<-table.row.end(a)
a<-table.row.start(a)
a<-table.element(a, 'Sum Squared Residuals',1,TRUE)
a<-table.element(a, sum(myerror*myerror))
a<-table.row.end(a)
a<-table.end(a)
table.save(a,file='mytable3.tab')
a<-table.start()
a<-table.row.start(a)
a<-table.element(a, 'Multiple Linear Regression - Actuals, Interpolation, and Residuals', 4, TRUE)
a<-table.row.end(a)
a<-table.row.start(a)
a<-table.element(a, 'Time or Index', 1, TRUE)
a<-table.element(a, 'Actuals', 1, TRUE)
a<-table.element(a, 'Interpolation
Forecast', 1, TRUE)
a<-table.element(a, 'Residuals
Prediction Error', 1, TRUE)
a<-table.row.end(a)
for (i in 1:n) {
a<-table.row.start(a)
a<-table.element(a,i, 1, TRUE)
a<-table.element(a,x[i])
a<-table.element(a,x[i]-mysum$resid[i])
a<-table.element(a,mysum$resid[i])
a<-table.row.end(a)
}
a<-table.end(a)
table.save(a,file='mytable4.tab')
if (n > n25) {
a<-table.start()
a<-table.row.start(a)
a<-table.element(a,'Goldfeld-Quandt test for Heteroskedasticity',4,TRUE)
a<-table.row.end(a)
a<-table.row.start(a)
a<-table.element(a,'p-values',header=TRUE)
a<-table.element(a,'Alternative Hypothesis',3,header=TRUE)
a<-table.row.end(a)
a<-table.row.start(a)
a<-table.element(a,'breakpoint index',header=TRUE)
a<-table.element(a,'greater',header=TRUE)
a<-table.element(a,'2-sided',header=TRUE)
a<-table.element(a,'less',header=TRUE)
a<-table.row.end(a)
for (mypoint in kp3:nmkm3) {
a<-table.row.start(a)
a<-table.element(a,mypoint,header=TRUE)
a<-table.element(a,gqarr[mypoint-kp3+1,1])
a<-table.element(a,gqarr[mypoint-kp3+1,2])
a<-table.element(a,gqarr[mypoint-kp3+1,3])
a<-table.row.end(a)
}
a<-table.end(a)
table.save(a,file='mytable5.tab')
a<-table.start()
a<-table.row.start(a)
a<-table.element(a,'Meta Analysis of Goldfeld-Quandt test for Heteroskedasticity',4,TRUE)
a<-table.row.end(a)
a<-table.row.start(a)
a<-table.element(a,'Description',header=TRUE)
a<-table.element(a,'# significant tests',header=TRUE)
a<-table.element(a,'% significant tests',header=TRUE)
a<-table.element(a,'OK/NOK',header=TRUE)
a<-table.row.end(a)
a<-table.row.start(a)
a<-table.element(a,'1% type I error level',header=TRUE)
a<-table.element(a,numsignificant1)
a<-table.element(a,numsignificant1/numgqtests)
if (numsignificant1/numgqtests < 0.01) dum <- 'OK' else dum <- 'NOK'
a<-table.element(a,dum)
a<-table.row.end(a)
a<-table.row.start(a)
a<-table.element(a,'5% type I error level',header=TRUE)
a<-table.element(a,numsignificant5)
a<-table.element(a,numsignificant5/numgqtests)
if (numsignificant5/numgqtests < 0.05) dum <- 'OK' else dum <- 'NOK'
a<-table.element(a,dum)
a<-table.row.end(a)
a<-table.row.start(a)
a<-table.element(a,'10% type I error level',header=TRUE)
a<-table.element(a,numsignificant10)
a<-table.element(a,numsignificant10/numgqtests)
if (numsignificant10/numgqtests < 0.1) dum <- 'OK' else dum <- 'NOK'
a<-table.element(a,dum)
a<-table.row.end(a)
a<-table.end(a)
table.save(a,file='mytable6.tab')
}