Free Statistics

of Irreproducible Research!

Author's title

Author*Unverified author*
R Software Modulerwasp_multipleregression.wasp
Title produced by softwareMultiple Regression
Date of computationFri, 27 Nov 2009 02:57:05 -0700
Cite this page as followsStatistical Computations at FreeStatistics.org, Office for Research Development and Education, URL https://freestatistics.org/blog/index.php?v=date/2009/Nov/27/t1259316197o3y34jd8w0qw77j.htm/, Retrieved Sat, 27 Apr 2024 09:40:21 +0000
Statistical Computations at FreeStatistics.org, Office for Research Development and Education, URL https://freestatistics.org/blog/index.php?pk=60521, Retrieved Sat, 27 Apr 2024 09:40:21 +0000
QR Codes:

Original text written by user:
IsPrivate?No (this computation is public)
User-defined keywords
Estimated Impact135
Family? (F = Feedback message, R = changed R code, M = changed R Module, P = changed Parameters, D = changed Data)
-     [Multiple Regression] [Q1 The Seatbeltlaw] [2007-11-14 19:27:43] [8cd6641b921d30ebe00b648d1481bba0]
- RMPD  [Multiple Regression] [Seatbelt] [2009-11-12 13:54:52] [b98453cac15ba1066b407e146608df68]
-    D    [Multiple Regression] [Workshop 7] [2009-11-19 16:33:52] [85be98bd9ebcfd4d73e77f8552419c9a]
-   P         [Multiple Regression] [] [2009-11-27 09:57:05] [2be55e40556dba706f1211fd5a4ae809] [Current]
Feedback Forum

Post a new message
Dataseries X:
 2.11 	0 
 2.09 	0 
 2.05 	0 
 2.08 	0 
 2.06 	0 
 2.06 	0 
 2.08 	0 
 2.07 	0 
 2.06 	0 
 2.07 	0 
 2.06 	0 
 2.09 	0 
 2.07 	0 
 2.09 	0 
 2.28 	0 
 2.33 	0 
 2.35 	0 
 2.52 	0 
 2.63 	0 
 2.58 	0 
 2.70 	0 
 2.81 	0 
 2.97 	0 
 3.04 	0 
 3.28 	0 
 3.33 	0 
 3.50 	0 
 3.56 	0 
 3.57 	0 
 3.69 	0 
 3.82 	0 
 3.79 	0 
 3.96 	0 
 4.06 	0 
 4.05 	0 
 4.03 	0 
 3.94 	0 
 4.02 	0 
 3.88 	0 
 4.02 	0 
 4.03 	0 
 4.09 	0 
 3.99 	0 
 4.01 	0 
 4.01 	0 
 4.19 	0 
 4.30 	0 
 4.27 	0 
 3.82 	0 
 3.15 	1 
 2.49 	1 
 1.81 	1 
 1.26 	1 
 1.06 	1 
 0.84 	1 
 0.78 	1 
 0.70 	1 
 0.36 	1 
 0.35 	1 
 0.36 	1 


Summary of computational transaction
Raw Inputview raw input (R code)
Raw Outputview raw output of R engine
Computing time4 seconds
R Server'Gwilym Jenkins' @ 72.249.127.135

\begin{tabular}{lllllllll}
\hline
Summary of computational transaction \tabularnewline
Raw Input & view raw input (R code)  \tabularnewline
Raw Output & view raw output of R engine  \tabularnewline
Computing time & 4 seconds \tabularnewline
R Server & 'Gwilym Jenkins' @ 72.249.127.135 \tabularnewline
\hline
\end{tabular}
%Source: https://freestatistics.org/blog/index.php?pk=60521&T=0

[TABLE]
[ROW][C]Summary of computational transaction[/C][/ROW]
[ROW][C]Raw Input[/C][C]view raw input (R code) [/C][/ROW]
[ROW][C]Raw Output[/C][C]view raw output of R engine [/C][/ROW]
[ROW][C]Computing time[/C][C]4 seconds[/C][/ROW]
[ROW][C]R Server[/C][C]'Gwilym Jenkins' @ 72.249.127.135[/C][/ROW]
[/TABLE]
Source: https://freestatistics.org/blog/index.php?pk=60521&T=0

Globally Unique Identifier (entire table): ba.freestatistics.org/blog/index.php?pk=60521&T=0

As an alternative you can also use a QR Code:  

The GUIDs for individual cells are displayed in the table below:

Summary of computational transaction
Raw Inputview raw input (R code)
Raw Outputview raw output of R engine
Computing time4 seconds
R Server'Gwilym Jenkins' @ 72.249.127.135


Multiple Linear Regression - Estimated Regression Equation
Y[t] = + 3.14254545454545 -1.92272727272727X[t] -0.0985454545454535M1[t] + 0.178000000000001M2[t] + 0.0820000000000008M3[t] + 0.00200000000000018M4[t] -0.103999999999999M5[t] -0.0739999999999996M6[t] -0.0859999999999994M7[t] -0.111999999999999M8[t] -0.0719999999999994M9[t] -0.0599999999999995M10[t] -0.0119999999999993M11[t] + e[t]

\begin{tabular}{lllllllll}
\hline
Multiple Linear Regression - Estimated Regression Equation \tabularnewline
Y[t] =  +  3.14254545454545 -1.92272727272727X[t] -0.0985454545454535M1[t] +  0.178000000000001M2[t] +  0.0820000000000008M3[t] +  0.00200000000000018M4[t] -0.103999999999999M5[t] -0.0739999999999996M6[t] -0.0859999999999994M7[t] -0.111999999999999M8[t] -0.0719999999999994M9[t] -0.0599999999999995M10[t] -0.0119999999999993M11[t]  + e[t] \tabularnewline
\hline
\end{tabular}
%Source: https://freestatistics.org/blog/index.php?pk=60521&T=1

[TABLE]
[ROW][C]Multiple Linear Regression - Estimated Regression Equation[/C][/ROW]
[ROW][C]Y[t] =  +  3.14254545454545 -1.92272727272727X[t] -0.0985454545454535M1[t] +  0.178000000000001M2[t] +  0.0820000000000008M3[t] +  0.00200000000000018M4[t] -0.103999999999999M5[t] -0.0739999999999996M6[t] -0.0859999999999994M7[t] -0.111999999999999M8[t] -0.0719999999999994M9[t] -0.0599999999999995M10[t] -0.0119999999999993M11[t]  + e[t][/C][/ROW]
[/TABLE]
Source: https://freestatistics.org/blog/index.php?pk=60521&T=1

Globally Unique Identifier (entire table): ba.freestatistics.org/blog/index.php?pk=60521&T=1

As an alternative you can also use a QR Code:  

The GUIDs for individual cells are displayed in the table below:

Multiple Linear Regression - Estimated Regression Equation
Y[t] = + 3.14254545454545 -1.92272727272727X[t] -0.0985454545454535M1[t] + 0.178000000000001M2[t] + 0.0820000000000008M3[t] + 0.00200000000000018M4[t] -0.103999999999999M5[t] -0.0739999999999996M6[t] -0.0859999999999994M7[t] -0.111999999999999M8[t] -0.0719999999999994M9[t] -0.0599999999999995M10[t] -0.0119999999999993M11[t] + e[t]


Multiple Linear Regression - Ordinary Least Squares
VariableParameterS.D.T-STATH0: parameter = 02-tail p-value1-tail p-value
(Intercept)3.142545454545450.4328437.260200
X-1.922727272727270.322622-5.959700
M1-0.09854545454545350.608722-0.16190.8720870.436044
M20.1780000000000010.6052930.29410.7699970.384999
M30.08200000000000080.6052930.13550.8928170.446409
M40.002000000000000180.6052930.00330.9973780.498689
M5-0.1039999999999990.605293-0.17180.8643180.432159
M6-0.07399999999999960.605293-0.12230.9032180.451609
M7-0.08599999999999940.605293-0.14210.8876240.443812
M8-0.1119999999999990.605293-0.1850.8539980.426999
M9-0.07199999999999940.605293-0.1190.9058210.452911
M10-0.05999999999999950.605293-0.09910.921460.46073
M11-0.01199999999999930.605293-0.01980.9842670.492133

\begin{tabular}{lllllllll}
\hline
Multiple Linear Regression - Ordinary Least Squares \tabularnewline
Variable & Parameter & S.D. & T-STATH0: parameter = 0 & 2-tail p-value & 1-tail p-value \tabularnewline
(Intercept) & 3.14254545454545 & 0.432843 & 7.2602 & 0 & 0 \tabularnewline
X & -1.92272727272727 & 0.322622 & -5.9597 & 0 & 0 \tabularnewline
M1 & -0.0985454545454535 & 0.608722 & -0.1619 & 0.872087 & 0.436044 \tabularnewline
M2 & 0.178000000000001 & 0.605293 & 0.2941 & 0.769997 & 0.384999 \tabularnewline
M3 & 0.0820000000000008 & 0.605293 & 0.1355 & 0.892817 & 0.446409 \tabularnewline
M4 & 0.00200000000000018 & 0.605293 & 0.0033 & 0.997378 & 0.498689 \tabularnewline
M5 & -0.103999999999999 & 0.605293 & -0.1718 & 0.864318 & 0.432159 \tabularnewline
M6 & -0.0739999999999996 & 0.605293 & -0.1223 & 0.903218 & 0.451609 \tabularnewline
M7 & -0.0859999999999994 & 0.605293 & -0.1421 & 0.887624 & 0.443812 \tabularnewline
M8 & -0.111999999999999 & 0.605293 & -0.185 & 0.853998 & 0.426999 \tabularnewline
M9 & -0.0719999999999994 & 0.605293 & -0.119 & 0.905821 & 0.452911 \tabularnewline
M10 & -0.0599999999999995 & 0.605293 & -0.0991 & 0.92146 & 0.46073 \tabularnewline
M11 & -0.0119999999999993 & 0.605293 & -0.0198 & 0.984267 & 0.492133 \tabularnewline
\hline
\end{tabular}
%Source: https://freestatistics.org/blog/index.php?pk=60521&T=2

[TABLE]
[ROW][C]Multiple Linear Regression - Ordinary Least Squares[/C][/ROW]
[ROW][C]Variable[/C][C]Parameter[/C][C]S.D.[/C][C]T-STATH0: parameter = 0[/C][C]2-tail p-value[/C][C]1-tail p-value[/C][/ROW]
[ROW][C](Intercept)[/C][C]3.14254545454545[/C][C]0.432843[/C][C]7.2602[/C][C]0[/C][C]0[/C][/ROW]
[ROW][C]X[/C][C]-1.92272727272727[/C][C]0.322622[/C][C]-5.9597[/C][C]0[/C][C]0[/C][/ROW]
[ROW][C]M1[/C][C]-0.0985454545454535[/C][C]0.608722[/C][C]-0.1619[/C][C]0.872087[/C][C]0.436044[/C][/ROW]
[ROW][C]M2[/C][C]0.178000000000001[/C][C]0.605293[/C][C]0.2941[/C][C]0.769997[/C][C]0.384999[/C][/ROW]
[ROW][C]M3[/C][C]0.0820000000000008[/C][C]0.605293[/C][C]0.1355[/C][C]0.892817[/C][C]0.446409[/C][/ROW]
[ROW][C]M4[/C][C]0.00200000000000018[/C][C]0.605293[/C][C]0.0033[/C][C]0.997378[/C][C]0.498689[/C][/ROW]
[ROW][C]M5[/C][C]-0.103999999999999[/C][C]0.605293[/C][C]-0.1718[/C][C]0.864318[/C][C]0.432159[/C][/ROW]
[ROW][C]M6[/C][C]-0.0739999999999996[/C][C]0.605293[/C][C]-0.1223[/C][C]0.903218[/C][C]0.451609[/C][/ROW]
[ROW][C]M7[/C][C]-0.0859999999999994[/C][C]0.605293[/C][C]-0.1421[/C][C]0.887624[/C][C]0.443812[/C][/ROW]
[ROW][C]M8[/C][C]-0.111999999999999[/C][C]0.605293[/C][C]-0.185[/C][C]0.853998[/C][C]0.426999[/C][/ROW]
[ROW][C]M9[/C][C]-0.0719999999999994[/C][C]0.605293[/C][C]-0.119[/C][C]0.905821[/C][C]0.452911[/C][/ROW]
[ROW][C]M10[/C][C]-0.0599999999999995[/C][C]0.605293[/C][C]-0.0991[/C][C]0.92146[/C][C]0.46073[/C][/ROW]
[ROW][C]M11[/C][C]-0.0119999999999993[/C][C]0.605293[/C][C]-0.0198[/C][C]0.984267[/C][C]0.492133[/C][/ROW]
[/TABLE]
Source: https://freestatistics.org/blog/index.php?pk=60521&T=2

Globally Unique Identifier (entire table): ba.freestatistics.org/blog/index.php?pk=60521&T=2

As an alternative you can also use a QR Code:  

The GUIDs for individual cells are displayed in the table below:

Multiple Linear Regression - Ordinary Least Squares
VariableParameterS.D.T-STATH0: parameter = 02-tail p-value1-tail p-value
(Intercept)3.142545454545450.4328437.260200
X-1.922727272727270.322622-5.959700
M1-0.09854545454545350.608722-0.16190.8720870.436044
M20.1780000000000010.6052930.29410.7699970.384999
M30.08200000000000080.6052930.13550.8928170.446409
M40.002000000000000180.6052930.00330.9973780.498689
M5-0.1039999999999990.605293-0.17180.8643180.432159
M6-0.07399999999999960.605293-0.12230.9032180.451609
M7-0.08599999999999940.605293-0.14210.8876240.443812
M8-0.1119999999999990.605293-0.1850.8539980.426999
M9-0.07199999999999940.605293-0.1190.9058210.452911
M10-0.05999999999999950.605293-0.09910.921460.46073
M11-0.01199999999999930.605293-0.01980.9842670.492133


Multiple Linear Regression - Regression Statistics
Multiple R0.660747900887518
R-squared0.436587788527261
Adjusted R-squared0.292737862193795
F-TEST (value)3.03502267714191
F-TEST (DF numerator)12
F-TEST (DF denominator)47
p-value0.00316967686042147
Multiple Linear Regression - Residual Statistics
Residual Standard Deviation0.957051484257931
Sum Squared Residuals43.0495345454545

\begin{tabular}{lllllllll}
\hline
Multiple Linear Regression - Regression Statistics \tabularnewline
Multiple R & 0.660747900887518 \tabularnewline
R-squared & 0.436587788527261 \tabularnewline
Adjusted R-squared & 0.292737862193795 \tabularnewline
F-TEST (value) & 3.03502267714191 \tabularnewline
F-TEST (DF numerator) & 12 \tabularnewline
F-TEST (DF denominator) & 47 \tabularnewline
p-value & 0.00316967686042147 \tabularnewline
Multiple Linear Regression - Residual Statistics \tabularnewline
Residual Standard Deviation & 0.957051484257931 \tabularnewline
Sum Squared Residuals & 43.0495345454545 \tabularnewline
\hline
\end{tabular}
%Source: https://freestatistics.org/blog/index.php?pk=60521&T=3

[TABLE]
[ROW][C]Multiple Linear Regression - Regression Statistics[/C][/ROW]
[ROW][C]Multiple R[/C][C]0.660747900887518[/C][/ROW]
[ROW][C]R-squared[/C][C]0.436587788527261[/C][/ROW]
[ROW][C]Adjusted R-squared[/C][C]0.292737862193795[/C][/ROW]
[ROW][C]F-TEST (value)[/C][C]3.03502267714191[/C][/ROW]
[ROW][C]F-TEST (DF numerator)[/C][C]12[/C][/ROW]
[ROW][C]F-TEST (DF denominator)[/C][C]47[/C][/ROW]
[ROW][C]p-value[/C][C]0.00316967686042147[/C][/ROW]
[ROW][C]Multiple Linear Regression - Residual Statistics[/C][/ROW]
[ROW][C]Residual Standard Deviation[/C][C]0.957051484257931[/C][/ROW]
[ROW][C]Sum Squared Residuals[/C][C]43.0495345454545[/C][/ROW]
[/TABLE]
Source: https://freestatistics.org/blog/index.php?pk=60521&T=3

Globally Unique Identifier (entire table): ba.freestatistics.org/blog/index.php?pk=60521&T=3

As an alternative you can also use a QR Code:  

The GUIDs for individual cells are displayed in the table below:

Multiple Linear Regression - Regression Statistics
Multiple R0.660747900887518
R-squared0.436587788527261
Adjusted R-squared0.292737862193795
F-TEST (value)3.03502267714191
F-TEST (DF numerator)12
F-TEST (DF denominator)47
p-value0.00316967686042147
Multiple Linear Regression - Residual Statistics
Residual Standard Deviation0.957051484257931
Sum Squared Residuals43.0495345454545


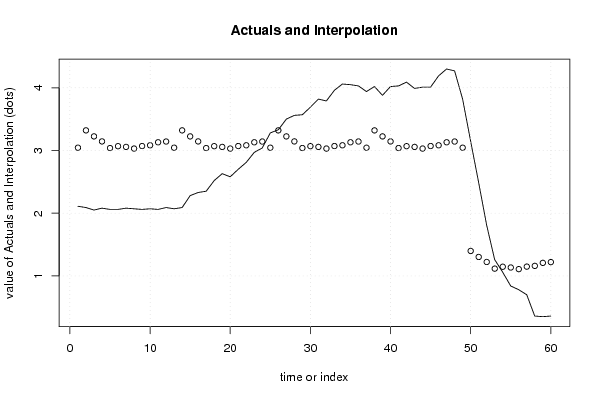
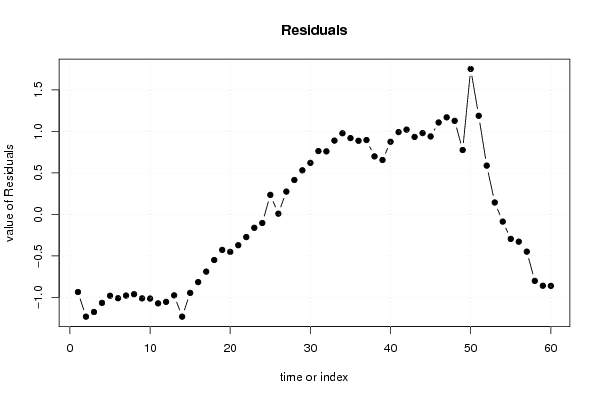
Multiple Linear Regression - Actuals, Interpolation, and Residuals
Time or IndexActualsInterpolationForecastResidualsPrediction Error
12.113.04400000000000-0.933999999999997
22.093.32054545454545-1.23054545454545
32.053.22454545454545-1.17454545454545
42.083.14454545454545-1.06454545454545
52.063.03854545454545-0.978545454545454
62.063.06854545454545-1.00854545454545
72.083.05654545454545-0.976545454545455
82.073.03054545454545-0.960545454545454
92.063.07054545454545-1.01054545454545
102.073.08254545454545-1.01254545454545
112.063.13054545454545-1.07054545454545
122.093.14254545454545-1.05254545454545
132.073.044-0.974
142.093.32054545454545-1.23054545454545
152.283.22454545454545-0.944545454545455
162.333.14454545454545-0.814545454545454
172.353.03854545454545-0.688545454545454
182.523.06854545454545-0.548545454545455
192.633.05654545454545-0.426545454545455
202.583.03054545454545-0.450545454545454
212.73.07054545454545-0.370545454545454
222.813.08254545454545-0.272545454545454
232.973.13054545454545-0.160545454545454
243.043.14254545454545-0.102545454545454
253.283.0440.235999999999999
263.333.320545454545460.00945454545454505
273.53.224545454545450.275454545454545
283.563.144545454545450.415454545454546
293.573.038545454545450.531454545454545
303.693.068545454545450.621454545454545
313.823.056545454545450.763454545454545
323.793.030545454545450.759454545454545
333.963.070545454545450.889454545454545
344.063.082545454545450.977454545454545
354.053.130545454545450.919454545454545
364.033.142545454545450.887454545454546
373.943.0440.896
384.023.320545454545460.699454545454544
393.883.224545454545450.655454545454545
404.023.144545454545450.875454545454545
414.033.038545454545450.991454545454546
424.093.068545454545451.02145454545455
433.993.056545454545450.933454545454546
444.013.030545454545450.979454545454545
454.013.070545454545450.939454545454545
464.193.082545454545451.10745454545455
474.33.130545454545451.16945454545455
484.273.142545454545451.12745454545455
493.823.0440.776
503.151.397818181818181.75218181818182
512.491.301818181818181.18818181818182
521.811.221818181818180.588181818181819
531.261.115818181818180.144181818181818
541.061.14581818181818-0.0858181818181818
550.841.13381818181818-0.293818181818182
560.781.10781818181818-0.327818181818182
570.71.14781818181818-0.447818181818182
580.361.15981818181818-0.799818181818182
590.351.20781818181818-0.857818181818182
600.361.21981818181818-0.859818181818181

\begin{tabular}{lllllllll}
\hline
Multiple Linear Regression - Actuals, Interpolation, and Residuals \tabularnewline
Time or Index & Actuals & InterpolationForecast & ResidualsPrediction Error \tabularnewline
1 & 2.11 & 3.04400000000000 & -0.933999999999997 \tabularnewline
2 & 2.09 & 3.32054545454545 & -1.23054545454545 \tabularnewline
3 & 2.05 & 3.22454545454545 & -1.17454545454545 \tabularnewline
4 & 2.08 & 3.14454545454545 & -1.06454545454545 \tabularnewline
5 & 2.06 & 3.03854545454545 & -0.978545454545454 \tabularnewline
6 & 2.06 & 3.06854545454545 & -1.00854545454545 \tabularnewline
7 & 2.08 & 3.05654545454545 & -0.976545454545455 \tabularnewline
8 & 2.07 & 3.03054545454545 & -0.960545454545454 \tabularnewline
9 & 2.06 & 3.07054545454545 & -1.01054545454545 \tabularnewline
10 & 2.07 & 3.08254545454545 & -1.01254545454545 \tabularnewline
11 & 2.06 & 3.13054545454545 & -1.07054545454545 \tabularnewline
12 & 2.09 & 3.14254545454545 & -1.05254545454545 \tabularnewline
13 & 2.07 & 3.044 & -0.974 \tabularnewline
14 & 2.09 & 3.32054545454545 & -1.23054545454545 \tabularnewline
15 & 2.28 & 3.22454545454545 & -0.944545454545455 \tabularnewline
16 & 2.33 & 3.14454545454545 & -0.814545454545454 \tabularnewline
17 & 2.35 & 3.03854545454545 & -0.688545454545454 \tabularnewline
18 & 2.52 & 3.06854545454545 & -0.548545454545455 \tabularnewline
19 & 2.63 & 3.05654545454545 & -0.426545454545455 \tabularnewline
20 & 2.58 & 3.03054545454545 & -0.450545454545454 \tabularnewline
21 & 2.7 & 3.07054545454545 & -0.370545454545454 \tabularnewline
22 & 2.81 & 3.08254545454545 & -0.272545454545454 \tabularnewline
23 & 2.97 & 3.13054545454545 & -0.160545454545454 \tabularnewline
24 & 3.04 & 3.14254545454545 & -0.102545454545454 \tabularnewline
25 & 3.28 & 3.044 & 0.235999999999999 \tabularnewline
26 & 3.33 & 3.32054545454546 & 0.00945454545454505 \tabularnewline
27 & 3.5 & 3.22454545454545 & 0.275454545454545 \tabularnewline
28 & 3.56 & 3.14454545454545 & 0.415454545454546 \tabularnewline
29 & 3.57 & 3.03854545454545 & 0.531454545454545 \tabularnewline
30 & 3.69 & 3.06854545454545 & 0.621454545454545 \tabularnewline
31 & 3.82 & 3.05654545454545 & 0.763454545454545 \tabularnewline
32 & 3.79 & 3.03054545454545 & 0.759454545454545 \tabularnewline
33 & 3.96 & 3.07054545454545 & 0.889454545454545 \tabularnewline
34 & 4.06 & 3.08254545454545 & 0.977454545454545 \tabularnewline
35 & 4.05 & 3.13054545454545 & 0.919454545454545 \tabularnewline
36 & 4.03 & 3.14254545454545 & 0.887454545454546 \tabularnewline
37 & 3.94 & 3.044 & 0.896 \tabularnewline
38 & 4.02 & 3.32054545454546 & 0.699454545454544 \tabularnewline
39 & 3.88 & 3.22454545454545 & 0.655454545454545 \tabularnewline
40 & 4.02 & 3.14454545454545 & 0.875454545454545 \tabularnewline
41 & 4.03 & 3.03854545454545 & 0.991454545454546 \tabularnewline
42 & 4.09 & 3.06854545454545 & 1.02145454545455 \tabularnewline
43 & 3.99 & 3.05654545454545 & 0.933454545454546 \tabularnewline
44 & 4.01 & 3.03054545454545 & 0.979454545454545 \tabularnewline
45 & 4.01 & 3.07054545454545 & 0.939454545454545 \tabularnewline
46 & 4.19 & 3.08254545454545 & 1.10745454545455 \tabularnewline
47 & 4.3 & 3.13054545454545 & 1.16945454545455 \tabularnewline
48 & 4.27 & 3.14254545454545 & 1.12745454545455 \tabularnewline
49 & 3.82 & 3.044 & 0.776 \tabularnewline
50 & 3.15 & 1.39781818181818 & 1.75218181818182 \tabularnewline
51 & 2.49 & 1.30181818181818 & 1.18818181818182 \tabularnewline
52 & 1.81 & 1.22181818181818 & 0.588181818181819 \tabularnewline
53 & 1.26 & 1.11581818181818 & 0.144181818181818 \tabularnewline
54 & 1.06 & 1.14581818181818 & -0.0858181818181818 \tabularnewline
55 & 0.84 & 1.13381818181818 & -0.293818181818182 \tabularnewline
56 & 0.78 & 1.10781818181818 & -0.327818181818182 \tabularnewline
57 & 0.7 & 1.14781818181818 & -0.447818181818182 \tabularnewline
58 & 0.36 & 1.15981818181818 & -0.799818181818182 \tabularnewline
59 & 0.35 & 1.20781818181818 & -0.857818181818182 \tabularnewline
60 & 0.36 & 1.21981818181818 & -0.859818181818181 \tabularnewline
\hline
\end{tabular}
%Source: https://freestatistics.org/blog/index.php?pk=60521&T=4

[TABLE]
[ROW][C]Multiple Linear Regression - Actuals, Interpolation, and Residuals[/C][/ROW]
[ROW][C]Time or Index[/C][C]Actuals[/C][C]InterpolationForecast[/C][C]ResidualsPrediction Error[/C][/ROW]
[ROW][C]1[/C][C]2.11[/C][C]3.04400000000000[/C][C]-0.933999999999997[/C][/ROW]
[ROW][C]2[/C][C]2.09[/C][C]3.32054545454545[/C][C]-1.23054545454545[/C][/ROW]
[ROW][C]3[/C][C]2.05[/C][C]3.22454545454545[/C][C]-1.17454545454545[/C][/ROW]
[ROW][C]4[/C][C]2.08[/C][C]3.14454545454545[/C][C]-1.06454545454545[/C][/ROW]
[ROW][C]5[/C][C]2.06[/C][C]3.03854545454545[/C][C]-0.978545454545454[/C][/ROW]
[ROW][C]6[/C][C]2.06[/C][C]3.06854545454545[/C][C]-1.00854545454545[/C][/ROW]
[ROW][C]7[/C][C]2.08[/C][C]3.05654545454545[/C][C]-0.976545454545455[/C][/ROW]
[ROW][C]8[/C][C]2.07[/C][C]3.03054545454545[/C][C]-0.960545454545454[/C][/ROW]
[ROW][C]9[/C][C]2.06[/C][C]3.07054545454545[/C][C]-1.01054545454545[/C][/ROW]
[ROW][C]10[/C][C]2.07[/C][C]3.08254545454545[/C][C]-1.01254545454545[/C][/ROW]
[ROW][C]11[/C][C]2.06[/C][C]3.13054545454545[/C][C]-1.07054545454545[/C][/ROW]
[ROW][C]12[/C][C]2.09[/C][C]3.14254545454545[/C][C]-1.05254545454545[/C][/ROW]
[ROW][C]13[/C][C]2.07[/C][C]3.044[/C][C]-0.974[/C][/ROW]
[ROW][C]14[/C][C]2.09[/C][C]3.32054545454545[/C][C]-1.23054545454545[/C][/ROW]
[ROW][C]15[/C][C]2.28[/C][C]3.22454545454545[/C][C]-0.944545454545455[/C][/ROW]
[ROW][C]16[/C][C]2.33[/C][C]3.14454545454545[/C][C]-0.814545454545454[/C][/ROW]
[ROW][C]17[/C][C]2.35[/C][C]3.03854545454545[/C][C]-0.688545454545454[/C][/ROW]
[ROW][C]18[/C][C]2.52[/C][C]3.06854545454545[/C][C]-0.548545454545455[/C][/ROW]
[ROW][C]19[/C][C]2.63[/C][C]3.05654545454545[/C][C]-0.426545454545455[/C][/ROW]
[ROW][C]20[/C][C]2.58[/C][C]3.03054545454545[/C][C]-0.450545454545454[/C][/ROW]
[ROW][C]21[/C][C]2.7[/C][C]3.07054545454545[/C][C]-0.370545454545454[/C][/ROW]
[ROW][C]22[/C][C]2.81[/C][C]3.08254545454545[/C][C]-0.272545454545454[/C][/ROW]
[ROW][C]23[/C][C]2.97[/C][C]3.13054545454545[/C][C]-0.160545454545454[/C][/ROW]
[ROW][C]24[/C][C]3.04[/C][C]3.14254545454545[/C][C]-0.102545454545454[/C][/ROW]
[ROW][C]25[/C][C]3.28[/C][C]3.044[/C][C]0.235999999999999[/C][/ROW]
[ROW][C]26[/C][C]3.33[/C][C]3.32054545454546[/C][C]0.00945454545454505[/C][/ROW]
[ROW][C]27[/C][C]3.5[/C][C]3.22454545454545[/C][C]0.275454545454545[/C][/ROW]
[ROW][C]28[/C][C]3.56[/C][C]3.14454545454545[/C][C]0.415454545454546[/C][/ROW]
[ROW][C]29[/C][C]3.57[/C][C]3.03854545454545[/C][C]0.531454545454545[/C][/ROW]
[ROW][C]30[/C][C]3.69[/C][C]3.06854545454545[/C][C]0.621454545454545[/C][/ROW]
[ROW][C]31[/C][C]3.82[/C][C]3.05654545454545[/C][C]0.763454545454545[/C][/ROW]
[ROW][C]32[/C][C]3.79[/C][C]3.03054545454545[/C][C]0.759454545454545[/C][/ROW]
[ROW][C]33[/C][C]3.96[/C][C]3.07054545454545[/C][C]0.889454545454545[/C][/ROW]
[ROW][C]34[/C][C]4.06[/C][C]3.08254545454545[/C][C]0.977454545454545[/C][/ROW]
[ROW][C]35[/C][C]4.05[/C][C]3.13054545454545[/C][C]0.919454545454545[/C][/ROW]
[ROW][C]36[/C][C]4.03[/C][C]3.14254545454545[/C][C]0.887454545454546[/C][/ROW]
[ROW][C]37[/C][C]3.94[/C][C]3.044[/C][C]0.896[/C][/ROW]
[ROW][C]38[/C][C]4.02[/C][C]3.32054545454546[/C][C]0.699454545454544[/C][/ROW]
[ROW][C]39[/C][C]3.88[/C][C]3.22454545454545[/C][C]0.655454545454545[/C][/ROW]
[ROW][C]40[/C][C]4.02[/C][C]3.14454545454545[/C][C]0.875454545454545[/C][/ROW]
[ROW][C]41[/C][C]4.03[/C][C]3.03854545454545[/C][C]0.991454545454546[/C][/ROW]
[ROW][C]42[/C][C]4.09[/C][C]3.06854545454545[/C][C]1.02145454545455[/C][/ROW]
[ROW][C]43[/C][C]3.99[/C][C]3.05654545454545[/C][C]0.933454545454546[/C][/ROW]
[ROW][C]44[/C][C]4.01[/C][C]3.03054545454545[/C][C]0.979454545454545[/C][/ROW]
[ROW][C]45[/C][C]4.01[/C][C]3.07054545454545[/C][C]0.939454545454545[/C][/ROW]
[ROW][C]46[/C][C]4.19[/C][C]3.08254545454545[/C][C]1.10745454545455[/C][/ROW]
[ROW][C]47[/C][C]4.3[/C][C]3.13054545454545[/C][C]1.16945454545455[/C][/ROW]
[ROW][C]48[/C][C]4.27[/C][C]3.14254545454545[/C][C]1.12745454545455[/C][/ROW]
[ROW][C]49[/C][C]3.82[/C][C]3.044[/C][C]0.776[/C][/ROW]
[ROW][C]50[/C][C]3.15[/C][C]1.39781818181818[/C][C]1.75218181818182[/C][/ROW]
[ROW][C]51[/C][C]2.49[/C][C]1.30181818181818[/C][C]1.18818181818182[/C][/ROW]
[ROW][C]52[/C][C]1.81[/C][C]1.22181818181818[/C][C]0.588181818181819[/C][/ROW]
[ROW][C]53[/C][C]1.26[/C][C]1.11581818181818[/C][C]0.144181818181818[/C][/ROW]
[ROW][C]54[/C][C]1.06[/C][C]1.14581818181818[/C][C]-0.0858181818181818[/C][/ROW]
[ROW][C]55[/C][C]0.84[/C][C]1.13381818181818[/C][C]-0.293818181818182[/C][/ROW]
[ROW][C]56[/C][C]0.78[/C][C]1.10781818181818[/C][C]-0.327818181818182[/C][/ROW]
[ROW][C]57[/C][C]0.7[/C][C]1.14781818181818[/C][C]-0.447818181818182[/C][/ROW]
[ROW][C]58[/C][C]0.36[/C][C]1.15981818181818[/C][C]-0.799818181818182[/C][/ROW]
[ROW][C]59[/C][C]0.35[/C][C]1.20781818181818[/C][C]-0.857818181818182[/C][/ROW]
[ROW][C]60[/C][C]0.36[/C][C]1.21981818181818[/C][C]-0.859818181818181[/C][/ROW]
[/TABLE]
Source: https://freestatistics.org/blog/index.php?pk=60521&T=4

Globally Unique Identifier (entire table): ba.freestatistics.org/blog/index.php?pk=60521&T=4

As an alternative you can also use a QR Code:  

The GUIDs for individual cells are displayed in the table below:

Multiple Linear Regression - Actuals, Interpolation, and Residuals
Time or IndexActualsInterpolationForecastResidualsPrediction Error
12.113.04400000000000-0.933999999999997
22.093.32054545454545-1.23054545454545
32.053.22454545454545-1.17454545454545
42.083.14454545454545-1.06454545454545
52.063.03854545454545-0.978545454545454
62.063.06854545454545-1.00854545454545
72.083.05654545454545-0.976545454545455
82.073.03054545454545-0.960545454545454
92.063.07054545454545-1.01054545454545
102.073.08254545454545-1.01254545454545
112.063.13054545454545-1.07054545454545
122.093.14254545454545-1.05254545454545
132.073.044-0.974
142.093.32054545454545-1.23054545454545
152.283.22454545454545-0.944545454545455
162.333.14454545454545-0.814545454545454
172.353.03854545454545-0.688545454545454
182.523.06854545454545-0.548545454545455
192.633.05654545454545-0.426545454545455
202.583.03054545454545-0.450545454545454
212.73.07054545454545-0.370545454545454
222.813.08254545454545-0.272545454545454
232.973.13054545454545-0.160545454545454
243.043.14254545454545-0.102545454545454
253.283.0440.235999999999999
263.333.320545454545460.00945454545454505
273.53.224545454545450.275454545454545
283.563.144545454545450.415454545454546
293.573.038545454545450.531454545454545
303.693.068545454545450.621454545454545
313.823.056545454545450.763454545454545
323.793.030545454545450.759454545454545
333.963.070545454545450.889454545454545
344.063.082545454545450.977454545454545
354.053.130545454545450.919454545454545
364.033.142545454545450.887454545454546
373.943.0440.896
384.023.320545454545460.699454545454544
393.883.224545454545450.655454545454545
404.023.144545454545450.875454545454545
414.033.038545454545450.991454545454546
424.093.068545454545451.02145454545455
433.993.056545454545450.933454545454546
444.013.030545454545450.979454545454545
454.013.070545454545450.939454545454545
464.193.082545454545451.10745454545455
474.33.130545454545451.16945454545455
484.273.142545454545451.12745454545455
493.823.0440.776
503.151.397818181818181.75218181818182
512.491.301818181818181.18818181818182
521.811.221818181818180.588181818181819
531.261.115818181818180.144181818181818
541.061.14581818181818-0.0858181818181818
550.841.13381818181818-0.293818181818182
560.781.10781818181818-0.327818181818182
570.71.14781818181818-0.447818181818182
580.361.15981818181818-0.799818181818182
590.351.20781818181818-0.857818181818182
600.361.21981818181818-0.859818181818181


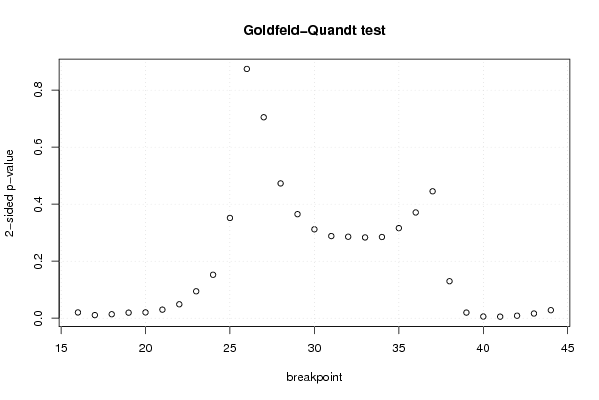
Goldfeld-Quandt test for Heteroskedasticity
p-valuesAlternative Hypothesis
breakpoint indexgreater2-sidedless
160.01014143798551080.02028287597102170.98985856201449
170.005454162393866130.01090832478773230.994545837606134
180.006980236162357860.01396047232471570.993019763837642
190.009727805419629020.01945561083925800.99027219458037
200.01022724336292000.02045448672584010.98977275663708
210.0150331883015810.0300663766031620.98496681169842
220.02444329469780930.04888658939561860.97555670530219
230.04722801814314500.09445603628629010.952771981856855
240.07620111342478960.1524022268495790.92379888657521
250.1758307867679080.3516615735358150.824169213232092
260.4371789009032160.8743578018064320.562821099096784
270.6475404699376730.7049190601246550.352459530062327
280.7635596574770720.4728806850458570.236440342522928
290.817497288004220.3650054239915610.182502711995780
300.844067176020240.311865647959520.15593282397976
310.8559226244733360.2881547510533270.144077375526664
320.8571253527775520.2857492944448970.142874647222448
330.8583220487063250.2833559025873500.141677951293675
340.857551835755830.2848963284883390.142448164244169
350.841976506851060.3160469862978810.158023493148940
360.814514074907920.3709718501841610.185485925092080
370.7774034292177330.4451931415645340.222596570782267
380.9350948322493020.1298103355013970.0649051677506984
390.9901329549229470.01973409015410510.00986704507705255
400.9970557174474430.005888565105114770.00294428255255739
410.9972516227341940.005496754531612830.00274837726580642
420.9956121717443470.008775656511305820.00438782825565291
430.991752445470980.01649510905803940.00824755452901972
440.985920530944210.02815893811157860.0140794690557893

\begin{tabular}{lllllllll}
\hline
Goldfeld-Quandt test for Heteroskedasticity \tabularnewline
p-values & Alternative Hypothesis \tabularnewline
breakpoint index & greater & 2-sided & less \tabularnewline
16 & 0.0101414379855108 & 0.0202828759710217 & 0.98985856201449 \tabularnewline
17 & 0.00545416239386613 & 0.0109083247877323 & 0.994545837606134 \tabularnewline
18 & 0.00698023616235786 & 0.0139604723247157 & 0.993019763837642 \tabularnewline
19 & 0.00972780541962902 & 0.0194556108392580 & 0.99027219458037 \tabularnewline
20 & 0.0102272433629200 & 0.0204544867258401 & 0.98977275663708 \tabularnewline
21 & 0.015033188301581 & 0.030066376603162 & 0.98496681169842 \tabularnewline
22 & 0.0244432946978093 & 0.0488865893956186 & 0.97555670530219 \tabularnewline
23 & 0.0472280181431450 & 0.0944560362862901 & 0.952771981856855 \tabularnewline
24 & 0.0762011134247896 & 0.152402226849579 & 0.92379888657521 \tabularnewline
25 & 0.175830786767908 & 0.351661573535815 & 0.824169213232092 \tabularnewline
26 & 0.437178900903216 & 0.874357801806432 & 0.562821099096784 \tabularnewline
27 & 0.647540469937673 & 0.704919060124655 & 0.352459530062327 \tabularnewline
28 & 0.763559657477072 & 0.472880685045857 & 0.236440342522928 \tabularnewline
29 & 0.81749728800422 & 0.365005423991561 & 0.182502711995780 \tabularnewline
30 & 0.84406717602024 & 0.31186564795952 & 0.15593282397976 \tabularnewline
31 & 0.855922624473336 & 0.288154751053327 & 0.144077375526664 \tabularnewline
32 & 0.857125352777552 & 0.285749294444897 & 0.142874647222448 \tabularnewline
33 & 0.858322048706325 & 0.283355902587350 & 0.141677951293675 \tabularnewline
34 & 0.85755183575583 & 0.284896328488339 & 0.142448164244169 \tabularnewline
35 & 0.84197650685106 & 0.316046986297881 & 0.158023493148940 \tabularnewline
36 & 0.81451407490792 & 0.370971850184161 & 0.185485925092080 \tabularnewline
37 & 0.777403429217733 & 0.445193141564534 & 0.222596570782267 \tabularnewline
38 & 0.935094832249302 & 0.129810335501397 & 0.0649051677506984 \tabularnewline
39 & 0.990132954922947 & 0.0197340901541051 & 0.00986704507705255 \tabularnewline
40 & 0.997055717447443 & 0.00588856510511477 & 0.00294428255255739 \tabularnewline
41 & 0.997251622734194 & 0.00549675453161283 & 0.00274837726580642 \tabularnewline
42 & 0.995612171744347 & 0.00877565651130582 & 0.00438782825565291 \tabularnewline
43 & 0.99175244547098 & 0.0164951090580394 & 0.00824755452901972 \tabularnewline
44 & 0.98592053094421 & 0.0281589381115786 & 0.0140794690557893 \tabularnewline
\hline
\end{tabular}
%Source: https://freestatistics.org/blog/index.php?pk=60521&T=5

[TABLE]
[ROW][C]Goldfeld-Quandt test for Heteroskedasticity[/C][/ROW]
[ROW][C]p-values[/C][C]Alternative Hypothesis[/C][/ROW]
[ROW][C]breakpoint index[/C][C]greater[/C][C]2-sided[/C][C]less[/C][/ROW]
[ROW][C]16[/C][C]0.0101414379855108[/C][C]0.0202828759710217[/C][C]0.98985856201449[/C][/ROW]
[ROW][C]17[/C][C]0.00545416239386613[/C][C]0.0109083247877323[/C][C]0.994545837606134[/C][/ROW]
[ROW][C]18[/C][C]0.00698023616235786[/C][C]0.0139604723247157[/C][C]0.993019763837642[/C][/ROW]
[ROW][C]19[/C][C]0.00972780541962902[/C][C]0.0194556108392580[/C][C]0.99027219458037[/C][/ROW]
[ROW][C]20[/C][C]0.0102272433629200[/C][C]0.0204544867258401[/C][C]0.98977275663708[/C][/ROW]
[ROW][C]21[/C][C]0.015033188301581[/C][C]0.030066376603162[/C][C]0.98496681169842[/C][/ROW]
[ROW][C]22[/C][C]0.0244432946978093[/C][C]0.0488865893956186[/C][C]0.97555670530219[/C][/ROW]
[ROW][C]23[/C][C]0.0472280181431450[/C][C]0.0944560362862901[/C][C]0.952771981856855[/C][/ROW]
[ROW][C]24[/C][C]0.0762011134247896[/C][C]0.152402226849579[/C][C]0.92379888657521[/C][/ROW]
[ROW][C]25[/C][C]0.175830786767908[/C][C]0.351661573535815[/C][C]0.824169213232092[/C][/ROW]
[ROW][C]26[/C][C]0.437178900903216[/C][C]0.874357801806432[/C][C]0.562821099096784[/C][/ROW]
[ROW][C]27[/C][C]0.647540469937673[/C][C]0.704919060124655[/C][C]0.352459530062327[/C][/ROW]
[ROW][C]28[/C][C]0.763559657477072[/C][C]0.472880685045857[/C][C]0.236440342522928[/C][/ROW]
[ROW][C]29[/C][C]0.81749728800422[/C][C]0.365005423991561[/C][C]0.182502711995780[/C][/ROW]
[ROW][C]30[/C][C]0.84406717602024[/C][C]0.31186564795952[/C][C]0.15593282397976[/C][/ROW]
[ROW][C]31[/C][C]0.855922624473336[/C][C]0.288154751053327[/C][C]0.144077375526664[/C][/ROW]
[ROW][C]32[/C][C]0.857125352777552[/C][C]0.285749294444897[/C][C]0.142874647222448[/C][/ROW]
[ROW][C]33[/C][C]0.858322048706325[/C][C]0.283355902587350[/C][C]0.141677951293675[/C][/ROW]
[ROW][C]34[/C][C]0.85755183575583[/C][C]0.284896328488339[/C][C]0.142448164244169[/C][/ROW]
[ROW][C]35[/C][C]0.84197650685106[/C][C]0.316046986297881[/C][C]0.158023493148940[/C][/ROW]
[ROW][C]36[/C][C]0.81451407490792[/C][C]0.370971850184161[/C][C]0.185485925092080[/C][/ROW]
[ROW][C]37[/C][C]0.777403429217733[/C][C]0.445193141564534[/C][C]0.222596570782267[/C][/ROW]
[ROW][C]38[/C][C]0.935094832249302[/C][C]0.129810335501397[/C][C]0.0649051677506984[/C][/ROW]
[ROW][C]39[/C][C]0.990132954922947[/C][C]0.0197340901541051[/C][C]0.00986704507705255[/C][/ROW]
[ROW][C]40[/C][C]0.997055717447443[/C][C]0.00588856510511477[/C][C]0.00294428255255739[/C][/ROW]
[ROW][C]41[/C][C]0.997251622734194[/C][C]0.00549675453161283[/C][C]0.00274837726580642[/C][/ROW]
[ROW][C]42[/C][C]0.995612171744347[/C][C]0.00877565651130582[/C][C]0.00438782825565291[/C][/ROW]
[ROW][C]43[/C][C]0.99175244547098[/C][C]0.0164951090580394[/C][C]0.00824755452901972[/C][/ROW]
[ROW][C]44[/C][C]0.98592053094421[/C][C]0.0281589381115786[/C][C]0.0140794690557893[/C][/ROW]
[/TABLE]
Source: https://freestatistics.org/blog/index.php?pk=60521&T=5

Globally Unique Identifier (entire table): ba.freestatistics.org/blog/index.php?pk=60521&T=5

As an alternative you can also use a QR Code:  

The GUIDs for individual cells are displayed in the table below:

Goldfeld-Quandt test for Heteroskedasticity
p-valuesAlternative Hypothesis
breakpoint indexgreater2-sidedless
160.01014143798551080.02028287597102170.98985856201449
170.005454162393866130.01090832478773230.994545837606134
180.006980236162357860.01396047232471570.993019763837642
190.009727805419629020.01945561083925800.99027219458037
200.01022724336292000.02045448672584010.98977275663708
210.0150331883015810.0300663766031620.98496681169842
220.02444329469780930.04888658939561860.97555670530219
230.04722801814314500.09445603628629010.952771981856855
240.07620111342478960.1524022268495790.92379888657521
250.1758307867679080.3516615735358150.824169213232092
260.4371789009032160.8743578018064320.562821099096784
270.6475404699376730.7049190601246550.352459530062327
280.7635596574770720.4728806850458570.236440342522928
290.817497288004220.3650054239915610.182502711995780
300.844067176020240.311865647959520.15593282397976
310.8559226244733360.2881547510533270.144077375526664
320.8571253527775520.2857492944448970.142874647222448
330.8583220487063250.2833559025873500.141677951293675
340.857551835755830.2848963284883390.142448164244169
350.841976506851060.3160469862978810.158023493148940
360.814514074907920.3709718501841610.185485925092080
370.7774034292177330.4451931415645340.222596570782267
380.9350948322493020.1298103355013970.0649051677506984
390.9901329549229470.01973409015410510.00986704507705255
400.9970557174474430.005888565105114770.00294428255255739
410.9972516227341940.005496754531612830.00274837726580642
420.9956121717443470.008775656511305820.00438782825565291
430.991752445470980.01649510905803940.00824755452901972
440.985920530944210.02815893811157860.0140794690557893


Meta Analysis of Goldfeld-Quandt test for Heteroskedasticity
Description# significant tests% significant testsOK/NOK
1% type I error level30.103448275862069NOK
5% type I error level130.448275862068966NOK
10% type I error level140.482758620689655NOK

\begin{tabular}{lllllllll}
\hline
Meta Analysis of Goldfeld-Quandt test for Heteroskedasticity \tabularnewline
Description & # significant tests & % significant tests & OK/NOK \tabularnewline
1% type I error level & 3 & 0.103448275862069 & NOK \tabularnewline
5% type I error level & 13 & 0.448275862068966 & NOK \tabularnewline
10% type I error level & 14 & 0.482758620689655 & NOK \tabularnewline
\hline
\end{tabular}
%Source: https://freestatistics.org/blog/index.php?pk=60521&T=6

[TABLE]
[ROW][C]Meta Analysis of Goldfeld-Quandt test for Heteroskedasticity[/C][/ROW]
[ROW][C]Description[/C][C]# significant tests[/C][C]% significant tests[/C][C]OK/NOK[/C][/ROW]
[ROW][C]1% type I error level[/C][C]3[/C][C]0.103448275862069[/C][C]NOK[/C][/ROW]
[ROW][C]5% type I error level[/C][C]13[/C][C]0.448275862068966[/C][C]NOK[/C][/ROW]
[ROW][C]10% type I error level[/C][C]14[/C][C]0.482758620689655[/C][C]NOK[/C][/ROW]
[/TABLE]
Source: https://freestatistics.org/blog/index.php?pk=60521&T=6

Globally Unique Identifier (entire table): ba.freestatistics.org/blog/index.php?pk=60521&T=6

As an alternative you can also use a QR Code:  

The GUIDs for individual cells are displayed in the table below:

Meta Analysis of Goldfeld-Quandt test for Heteroskedasticity
Description# significant tests% significant testsOK/NOK
1% type I error level30.103448275862069NOK
5% type I error level130.448275862068966NOK
10% type I error level140.482758620689655NOK


Parameters (Session):
par1 = 1 ; par2 = Include Monthly Dummies ; par3 = No Linear Trend ;
Parameters (R input):
par1 = 1 ; par2 = Include Monthly Dummies ; par3 = No Linear Trend ;
R code (references can be found in the software module):
library(lattice)
library(lmtest)
n25 <- 25 #minimum number of obs. for Goldfeld-Quandt test
par1 <- as.numeric(par1)
x <- t(y)
k <- length(x[1,])
n <- length(x[,1])
x1 <- cbind(x[,par1], x[,1:k!=par1])
mycolnames <- c(colnames(x)[par1], colnames(x)[1:k!=par1])
colnames(x1) <- mycolnames #colnames(x)[par1]
x <- x1
if (par3 == 'First Differences'){
x2 <- array(0, dim=c(n-1,k), dimnames=list(1:(n-1), paste('(1-B)',colnames(x),sep='')))
for (i in 1:n-1) {
for (j in 1:k) {
x2[i,j] <- x[i+1,j] - x[i,j]
}
}
x <- x2
}
if (par2 == 'Include Monthly Dummies'){
x2 <- array(0, dim=c(n,11), dimnames=list(1:n, paste('M', seq(1:11), sep ='')))
for (i in 1:11){
x2[seq(i,n,12),i] <- 1
}
x <- cbind(x, x2)
}
if (par2 == 'Include Quarterly Dummies'){
x2 <- array(0, dim=c(n,3), dimnames=list(1:n, paste('Q', seq(1:3), sep ='')))
for (i in 1:3){
x2[seq(i,n,4),i] <- 1
}
x <- cbind(x, x2)
}
k <- length(x[1,])
if (par3 == 'Linear Trend'){
x <- cbind(x, c(1:n))
colnames(x)[k+1] <- 't'
}
x
k <- length(x[1,])
df <- as.data.frame(x)
(mylm <- lm(df))
(mysum <- summary(mylm))
if (n > n25) {
kp3 <- k + 3
nmkm3 <- n - k - 3
gqarr <- array(NA, dim=c(nmkm3-kp3+1,3))
numgqtests <- 0
numsignificant1 <- 0
numsignificant5 <- 0
numsignificant10 <- 0
for (mypoint in kp3:nmkm3) {
j <- 0
numgqtests <- numgqtests + 1
for (myalt in c('greater', 'two.sided', 'less')) {
j <- j + 1
gqarr[mypoint-kp3+1,j] <- gqtest(mylm, point=mypoint, alternative=myalt)$p.value
}
if (gqarr[mypoint-kp3+1,2] < 0.01) numsignificant1 <- numsignificant1 + 1
if (gqarr[mypoint-kp3+1,2] < 0.05) numsignificant5 <- numsignificant5 + 1
if (gqarr[mypoint-kp3+1,2] < 0.10) numsignificant10 <- numsignificant10 + 1
}
gqarr
}
bitmap(file='test0.png')
plot(x[,1], type='l', main='Actuals and Interpolation', ylab='value of Actuals and Interpolation (dots)', xlab='time or index')
points(x[,1]-mysum$resid)
grid()
dev.off()
bitmap(file='test1.png')
plot(mysum$resid, type='b', pch=19, main='Residuals', ylab='value of Residuals', xlab='time or index')
grid()
dev.off()
bitmap(file='test2.png')
hist(mysum$resid, main='Residual Histogram', xlab='values of Residuals')
grid()
dev.off()
bitmap(file='test3.png')
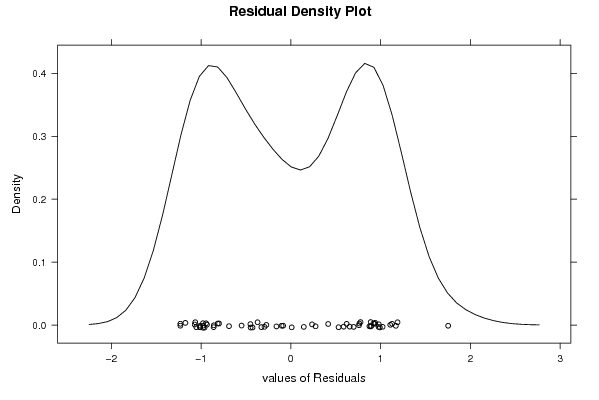
densityplot(~mysum$resid,col='black',main='Residual Density Plot', xlab='values of Residuals')
dev.off()
bitmap(file='test4.png')
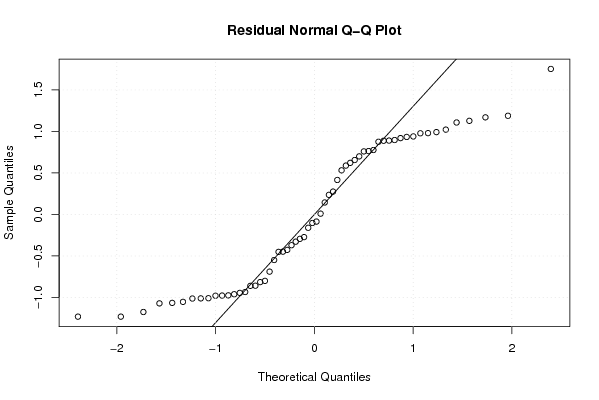
qqnorm(mysum$resid, main='Residual Normal Q-Q Plot')
qqline(mysum$resid)
grid()
dev.off()
(myerror <- as.ts(mysum$resid))
bitmap(file='test5.png')
dum <- cbind(lag(myerror,k=1),myerror)
dum
dum1 <- dum[2:length(myerror),]
dum1
z <- as.data.frame(dum1)
z
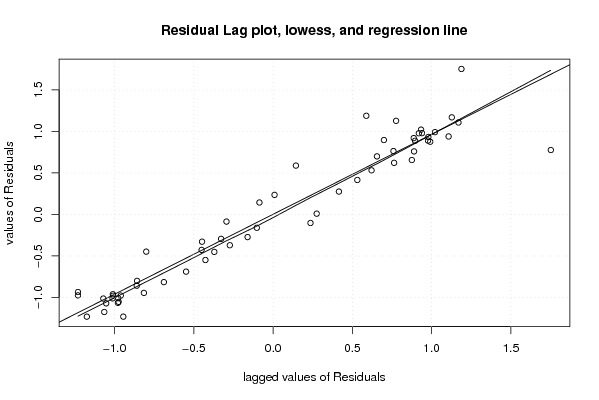
plot(z,main=paste('Residual Lag plot, lowess, and regression line'), ylab='values of Residuals', xlab='lagged values of Residuals')
lines(lowess(z))
abline(lm(z))
grid()
dev.off()
bitmap(file='test6.png')
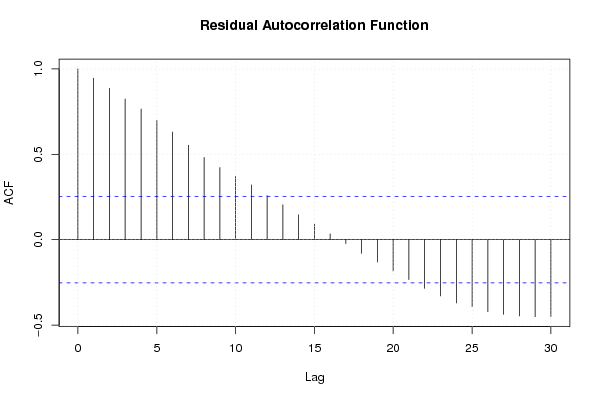
acf(mysum$resid, lag.max=length(mysum$resid)/2, main='Residual Autocorrelation Function')
grid()
dev.off()
bitmap(file='test7.png')
pacf(mysum$resid, lag.max=length(mysum$resid)/2, main='Residual Partial Autocorrelation Function')
grid()
dev.off()
bitmap(file='test8.png')
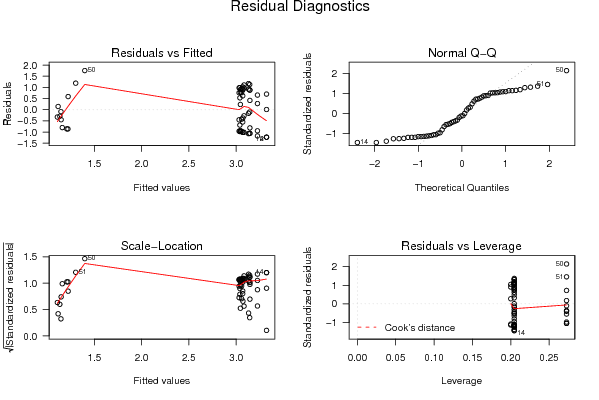
opar <- par(mfrow = c(2,2), oma = c(0, 0, 1.1, 0))
plot(mylm, las = 1, sub='Residual Diagnostics')
par(opar)
dev.off()
if (n > n25) {
bitmap(file='test9.png')
plot(kp3:nmkm3,gqarr[,2], main='Goldfeld-Quandt test',ylab='2-sided p-value',xlab='breakpoint')
grid()
dev.off()
}
load(file='createtable')
a<-table.start()
a<-table.row.start(a)
a<-table.element(a, 'Multiple Linear Regression - Estimated Regression Equation', 1, TRUE)
a<-table.row.end(a)
myeq <- colnames(x)[1]
myeq <- paste(myeq, '[t] = ', sep='')
for (i in 1:k){
if (mysum$coefficients[i,1] > 0) myeq <- paste(myeq, '+', '')
myeq <- paste(myeq, mysum$coefficients[i,1], sep=' ')
if (rownames(mysum$coefficients)[i] != '(Intercept)') {
myeq <- paste(myeq, rownames(mysum$coefficients)[i], sep='')
if (rownames(mysum$coefficients)[i] != 't') myeq <- paste(myeq, '[t]', sep='')
}
}
myeq <- paste(myeq, ' + e[t]')
a<-table.row.start(a)
a<-table.element(a, myeq)
a<-table.row.end(a)
a<-table.end(a)
table.save(a,file='mytable1.tab')
a<-table.start()
a<-table.row.start(a)
a<-table.element(a,hyperlink('ols1.htm','Multiple Linear Regression - Ordinary Least Squares',''), 6, TRUE)
a<-table.row.end(a)
a<-table.row.start(a)
a<-table.element(a,'Variable',header=TRUE)
a<-table.element(a,'Parameter',header=TRUE)
a<-table.element(a,'S.D.',header=TRUE)
a<-table.element(a,'T-STAT
H0: parameter = 0',header=TRUE)
a<-table.element(a,'2-tail p-value',header=TRUE)
a<-table.element(a,'1-tail p-value',header=TRUE)
a<-table.row.end(a)
for (i in 1:k){
a<-table.row.start(a)
a<-table.element(a,rownames(mysum$coefficients)[i],header=TRUE)
a<-table.element(a,mysum$coefficients[i,1])
a<-table.element(a, round(mysum$coefficients[i,2],6))
a<-table.element(a, round(mysum$coefficients[i,3],4))
a<-table.element(a, round(mysum$coefficients[i,4],6))
a<-table.element(a, round(mysum$coefficients[i,4]/2,6))
a<-table.row.end(a)
}
a<-table.end(a)
table.save(a,file='mytable2.tab')
a<-table.start()
a<-table.row.start(a)
a<-table.element(a, 'Multiple Linear Regression - Regression Statistics', 2, TRUE)
a<-table.row.end(a)
a<-table.row.start(a)
a<-table.element(a, 'Multiple R',1,TRUE)
a<-table.element(a, sqrt(mysum$r.squared))
a<-table.row.end(a)
a<-table.row.start(a)
a<-table.element(a, 'R-squared',1,TRUE)
a<-table.element(a, mysum$r.squared)
a<-table.row.end(a)
a<-table.row.start(a)
a<-table.element(a, 'Adjusted R-squared',1,TRUE)
a<-table.element(a, mysum$adj.r.squared)
a<-table.row.end(a)
a<-table.row.start(a)
a<-table.element(a, 'F-TEST (value)',1,TRUE)
a<-table.element(a, mysum$fstatistic[1])
a<-table.row.end(a)
a<-table.row.start(a)
a<-table.element(a, 'F-TEST (DF numerator)',1,TRUE)
a<-table.element(a, mysum$fstatistic[2])
a<-table.row.end(a)
a<-table.row.start(a)
a<-table.element(a, 'F-TEST (DF denominator)',1,TRUE)
a<-table.element(a, mysum$fstatistic[3])
a<-table.row.end(a)
a<-table.row.start(a)
a<-table.element(a, 'p-value',1,TRUE)
a<-table.element(a, 1-pf(mysum$fstatistic[1],mysum$fstatistic[2],mysum$fstatistic[3]))
a<-table.row.end(a)
a<-table.row.start(a)
a<-table.element(a, 'Multiple Linear Regression - Residual Statistics', 2, TRUE)
a<-table.row.end(a)
a<-table.row.start(a)
a<-table.element(a, 'Residual Standard Deviation',1,TRUE)
a<-table.element(a, mysum$sigma)
a<-table.row.end(a)
a<-table.row.start(a)
a<-table.element(a, 'Sum Squared Residuals',1,TRUE)
a<-table.element(a, sum(myerror*myerror))
a<-table.row.end(a)
a<-table.end(a)
table.save(a,file='mytable3.tab')
a<-table.start()
a<-table.row.start(a)
a<-table.element(a, 'Multiple Linear Regression - Actuals, Interpolation, and Residuals', 4, TRUE)
a<-table.row.end(a)
a<-table.row.start(a)
a<-table.element(a, 'Time or Index', 1, TRUE)
a<-table.element(a, 'Actuals', 1, TRUE)
a<-table.element(a, 'Interpolation
Forecast', 1, TRUE)
a<-table.element(a, 'Residuals
Prediction Error', 1, TRUE)
a<-table.row.end(a)
for (i in 1:n) {
a<-table.row.start(a)
a<-table.element(a,i, 1, TRUE)
a<-table.element(a,x[i])
a<-table.element(a,x[i]-mysum$resid[i])
a<-table.element(a,mysum$resid[i])
a<-table.row.end(a)
}
a<-table.end(a)
table.save(a,file='mytable4.tab')
if (n > n25) {
a<-table.start()
a<-table.row.start(a)
a<-table.element(a,'Goldfeld-Quandt test for Heteroskedasticity',4,TRUE)
a<-table.row.end(a)
a<-table.row.start(a)
a<-table.element(a,'p-values',header=TRUE)
a<-table.element(a,'Alternative Hypothesis',3,header=TRUE)
a<-table.row.end(a)
a<-table.row.start(a)
a<-table.element(a,'breakpoint index',header=TRUE)
a<-table.element(a,'greater',header=TRUE)
a<-table.element(a,'2-sided',header=TRUE)
a<-table.element(a,'less',header=TRUE)
a<-table.row.end(a)
for (mypoint in kp3:nmkm3) {
a<-table.row.start(a)
a<-table.element(a,mypoint,header=TRUE)
a<-table.element(a,gqarr[mypoint-kp3+1,1])
a<-table.element(a,gqarr[mypoint-kp3+1,2])
a<-table.element(a,gqarr[mypoint-kp3+1,3])
a<-table.row.end(a)
}
a<-table.end(a)
table.save(a,file='mytable5.tab')
a<-table.start()
a<-table.row.start(a)
a<-table.element(a,'Meta Analysis of Goldfeld-Quandt test for Heteroskedasticity',4,TRUE)
a<-table.row.end(a)
a<-table.row.start(a)
a<-table.element(a,'Description',header=TRUE)
a<-table.element(a,'# significant tests',header=TRUE)
a<-table.element(a,'% significant tests',header=TRUE)
a<-table.element(a,'OK/NOK',header=TRUE)
a<-table.row.end(a)
a<-table.row.start(a)
a<-table.element(a,'1% type I error level',header=TRUE)
a<-table.element(a,numsignificant1)
a<-table.element(a,numsignificant1/numgqtests)
if (numsignificant1/numgqtests < 0.01) dum <- 'OK' else dum <- 'NOK'
a<-table.element(a,dum)
a<-table.row.end(a)
a<-table.row.start(a)
a<-table.element(a,'5% type I error level',header=TRUE)
a<-table.element(a,numsignificant5)
a<-table.element(a,numsignificant5/numgqtests)
if (numsignificant5/numgqtests < 0.05) dum <- 'OK' else dum <- 'NOK'
a<-table.element(a,dum)
a<-table.row.end(a)
a<-table.row.start(a)
a<-table.element(a,'10% type I error level',header=TRUE)
a<-table.element(a,numsignificant10)
a<-table.element(a,numsignificant10/numgqtests)
if (numsignificant10/numgqtests < 0.1) dum <- 'OK' else dum <- 'NOK'
a<-table.element(a,dum)
a<-table.row.end(a)
a<-table.end(a)
table.save(a,file='mytable6.tab')
}