Free Statistics

of Irreproducible Research!

Author's title

Author*The author of this computation has been verified*
R Software Modulerwasp_multipleregression.wasp
Title produced by softwareMultiple Regression
Date of computationThu, 26 Nov 2009 11:08:09 -0700
Cite this page as followsStatistical Computations at FreeStatistics.org, Office for Research Development and Education, URL https://freestatistics.org/blog/index.php?v=date/2009/Nov/26/t1259258941g4ra8qmrixahe5s.htm/, Retrieved Sat, 27 Apr 2024 22:57:13 +0000
Statistical Computations at FreeStatistics.org, Office for Research Development and Education, URL https://freestatistics.org/blog/index.php?pk=60214, Retrieved Sat, 27 Apr 2024 22:57:13 +0000
QR Codes:

Original text written by user:
IsPrivate?No (this computation is public)
User-defined keywords
Estimated Impact156
Family? (F = Feedback message, R = changed R code, M = changed R Module, P = changed Parameters, D = changed Data)
-     [Multiple Regression] [Q1 The Seatbeltlaw] [2007-11-14 19:27:43] [8cd6641b921d30ebe00b648d1481bba0]
- RM D  [Multiple Regression] [Seatbelt] [2009-11-12 14:10:54] [b98453cac15ba1066b407e146608df68]
-    D    [Multiple Regression] [WS7_4] [2009-11-18 19:13:17] [8b1aef4e7013bd33fbc2a5833375c5f5]
-           [Multiple Regression] [] [2009-11-19 14:06:12] [08fc5c07292c885b941f0cb515ce13f3]
-    D        [Multiple Regression] [] [2009-11-20 17:36:35] [4d62210f0915d3a20cbf115865da7cd4]
-    D            [Multiple Regression] [verbetering] [2009-11-26 18:08:09] [37de18e38c1490dd77c2b362ed87f3bb] [Current]
Feedback Forum

Post a new message
Dataseries X:
7.6	4634	7.5	7.7	8.1	8
7.8	3996	7.6	7.5	7.7	8.1
7.8	4308	7.8	7.6	7.5	7.7
7.8	4143	7.8	7.8	7.6	7.5
7.5	4429	7.8	7.8	7.8	7.6
7.5	5219	7.5	7.8	7.8	7.8
7.1	4929	7.5	7.5	7.8	7.8
7.5	5755	7.1	7.5	7.5	7.8
7.5	5592	7.5	7.1	7.5	7.5
7.6	4163	7.5	7.5	7.1	7.5
7.7	4962	7.6	7.5	7.5	7.1
7.7	5208	7.7	7.6	7.5	7.5
7.9	4755	7.7	7.7	7.6	7.5
8.1	4491	7.9	7.7	7.7	7.6
8.2	5732	8.1	7.9	7.7	7.7
8.2	5731	8.2	8.1	7.9	7.7
8.2	5040	8.2	8.2	8.1	7.9
7.9	6102	8.2	8.2	8.2	8.1
7.3	4904	7.9	8.2	8.2	8.2
6.9	5369	7.3	7.9	8.2	8.2
6.7	5578	6.9	7.3	7.9	8.2
6.7	4619	6.7	6.9	7.3	7.9
6.9	4731	6.7	6.7	6.9	7.3
7	5011	6.9	6.7	6.7	6.9
7.1	5299	7	6.9	6.7	6.7
7.2	4146	7.1	7	6.9	6.7
7.1	4625	7.2	7.1	7	6.9
6.9	4736	7.1	7.2	7.1	7
7	4219	6.9	7.1	7.2	7.1
6.8	5116	7	6.9	7.1	7.2
6.4	4205	6.8	7	6.9	7.1
6.7	4121	6.4	6.8	7	6.9
6.6	5103	6.7	6.4	6.8	7
6.4	4300	6.6	6.7	6.4	6.8
6.3	4578	6.4	6.6	6.7	6.4
6.2	3809	6.3	6.4	6.6	6.7
6.5	5526	6.2	6.3	6.4	6.6
6.8	4247	6.5	6.2	6.3	6.4
6.8	3830	6.8	6.5	6.2	6.3
6.4	4394	6.8	6.8	6.5	6.2
6.1	4826	6.4	6.8	6.8	6.5
5.8	4409	6.1	6.4	6.8	6.8
6.1	4569	5.8	6.1	6.4	6.8
7.2	4106	6.1	5.8	6.1	6.4
7.3	4794	7.2	6.1	5.8	6.1
6.9	3914	7.3	7.2	6.1	5.8
6.1	3793	6.9	7.3	7.2	6.1
5.8	4405	6.1	6.9	7.3	7.2
6.2	4022	5.8	6.1	6.9	7.3
7.1	4100	6.2	5.8	6.1	6.9
7.7	4788	7.1	6.2	5.8	6.1
7.9	3163	7.7	7.1	6.2	5.8
7.7	3585	7.9	7.7	7.1	6.2
7.4	3903	7.7	7.9	7.7	7.1
7.5	4178	7.4	7.7	7.9	7.7
8	3863	7.5	7.4	7.7	7.9
8.1	4187	8	7.5	7.4	7.7


Summary of computational transaction
Raw Inputview raw input (R code)
Raw Outputview raw output of R engine
Computing time4 seconds
R Server'Gwilym Jenkins' @ 72.249.127.135

\begin{tabular}{lllllllll}
\hline
Summary of computational transaction \tabularnewline
Raw Input & view raw input (R code)  \tabularnewline
Raw Output & view raw output of R engine  \tabularnewline
Computing time & 4 seconds \tabularnewline
R Server & 'Gwilym Jenkins' @ 72.249.127.135 \tabularnewline
\hline
\end{tabular}
%Source: https://freestatistics.org/blog/index.php?pk=60214&T=0

[TABLE]
[ROW][C]Summary of computational transaction[/C][/ROW]
[ROW][C]Raw Input[/C][C]view raw input (R code) [/C][/ROW]
[ROW][C]Raw Output[/C][C]view raw output of R engine [/C][/ROW]
[ROW][C]Computing time[/C][C]4 seconds[/C][/ROW]
[ROW][C]R Server[/C][C]'Gwilym Jenkins' @ 72.249.127.135[/C][/ROW]
[/TABLE]
Source: https://freestatistics.org/blog/index.php?pk=60214&T=0

Globally Unique Identifier (entire table): ba.freestatistics.org/blog/index.php?pk=60214&T=0

As an alternative you can also use a QR Code:  

The GUIDs for individual cells are displayed in the table below:

Summary of computational transaction
Raw Inputview raw input (R code)
Raw Outputview raw output of R engine
Computing time4 seconds
R Server'Gwilym Jenkins' @ 72.249.127.135


Multiple Linear Regression - Estimated Regression Equation
Y[t] = -0.153940288710229 -1.33201916470280e-05X[t] + 1.50648070929122Y1[t] -0.65589035973249Y2[t] -0.318048099574336Y3[t] + 0.479226132320903Y4[t] + 0.261087080885896M1[t] + 0.167093825083992M2[t] -0.0136708658093534M3[t] + 0.0604414740927271M4[t] + 0.119159398487352M5[t] -0.0631487681125825M6[t] -0.114763643209317M7[t] + 0.414158022941514M8[t] -0.309959829379935M9[t] -0.132693479589635M10[t] + 0.116449777839318M11[t] + 0.00303282565484625t + e[t]

\begin{tabular}{lllllllll}
\hline
Multiple Linear Regression - Estimated Regression Equation \tabularnewline
Y[t] =  -0.153940288710229 -1.33201916470280e-05X[t] +  1.50648070929122Y1[t] -0.65589035973249Y2[t] -0.318048099574336Y3[t] +  0.479226132320903Y4[t] +  0.261087080885896M1[t] +  0.167093825083992M2[t] -0.0136708658093534M3[t] +  0.0604414740927271M4[t] +  0.119159398487352M5[t] -0.0631487681125825M6[t] -0.114763643209317M7[t] +  0.414158022941514M8[t] -0.309959829379935M9[t] -0.132693479589635M10[t] +  0.116449777839318M11[t] +  0.00303282565484625t  + e[t] \tabularnewline
\hline
\end{tabular}
%Source: https://freestatistics.org/blog/index.php?pk=60214&T=1

[TABLE]
[ROW][C]Multiple Linear Regression - Estimated Regression Equation[/C][/ROW]
[ROW][C]Y[t] =  -0.153940288710229 -1.33201916470280e-05X[t] +  1.50648070929122Y1[t] -0.65589035973249Y2[t] -0.318048099574336Y3[t] +  0.479226132320903Y4[t] +  0.261087080885896M1[t] +  0.167093825083992M2[t] -0.0136708658093534M3[t] +  0.0604414740927271M4[t] +  0.119159398487352M5[t] -0.0631487681125825M6[t] -0.114763643209317M7[t] +  0.414158022941514M8[t] -0.309959829379935M9[t] -0.132693479589635M10[t] +  0.116449777839318M11[t] +  0.00303282565484625t  + e[t][/C][/ROW]
[/TABLE]
Source: https://freestatistics.org/blog/index.php?pk=60214&T=1

Globally Unique Identifier (entire table): ba.freestatistics.org/blog/index.php?pk=60214&T=1

As an alternative you can also use a QR Code:  

The GUIDs for individual cells are displayed in the table below:

Multiple Linear Regression - Estimated Regression Equation
Y[t] = -0.153940288710229 -1.33201916470280e-05X[t] + 1.50648070929122Y1[t] -0.65589035973249Y2[t] -0.318048099574336Y3[t] + 0.479226132320903Y4[t] + 0.261087080885896M1[t] + 0.167093825083992M2[t] -0.0136708658093534M3[t] + 0.0604414740927271M4[t] + 0.119159398487352M5[t] -0.0631487681125825M6[t] -0.114763643209317M7[t] + 0.414158022941514M8[t] -0.309959829379935M9[t] -0.132693479589635M10[t] + 0.116449777839318M11[t] + 0.00303282565484625t + e[t]


Multiple Linear Regression - Ordinary Least Squares
VariableParameterS.D.T-STATH0: parameter = 02-tail p-value1-tail p-value
(Intercept)-0.1539402887102290.620335-0.24820.8053150.402658
X-1.33201916470280e-056.1e-05-0.21860.8280780.414039
Y11.506480709291220.14402410.459900
Y2-0.655890359732490.271473-2.4160.0204720.010236
Y3-0.3180480995743360.271425-1.17180.2483970.124199
Y40.4792261323209030.152913.1340.0032690.001635
M10.2610870808858960.1394921.87170.0687630.034382
M20.1670938250839920.1483171.12660.2667960.133398
M3-0.01367086580935340.149317-0.09160.9275190.46376
M40.06044147409272710.1478450.40880.684910.342455
M50.1191593984873520.1456010.81840.4181030.209052
M6-0.06314876811258250.144089-0.43830.6636130.331807
M7-0.1147636432093170.141841-0.80910.4233670.211683
M80.4141580229415140.1406062.94550.0054140.002707
M9-0.3099598293799350.162573-1.90660.0639610.03198
M10-0.1326934795896350.174477-0.76050.4515160.225758
M110.1164497778393180.1551650.75050.4574650.228732
t0.003032825654846250.0026011.16610.2506620.125331

\begin{tabular}{lllllllll}
\hline
Multiple Linear Regression - Ordinary Least Squares \tabularnewline
Variable & Parameter & S.D. & T-STATH0: parameter = 0 & 2-tail p-value & 1-tail p-value \tabularnewline
(Intercept) & -0.153940288710229 & 0.620335 & -0.2482 & 0.805315 & 0.402658 \tabularnewline
X & -1.33201916470280e-05 & 6.1e-05 & -0.2186 & 0.828078 & 0.414039 \tabularnewline
Y1 & 1.50648070929122 & 0.144024 & 10.4599 & 0 & 0 \tabularnewline
Y2 & -0.65589035973249 & 0.271473 & -2.416 & 0.020472 & 0.010236 \tabularnewline
Y3 & -0.318048099574336 & 0.271425 & -1.1718 & 0.248397 & 0.124199 \tabularnewline
Y4 & 0.479226132320903 & 0.15291 & 3.134 & 0.003269 & 0.001635 \tabularnewline
M1 & 0.261087080885896 & 0.139492 & 1.8717 & 0.068763 & 0.034382 \tabularnewline
M2 & 0.167093825083992 & 0.148317 & 1.1266 & 0.266796 & 0.133398 \tabularnewline
M3 & -0.0136708658093534 & 0.149317 & -0.0916 & 0.927519 & 0.46376 \tabularnewline
M4 & 0.0604414740927271 & 0.147845 & 0.4088 & 0.68491 & 0.342455 \tabularnewline
M5 & 0.119159398487352 & 0.145601 & 0.8184 & 0.418103 & 0.209052 \tabularnewline
M6 & -0.0631487681125825 & 0.144089 & -0.4383 & 0.663613 & 0.331807 \tabularnewline
M7 & -0.114763643209317 & 0.141841 & -0.8091 & 0.423367 & 0.211683 \tabularnewline
M8 & 0.414158022941514 & 0.140606 & 2.9455 & 0.005414 & 0.002707 \tabularnewline
M9 & -0.309959829379935 & 0.162573 & -1.9066 & 0.063961 & 0.03198 \tabularnewline
M10 & -0.132693479589635 & 0.174477 & -0.7605 & 0.451516 & 0.225758 \tabularnewline
M11 & 0.116449777839318 & 0.155165 & 0.7505 & 0.457465 & 0.228732 \tabularnewline
t & 0.00303282565484625 & 0.002601 & 1.1661 & 0.250662 & 0.125331 \tabularnewline
\hline
\end{tabular}
%Source: https://freestatistics.org/blog/index.php?pk=60214&T=2

[TABLE]
[ROW][C]Multiple Linear Regression - Ordinary Least Squares[/C][/ROW]
[ROW][C]Variable[/C][C]Parameter[/C][C]S.D.[/C][C]T-STATH0: parameter = 0[/C][C]2-tail p-value[/C][C]1-tail p-value[/C][/ROW]
[ROW][C](Intercept)[/C][C]-0.153940288710229[/C][C]0.620335[/C][C]-0.2482[/C][C]0.805315[/C][C]0.402658[/C][/ROW]
[ROW][C]X[/C][C]-1.33201916470280e-05[/C][C]6.1e-05[/C][C]-0.2186[/C][C]0.828078[/C][C]0.414039[/C][/ROW]
[ROW][C]Y1[/C][C]1.50648070929122[/C][C]0.144024[/C][C]10.4599[/C][C]0[/C][C]0[/C][/ROW]
[ROW][C]Y2[/C][C]-0.65589035973249[/C][C]0.271473[/C][C]-2.416[/C][C]0.020472[/C][C]0.010236[/C][/ROW]
[ROW][C]Y3[/C][C]-0.318048099574336[/C][C]0.271425[/C][C]-1.1718[/C][C]0.248397[/C][C]0.124199[/C][/ROW]
[ROW][C]Y4[/C][C]0.479226132320903[/C][C]0.15291[/C][C]3.134[/C][C]0.003269[/C][C]0.001635[/C][/ROW]
[ROW][C]M1[/C][C]0.261087080885896[/C][C]0.139492[/C][C]1.8717[/C][C]0.068763[/C][C]0.034382[/C][/ROW]
[ROW][C]M2[/C][C]0.167093825083992[/C][C]0.148317[/C][C]1.1266[/C][C]0.266796[/C][C]0.133398[/C][/ROW]
[ROW][C]M3[/C][C]-0.0136708658093534[/C][C]0.149317[/C][C]-0.0916[/C][C]0.927519[/C][C]0.46376[/C][/ROW]
[ROW][C]M4[/C][C]0.0604414740927271[/C][C]0.147845[/C][C]0.4088[/C][C]0.68491[/C][C]0.342455[/C][/ROW]
[ROW][C]M5[/C][C]0.119159398487352[/C][C]0.145601[/C][C]0.8184[/C][C]0.418103[/C][C]0.209052[/C][/ROW]
[ROW][C]M6[/C][C]-0.0631487681125825[/C][C]0.144089[/C][C]-0.4383[/C][C]0.663613[/C][C]0.331807[/C][/ROW]
[ROW][C]M7[/C][C]-0.114763643209317[/C][C]0.141841[/C][C]-0.8091[/C][C]0.423367[/C][C]0.211683[/C][/ROW]
[ROW][C]M8[/C][C]0.414158022941514[/C][C]0.140606[/C][C]2.9455[/C][C]0.005414[/C][C]0.002707[/C][/ROW]
[ROW][C]M9[/C][C]-0.309959829379935[/C][C]0.162573[/C][C]-1.9066[/C][C]0.063961[/C][C]0.03198[/C][/ROW]
[ROW][C]M10[/C][C]-0.132693479589635[/C][C]0.174477[/C][C]-0.7605[/C][C]0.451516[/C][C]0.225758[/C][/ROW]
[ROW][C]M11[/C][C]0.116449777839318[/C][C]0.155165[/C][C]0.7505[/C][C]0.457465[/C][C]0.228732[/C][/ROW]
[ROW][C]t[/C][C]0.00303282565484625[/C][C]0.002601[/C][C]1.1661[/C][C]0.250662[/C][C]0.125331[/C][/ROW]
[/TABLE]
Source: https://freestatistics.org/blog/index.php?pk=60214&T=2

Globally Unique Identifier (entire table): ba.freestatistics.org/blog/index.php?pk=60214&T=2

As an alternative you can also use a QR Code:  

The GUIDs for individual cells are displayed in the table below:

Multiple Linear Regression - Ordinary Least Squares
VariableParameterS.D.T-STATH0: parameter = 02-tail p-value1-tail p-value
(Intercept)-0.1539402887102290.620335-0.24820.8053150.402658
X-1.33201916470280e-056.1e-05-0.21860.8280780.414039
Y11.506480709291220.14402410.459900
Y2-0.655890359732490.271473-2.4160.0204720.010236
Y3-0.3180480995743360.271425-1.17180.2483970.124199
Y40.4792261323209030.152913.1340.0032690.001635
M10.2610870808858960.1394921.87170.0687630.034382
M20.1670938250839920.1483171.12660.2667960.133398
M3-0.01367086580935340.149317-0.09160.9275190.46376
M40.06044147409272710.1478450.40880.684910.342455
M50.1191593984873520.1456010.81840.4181030.209052
M6-0.06314876811258250.144089-0.43830.6636130.331807
M7-0.1147636432093170.141841-0.80910.4233670.211683
M80.4141580229415140.1406062.94550.0054140.002707
M9-0.3099598293799350.162573-1.90660.0639610.03198
M10-0.1326934795896350.174477-0.76050.4515160.225758
M110.1164497778393180.1551650.75050.4574650.228732
t0.003032825654846250.0026011.16610.2506620.125331


Multiple Linear Regression - Regression Statistics
Multiple R0.965407731466025
R-squared0.932012087974376
Adjusted R-squared0.902376331450387
F-TEST (value)31.4489048801546
F-TEST (DF numerator)17
F-TEST (DF denominator)39
p-value0
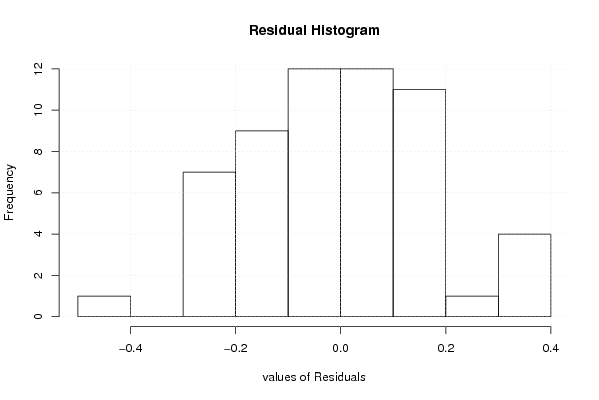
Multiple Linear Regression - Residual Statistics
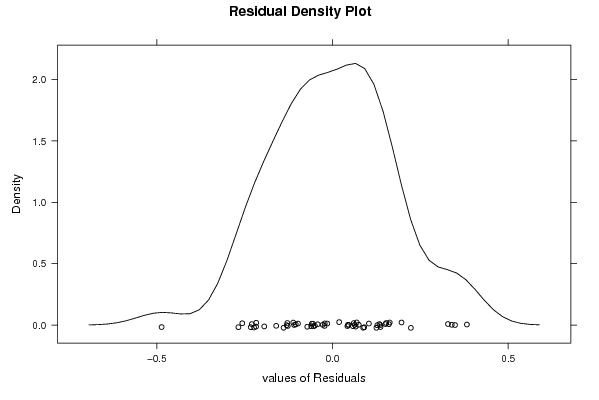
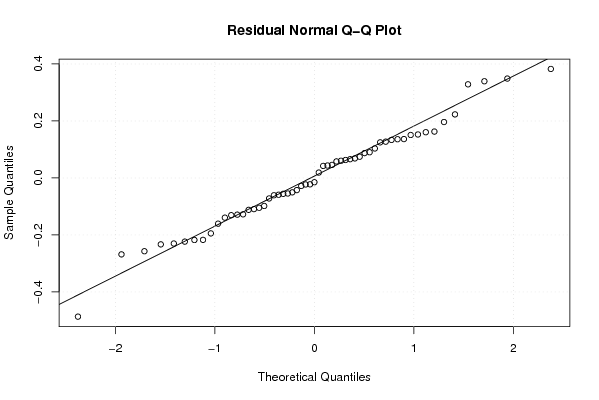
Residual Standard Deviation0.205821064783154
Sum Squared Residuals1.65213011763038

\begin{tabular}{lllllllll}
\hline
Multiple Linear Regression - Regression Statistics \tabularnewline
Multiple R & 0.965407731466025 \tabularnewline
R-squared & 0.932012087974376 \tabularnewline
Adjusted R-squared & 0.902376331450387 \tabularnewline
F-TEST (value) & 31.4489048801546 \tabularnewline
F-TEST (DF numerator) & 17 \tabularnewline
F-TEST (DF denominator) & 39 \tabularnewline
p-value & 0 \tabularnewline
Multiple Linear Regression - Residual Statistics \tabularnewline
Residual Standard Deviation & 0.205821064783154 \tabularnewline
Sum Squared Residuals & 1.65213011763038 \tabularnewline
\hline
\end{tabular}
%Source: https://freestatistics.org/blog/index.php?pk=60214&T=3

[TABLE]
[ROW][C]Multiple Linear Regression - Regression Statistics[/C][/ROW]
[ROW][C]Multiple R[/C][C]0.965407731466025[/C][/ROW]
[ROW][C]R-squared[/C][C]0.932012087974376[/C][/ROW]
[ROW][C]Adjusted R-squared[/C][C]0.902376331450387[/C][/ROW]
[ROW][C]F-TEST (value)[/C][C]31.4489048801546[/C][/ROW]
[ROW][C]F-TEST (DF numerator)[/C][C]17[/C][/ROW]
[ROW][C]F-TEST (DF denominator)[/C][C]39[/C][/ROW]
[ROW][C]p-value[/C][C]0[/C][/ROW]
[ROW][C]Multiple Linear Regression - Residual Statistics[/C][/ROW]
[ROW][C]Residual Standard Deviation[/C][C]0.205821064783154[/C][/ROW]
[ROW][C]Sum Squared Residuals[/C][C]1.65213011763038[/C][/ROW]
[/TABLE]
Source: https://freestatistics.org/blog/index.php?pk=60214&T=3

Globally Unique Identifier (entire table): ba.freestatistics.org/blog/index.php?pk=60214&T=3

As an alternative you can also use a QR Code:  

The GUIDs for individual cells are displayed in the table below:

Multiple Linear Regression - Regression Statistics
Multiple R0.965407731466025
R-squared0.932012087974376
Adjusted R-squared0.902376331450387
F-TEST (value)31.4489048801546
F-TEST (DF numerator)17
F-TEST (DF denominator)39
p-value0
Multiple Linear Regression - Residual Statistics
Residual Standard Deviation0.205821064783154
Sum Squared Residuals1.65213011763038


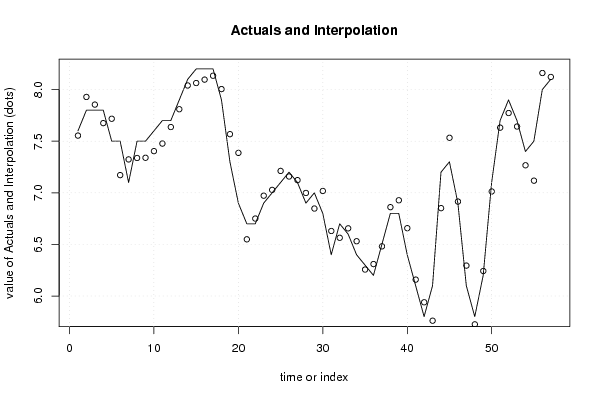
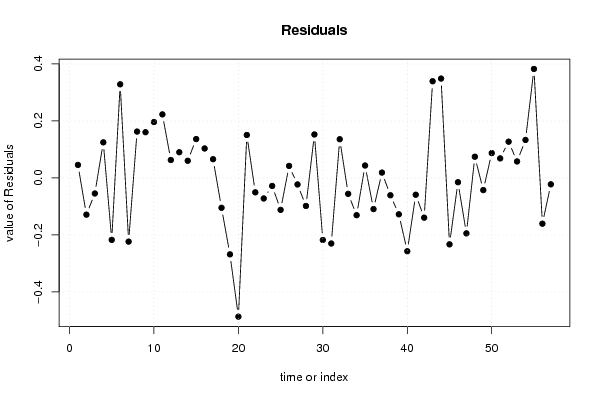
Multiple Linear Regression - Actuals, Interpolation, and Residuals
Time or IndexActualsInterpolationForecastResidualsPrediction Error
17.67.554322851497290.0456771485027087
27.87.92882869955848-0.128828699558484
37.87.85456720739761-0.0545672073976106
47.87.675082096208190.124917903791812
57.57.71733626476383-0.217336264763833
67.57.17143898609440.328561013905595
77.17.3234869001499-0.223486900149903
87.57.337261059810950.162738940189054
97.57.339527812296020.160472187703976
107.67.403724637541510.196275362458489
117.77.476996265670360.223003734329639
127.77.637052034224960.0629479657750442
137.97.809812141651120.0901878583488803
148.18.039782187231780.0602178127682218
158.28.063560647303150.136439352696846
168.28.096579512119480.103420487880515
178.28.134181085173120.0658189148268819
187.98.00480011720563-0.104800117205631
197.37.5681540578016-0.268154057801608
206.97.38679334283643-0.486793342836429
216.76.54928075811090.150719241889097
226.76.75047501942863-0.0504750194286303
236.96.97202087343165-0.0720208734316533
2477.02808957643076-0.0280895764307648
257.17.2119980402956-0.111998040295607
267.27.157845206158580.0421547938414226
277.17.12283242058377-0.0228324205837740
286.96.99837974124016-0.098379741240164
2976.847427727760810.152572272239188
306.87.01775774097348-0.217757740973483
316.46.63011221497332-0.230112214973319
326.76.564121354685740.135878645314257
336.66.65578848964908-0.0557884896490787
346.46.53074261350347-0.130742613503471
356.36.256403694623740.0435963053762581
366.26.30933262048691-0.109332620486913
376.56.481209729696610.0187902703033876
386.86.86077865691997-0.0607786569199721
396.86.92766061319125-0.127660613191246
406.46.65718903963511-0.257189039635111
416.16.15894659300055-0.0589465930005492
425.85.93940554277417-0.139405542774169
436.15.760734397630870.339265602369128
447.26.851291435820180.348708564179824
457.37.53305037977705-0.233050379777047
466.96.91505772952639-0.0150577295263880
476.16.29457916627424-0.194579166274244
485.85.725525768857370.0744742311426342
496.26.24265723685937-0.0426572368593701
507.17.012765250131190.0872347498688113
517.77.631379111524220.0686208884757846
527.97.772769610797050.127230389202949
537.77.642108329301690.0578916706983125
547.47.266597612952310.133402387047689
557.57.11751242944430.382487570555702
5688.1605328068467-0.160532806846705
578.18.12235256016695-0.0223525601669478

\begin{tabular}{lllllllll}
\hline
Multiple Linear Regression - Actuals, Interpolation, and Residuals \tabularnewline
Time or Index & Actuals & InterpolationForecast & ResidualsPrediction Error \tabularnewline
1 & 7.6 & 7.55432285149729 & 0.0456771485027087 \tabularnewline
2 & 7.8 & 7.92882869955848 & -0.128828699558484 \tabularnewline
3 & 7.8 & 7.85456720739761 & -0.0545672073976106 \tabularnewline
4 & 7.8 & 7.67508209620819 & 0.124917903791812 \tabularnewline
5 & 7.5 & 7.71733626476383 & -0.217336264763833 \tabularnewline
6 & 7.5 & 7.1714389860944 & 0.328561013905595 \tabularnewline
7 & 7.1 & 7.3234869001499 & -0.223486900149903 \tabularnewline
8 & 7.5 & 7.33726105981095 & 0.162738940189054 \tabularnewline
9 & 7.5 & 7.33952781229602 & 0.160472187703976 \tabularnewline
10 & 7.6 & 7.40372463754151 & 0.196275362458489 \tabularnewline
11 & 7.7 & 7.47699626567036 & 0.223003734329639 \tabularnewline
12 & 7.7 & 7.63705203422496 & 0.0629479657750442 \tabularnewline
13 & 7.9 & 7.80981214165112 & 0.0901878583488803 \tabularnewline
14 & 8.1 & 8.03978218723178 & 0.0602178127682218 \tabularnewline
15 & 8.2 & 8.06356064730315 & 0.136439352696846 \tabularnewline
16 & 8.2 & 8.09657951211948 & 0.103420487880515 \tabularnewline
17 & 8.2 & 8.13418108517312 & 0.0658189148268819 \tabularnewline
18 & 7.9 & 8.00480011720563 & -0.104800117205631 \tabularnewline
19 & 7.3 & 7.5681540578016 & -0.268154057801608 \tabularnewline
20 & 6.9 & 7.38679334283643 & -0.486793342836429 \tabularnewline
21 & 6.7 & 6.5492807581109 & 0.150719241889097 \tabularnewline
22 & 6.7 & 6.75047501942863 & -0.0504750194286303 \tabularnewline
23 & 6.9 & 6.97202087343165 & -0.0720208734316533 \tabularnewline
24 & 7 & 7.02808957643076 & -0.0280895764307648 \tabularnewline
25 & 7.1 & 7.2119980402956 & -0.111998040295607 \tabularnewline
26 & 7.2 & 7.15784520615858 & 0.0421547938414226 \tabularnewline
27 & 7.1 & 7.12283242058377 & -0.0228324205837740 \tabularnewline
28 & 6.9 & 6.99837974124016 & -0.098379741240164 \tabularnewline
29 & 7 & 6.84742772776081 & 0.152572272239188 \tabularnewline
30 & 6.8 & 7.01775774097348 & -0.217757740973483 \tabularnewline
31 & 6.4 & 6.63011221497332 & -0.230112214973319 \tabularnewline
32 & 6.7 & 6.56412135468574 & 0.135878645314257 \tabularnewline
33 & 6.6 & 6.65578848964908 & -0.0557884896490787 \tabularnewline
34 & 6.4 & 6.53074261350347 & -0.130742613503471 \tabularnewline
35 & 6.3 & 6.25640369462374 & 0.0435963053762581 \tabularnewline
36 & 6.2 & 6.30933262048691 & -0.109332620486913 \tabularnewline
37 & 6.5 & 6.48120972969661 & 0.0187902703033876 \tabularnewline
38 & 6.8 & 6.86077865691997 & -0.0607786569199721 \tabularnewline
39 & 6.8 & 6.92766061319125 & -0.127660613191246 \tabularnewline
40 & 6.4 & 6.65718903963511 & -0.257189039635111 \tabularnewline
41 & 6.1 & 6.15894659300055 & -0.0589465930005492 \tabularnewline
42 & 5.8 & 5.93940554277417 & -0.139405542774169 \tabularnewline
43 & 6.1 & 5.76073439763087 & 0.339265602369128 \tabularnewline
44 & 7.2 & 6.85129143582018 & 0.348708564179824 \tabularnewline
45 & 7.3 & 7.53305037977705 & -0.233050379777047 \tabularnewline
46 & 6.9 & 6.91505772952639 & -0.0150577295263880 \tabularnewline
47 & 6.1 & 6.29457916627424 & -0.194579166274244 \tabularnewline
48 & 5.8 & 5.72552576885737 & 0.0744742311426342 \tabularnewline
49 & 6.2 & 6.24265723685937 & -0.0426572368593701 \tabularnewline
50 & 7.1 & 7.01276525013119 & 0.0872347498688113 \tabularnewline
51 & 7.7 & 7.63137911152422 & 0.0686208884757846 \tabularnewline
52 & 7.9 & 7.77276961079705 & 0.127230389202949 \tabularnewline
53 & 7.7 & 7.64210832930169 & 0.0578916706983125 \tabularnewline
54 & 7.4 & 7.26659761295231 & 0.133402387047689 \tabularnewline
55 & 7.5 & 7.1175124294443 & 0.382487570555702 \tabularnewline
56 & 8 & 8.1605328068467 & -0.160532806846705 \tabularnewline
57 & 8.1 & 8.12235256016695 & -0.0223525601669478 \tabularnewline
\hline
\end{tabular}
%Source: https://freestatistics.org/blog/index.php?pk=60214&T=4

[TABLE]
[ROW][C]Multiple Linear Regression - Actuals, Interpolation, and Residuals[/C][/ROW]
[ROW][C]Time or Index[/C][C]Actuals[/C][C]InterpolationForecast[/C][C]ResidualsPrediction Error[/C][/ROW]
[ROW][C]1[/C][C]7.6[/C][C]7.55432285149729[/C][C]0.0456771485027087[/C][/ROW]
[ROW][C]2[/C][C]7.8[/C][C]7.92882869955848[/C][C]-0.128828699558484[/C][/ROW]
[ROW][C]3[/C][C]7.8[/C][C]7.85456720739761[/C][C]-0.0545672073976106[/C][/ROW]
[ROW][C]4[/C][C]7.8[/C][C]7.67508209620819[/C][C]0.124917903791812[/C][/ROW]
[ROW][C]5[/C][C]7.5[/C][C]7.71733626476383[/C][C]-0.217336264763833[/C][/ROW]
[ROW][C]6[/C][C]7.5[/C][C]7.1714389860944[/C][C]0.328561013905595[/C][/ROW]
[ROW][C]7[/C][C]7.1[/C][C]7.3234869001499[/C][C]-0.223486900149903[/C][/ROW]
[ROW][C]8[/C][C]7.5[/C][C]7.33726105981095[/C][C]0.162738940189054[/C][/ROW]
[ROW][C]9[/C][C]7.5[/C][C]7.33952781229602[/C][C]0.160472187703976[/C][/ROW]
[ROW][C]10[/C][C]7.6[/C][C]7.40372463754151[/C][C]0.196275362458489[/C][/ROW]
[ROW][C]11[/C][C]7.7[/C][C]7.47699626567036[/C][C]0.223003734329639[/C][/ROW]
[ROW][C]12[/C][C]7.7[/C][C]7.63705203422496[/C][C]0.0629479657750442[/C][/ROW]
[ROW][C]13[/C][C]7.9[/C][C]7.80981214165112[/C][C]0.0901878583488803[/C][/ROW]
[ROW][C]14[/C][C]8.1[/C][C]8.03978218723178[/C][C]0.0602178127682218[/C][/ROW]
[ROW][C]15[/C][C]8.2[/C][C]8.06356064730315[/C][C]0.136439352696846[/C][/ROW]
[ROW][C]16[/C][C]8.2[/C][C]8.09657951211948[/C][C]0.103420487880515[/C][/ROW]
[ROW][C]17[/C][C]8.2[/C][C]8.13418108517312[/C][C]0.0658189148268819[/C][/ROW]
[ROW][C]18[/C][C]7.9[/C][C]8.00480011720563[/C][C]-0.104800117205631[/C][/ROW]
[ROW][C]19[/C][C]7.3[/C][C]7.5681540578016[/C][C]-0.268154057801608[/C][/ROW]
[ROW][C]20[/C][C]6.9[/C][C]7.38679334283643[/C][C]-0.486793342836429[/C][/ROW]
[ROW][C]21[/C][C]6.7[/C][C]6.5492807581109[/C][C]0.150719241889097[/C][/ROW]
[ROW][C]22[/C][C]6.7[/C][C]6.75047501942863[/C][C]-0.0504750194286303[/C][/ROW]
[ROW][C]23[/C][C]6.9[/C][C]6.97202087343165[/C][C]-0.0720208734316533[/C][/ROW]
[ROW][C]24[/C][C]7[/C][C]7.02808957643076[/C][C]-0.0280895764307648[/C][/ROW]
[ROW][C]25[/C][C]7.1[/C][C]7.2119980402956[/C][C]-0.111998040295607[/C][/ROW]
[ROW][C]26[/C][C]7.2[/C][C]7.15784520615858[/C][C]0.0421547938414226[/C][/ROW]
[ROW][C]27[/C][C]7.1[/C][C]7.12283242058377[/C][C]-0.0228324205837740[/C][/ROW]
[ROW][C]28[/C][C]6.9[/C][C]6.99837974124016[/C][C]-0.098379741240164[/C][/ROW]
[ROW][C]29[/C][C]7[/C][C]6.84742772776081[/C][C]0.152572272239188[/C][/ROW]
[ROW][C]30[/C][C]6.8[/C][C]7.01775774097348[/C][C]-0.217757740973483[/C][/ROW]
[ROW][C]31[/C][C]6.4[/C][C]6.63011221497332[/C][C]-0.230112214973319[/C][/ROW]
[ROW][C]32[/C][C]6.7[/C][C]6.56412135468574[/C][C]0.135878645314257[/C][/ROW]
[ROW][C]33[/C][C]6.6[/C][C]6.65578848964908[/C][C]-0.0557884896490787[/C][/ROW]
[ROW][C]34[/C][C]6.4[/C][C]6.53074261350347[/C][C]-0.130742613503471[/C][/ROW]
[ROW][C]35[/C][C]6.3[/C][C]6.25640369462374[/C][C]0.0435963053762581[/C][/ROW]
[ROW][C]36[/C][C]6.2[/C][C]6.30933262048691[/C][C]-0.109332620486913[/C][/ROW]
[ROW][C]37[/C][C]6.5[/C][C]6.48120972969661[/C][C]0.0187902703033876[/C][/ROW]
[ROW][C]38[/C][C]6.8[/C][C]6.86077865691997[/C][C]-0.0607786569199721[/C][/ROW]
[ROW][C]39[/C][C]6.8[/C][C]6.92766061319125[/C][C]-0.127660613191246[/C][/ROW]
[ROW][C]40[/C][C]6.4[/C][C]6.65718903963511[/C][C]-0.257189039635111[/C][/ROW]
[ROW][C]41[/C][C]6.1[/C][C]6.15894659300055[/C][C]-0.0589465930005492[/C][/ROW]
[ROW][C]42[/C][C]5.8[/C][C]5.93940554277417[/C][C]-0.139405542774169[/C][/ROW]
[ROW][C]43[/C][C]6.1[/C][C]5.76073439763087[/C][C]0.339265602369128[/C][/ROW]
[ROW][C]44[/C][C]7.2[/C][C]6.85129143582018[/C][C]0.348708564179824[/C][/ROW]
[ROW][C]45[/C][C]7.3[/C][C]7.53305037977705[/C][C]-0.233050379777047[/C][/ROW]
[ROW][C]46[/C][C]6.9[/C][C]6.91505772952639[/C][C]-0.0150577295263880[/C][/ROW]
[ROW][C]47[/C][C]6.1[/C][C]6.29457916627424[/C][C]-0.194579166274244[/C][/ROW]
[ROW][C]48[/C][C]5.8[/C][C]5.72552576885737[/C][C]0.0744742311426342[/C][/ROW]
[ROW][C]49[/C][C]6.2[/C][C]6.24265723685937[/C][C]-0.0426572368593701[/C][/ROW]
[ROW][C]50[/C][C]7.1[/C][C]7.01276525013119[/C][C]0.0872347498688113[/C][/ROW]
[ROW][C]51[/C][C]7.7[/C][C]7.63137911152422[/C][C]0.0686208884757846[/C][/ROW]
[ROW][C]52[/C][C]7.9[/C][C]7.77276961079705[/C][C]0.127230389202949[/C][/ROW]
[ROW][C]53[/C][C]7.7[/C][C]7.64210832930169[/C][C]0.0578916706983125[/C][/ROW]
[ROW][C]54[/C][C]7.4[/C][C]7.26659761295231[/C][C]0.133402387047689[/C][/ROW]
[ROW][C]55[/C][C]7.5[/C][C]7.1175124294443[/C][C]0.382487570555702[/C][/ROW]
[ROW][C]56[/C][C]8[/C][C]8.1605328068467[/C][C]-0.160532806846705[/C][/ROW]
[ROW][C]57[/C][C]8.1[/C][C]8.12235256016695[/C][C]-0.0223525601669478[/C][/ROW]
[/TABLE]
Source: https://freestatistics.org/blog/index.php?pk=60214&T=4

Globally Unique Identifier (entire table): ba.freestatistics.org/blog/index.php?pk=60214&T=4

As an alternative you can also use a QR Code:  

The GUIDs for individual cells are displayed in the table below:

Multiple Linear Regression - Actuals, Interpolation, and Residuals
Time or IndexActualsInterpolationForecastResidualsPrediction Error
17.67.554322851497290.0456771485027087
27.87.92882869955848-0.128828699558484
37.87.85456720739761-0.0545672073976106
47.87.675082096208190.124917903791812
57.57.71733626476383-0.217336264763833
67.57.17143898609440.328561013905595
77.17.3234869001499-0.223486900149903
87.57.337261059810950.162738940189054
97.57.339527812296020.160472187703976
107.67.403724637541510.196275362458489
117.77.476996265670360.223003734329639
127.77.637052034224960.0629479657750442
137.97.809812141651120.0901878583488803
148.18.039782187231780.0602178127682218
158.28.063560647303150.136439352696846
168.28.096579512119480.103420487880515
178.28.134181085173120.0658189148268819
187.98.00480011720563-0.104800117205631
197.37.5681540578016-0.268154057801608
206.97.38679334283643-0.486793342836429
216.76.54928075811090.150719241889097
226.76.75047501942863-0.0504750194286303
236.96.97202087343165-0.0720208734316533
2477.02808957643076-0.0280895764307648
257.17.2119980402956-0.111998040295607
267.27.157845206158580.0421547938414226
277.17.12283242058377-0.0228324205837740
286.96.99837974124016-0.098379741240164
2976.847427727760810.152572272239188
306.87.01775774097348-0.217757740973483
316.46.63011221497332-0.230112214973319
326.76.564121354685740.135878645314257
336.66.65578848964908-0.0557884896490787
346.46.53074261350347-0.130742613503471
356.36.256403694623740.0435963053762581
366.26.30933262048691-0.109332620486913
376.56.481209729696610.0187902703033876
386.86.86077865691997-0.0607786569199721
396.86.92766061319125-0.127660613191246
406.46.65718903963511-0.257189039635111
416.16.15894659300055-0.0589465930005492
425.85.93940554277417-0.139405542774169
436.15.760734397630870.339265602369128
447.26.851291435820180.348708564179824
457.37.53305037977705-0.233050379777047
466.96.91505772952639-0.0150577295263880
476.16.29457916627424-0.194579166274244
485.85.725525768857370.0744742311426342
496.26.24265723685937-0.0426572368593701
507.17.012765250131190.0872347498688113
517.77.631379111524220.0686208884757846
527.97.772769610797050.127230389202949
537.77.642108329301690.0578916706983125
547.47.266597612952310.133402387047689
557.57.11751242944430.382487570555702
5688.1605328068467-0.160532806846705
578.18.12235256016695-0.0223525601669478


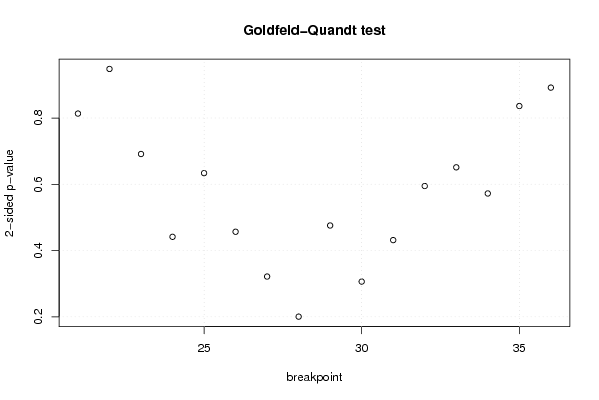
Goldfeld-Quandt test for Heteroskedasticity
p-valuesAlternative Hypothesis
breakpoint indexgreater2-sidedless
210.5932757152079070.8134485695841860.406724284792093
220.4740802378157030.9481604756314060.525919762184297
230.3457231874064010.6914463748128030.654276812593598
240.2207637495758150.4415274991516310.779236250424185
250.3168819345053490.6337638690106980.683118065494651
260.2283998219035820.4567996438071640.771600178096418
270.1607878948535120.3215757897070230.839212105146488
280.1002695393880750.2005390787761490.899730460611925
290.2378196495248320.4756392990496630.762180350475168
300.1531860974287480.3063721948574960.846813902571252
310.2157919064125960.4315838128251920.784208093587404
320.2973717639215590.5947435278431190.70262823607844
330.3256202826934810.6512405653869620.674379717306519
340.2861592629275610.5723185258551220.713840737072439
350.4180920486618770.8361840973237550.581907951338122
360.5540932988808080.8918134022383830.445906701119192

\begin{tabular}{lllllllll}
\hline
Goldfeld-Quandt test for Heteroskedasticity \tabularnewline
p-values & Alternative Hypothesis \tabularnewline
breakpoint index & greater & 2-sided & less \tabularnewline
21 & 0.593275715207907 & 0.813448569584186 & 0.406724284792093 \tabularnewline
22 & 0.474080237815703 & 0.948160475631406 & 0.525919762184297 \tabularnewline
23 & 0.345723187406401 & 0.691446374812803 & 0.654276812593598 \tabularnewline
24 & 0.220763749575815 & 0.441527499151631 & 0.779236250424185 \tabularnewline
25 & 0.316881934505349 & 0.633763869010698 & 0.683118065494651 \tabularnewline
26 & 0.228399821903582 & 0.456799643807164 & 0.771600178096418 \tabularnewline
27 & 0.160787894853512 & 0.321575789707023 & 0.839212105146488 \tabularnewline
28 & 0.100269539388075 & 0.200539078776149 & 0.899730460611925 \tabularnewline
29 & 0.237819649524832 & 0.475639299049663 & 0.762180350475168 \tabularnewline
30 & 0.153186097428748 & 0.306372194857496 & 0.846813902571252 \tabularnewline
31 & 0.215791906412596 & 0.431583812825192 & 0.784208093587404 \tabularnewline
32 & 0.297371763921559 & 0.594743527843119 & 0.70262823607844 \tabularnewline
33 & 0.325620282693481 & 0.651240565386962 & 0.674379717306519 \tabularnewline
34 & 0.286159262927561 & 0.572318525855122 & 0.713840737072439 \tabularnewline
35 & 0.418092048661877 & 0.836184097323755 & 0.581907951338122 \tabularnewline
36 & 0.554093298880808 & 0.891813402238383 & 0.445906701119192 \tabularnewline
\hline
\end{tabular}
%Source: https://freestatistics.org/blog/index.php?pk=60214&T=5

[TABLE]
[ROW][C]Goldfeld-Quandt test for Heteroskedasticity[/C][/ROW]
[ROW][C]p-values[/C][C]Alternative Hypothesis[/C][/ROW]
[ROW][C]breakpoint index[/C][C]greater[/C][C]2-sided[/C][C]less[/C][/ROW]
[ROW][C]21[/C][C]0.593275715207907[/C][C]0.813448569584186[/C][C]0.406724284792093[/C][/ROW]
[ROW][C]22[/C][C]0.474080237815703[/C][C]0.948160475631406[/C][C]0.525919762184297[/C][/ROW]
[ROW][C]23[/C][C]0.345723187406401[/C][C]0.691446374812803[/C][C]0.654276812593598[/C][/ROW]
[ROW][C]24[/C][C]0.220763749575815[/C][C]0.441527499151631[/C][C]0.779236250424185[/C][/ROW]
[ROW][C]25[/C][C]0.316881934505349[/C][C]0.633763869010698[/C][C]0.683118065494651[/C][/ROW]
[ROW][C]26[/C][C]0.228399821903582[/C][C]0.456799643807164[/C][C]0.771600178096418[/C][/ROW]
[ROW][C]27[/C][C]0.160787894853512[/C][C]0.321575789707023[/C][C]0.839212105146488[/C][/ROW]
[ROW][C]28[/C][C]0.100269539388075[/C][C]0.200539078776149[/C][C]0.899730460611925[/C][/ROW]
[ROW][C]29[/C][C]0.237819649524832[/C][C]0.475639299049663[/C][C]0.762180350475168[/C][/ROW]
[ROW][C]30[/C][C]0.153186097428748[/C][C]0.306372194857496[/C][C]0.846813902571252[/C][/ROW]
[ROW][C]31[/C][C]0.215791906412596[/C][C]0.431583812825192[/C][C]0.784208093587404[/C][/ROW]
[ROW][C]32[/C][C]0.297371763921559[/C][C]0.594743527843119[/C][C]0.70262823607844[/C][/ROW]
[ROW][C]33[/C][C]0.325620282693481[/C][C]0.651240565386962[/C][C]0.674379717306519[/C][/ROW]
[ROW][C]34[/C][C]0.286159262927561[/C][C]0.572318525855122[/C][C]0.713840737072439[/C][/ROW]
[ROW][C]35[/C][C]0.418092048661877[/C][C]0.836184097323755[/C][C]0.581907951338122[/C][/ROW]
[ROW][C]36[/C][C]0.554093298880808[/C][C]0.891813402238383[/C][C]0.445906701119192[/C][/ROW]
[/TABLE]
Source: https://freestatistics.org/blog/index.php?pk=60214&T=5

Globally Unique Identifier (entire table): ba.freestatistics.org/blog/index.php?pk=60214&T=5

As an alternative you can also use a QR Code:  

The GUIDs for individual cells are displayed in the table below:

Goldfeld-Quandt test for Heteroskedasticity
p-valuesAlternative Hypothesis
breakpoint indexgreater2-sidedless
210.5932757152079070.8134485695841860.406724284792093
220.4740802378157030.9481604756314060.525919762184297
230.3457231874064010.6914463748128030.654276812593598
240.2207637495758150.4415274991516310.779236250424185
250.3168819345053490.6337638690106980.683118065494651
260.2283998219035820.4567996438071640.771600178096418
270.1607878948535120.3215757897070230.839212105146488
280.1002695393880750.2005390787761490.899730460611925
290.2378196495248320.4756392990496630.762180350475168
300.1531860974287480.3063721948574960.846813902571252
310.2157919064125960.4315838128251920.784208093587404
320.2973717639215590.5947435278431190.70262823607844
330.3256202826934810.6512405653869620.674379717306519
340.2861592629275610.5723185258551220.713840737072439
350.4180920486618770.8361840973237550.581907951338122
360.5540932988808080.8918134022383830.445906701119192


Meta Analysis of Goldfeld-Quandt test for Heteroskedasticity
Description# significant tests% significant testsOK/NOK
1% type I error level00OK
5% type I error level00OK
10% type I error level00OK

\begin{tabular}{lllllllll}
\hline
Meta Analysis of Goldfeld-Quandt test for Heteroskedasticity \tabularnewline
Description & # significant tests & % significant tests & OK/NOK \tabularnewline
1% type I error level & 0 & 0 & OK \tabularnewline
5% type I error level & 0 & 0 & OK \tabularnewline
10% type I error level & 0 & 0 & OK \tabularnewline
\hline
\end{tabular}
%Source: https://freestatistics.org/blog/index.php?pk=60214&T=6

[TABLE]
[ROW][C]Meta Analysis of Goldfeld-Quandt test for Heteroskedasticity[/C][/ROW]
[ROW][C]Description[/C][C]# significant tests[/C][C]% significant tests[/C][C]OK/NOK[/C][/ROW]
[ROW][C]1% type I error level[/C][C]0[/C][C]0[/C][C]OK[/C][/ROW]
[ROW][C]5% type I error level[/C][C]0[/C][C]0[/C][C]OK[/C][/ROW]
[ROW][C]10% type I error level[/C][C]0[/C][C]0[/C][C]OK[/C][/ROW]
[/TABLE]
Source: https://freestatistics.org/blog/index.php?pk=60214&T=6

Globally Unique Identifier (entire table): ba.freestatistics.org/blog/index.php?pk=60214&T=6

As an alternative you can also use a QR Code:  

The GUIDs for individual cells are displayed in the table below:

Meta Analysis of Goldfeld-Quandt test for Heteroskedasticity
Description# significant tests% significant testsOK/NOK
1% type I error level00OK
5% type I error level00OK
10% type I error level00OK


Parameters (Session):
par1 = 1 ; par2 = Include Monthly Dummies ; par3 = Linear Trend ;
Parameters (R input):
par1 = 1 ; par2 = Include Monthly Dummies ; par3 = Linear Trend ;
R code (references can be found in the software module):
library(lattice)
library(lmtest)
n25 <- 25 #minimum number of obs. for Goldfeld-Quandt test
par1 <- as.numeric(par1)
x <- t(y)
k <- length(x[1,])
n <- length(x[,1])
x1 <- cbind(x[,par1], x[,1:k!=par1])
mycolnames <- c(colnames(x)[par1], colnames(x)[1:k!=par1])
colnames(x1) <- mycolnames #colnames(x)[par1]
x <- x1
if (par3 == 'First Differences'){
x2 <- array(0, dim=c(n-1,k), dimnames=list(1:(n-1), paste('(1-B)',colnames(x),sep='')))
for (i in 1:n-1) {
for (j in 1:k) {
x2[i,j] <- x[i+1,j] - x[i,j]
}
}
x <- x2
}
if (par2 == 'Include Monthly Dummies'){
x2 <- array(0, dim=c(n,11), dimnames=list(1:n, paste('M', seq(1:11), sep ='')))
for (i in 1:11){
x2[seq(i,n,12),i] <- 1
}
x <- cbind(x, x2)
}
if (par2 == 'Include Quarterly Dummies'){
x2 <- array(0, dim=c(n,3), dimnames=list(1:n, paste('Q', seq(1:3), sep ='')))
for (i in 1:3){
x2[seq(i,n,4),i] <- 1
}
x <- cbind(x, x2)
}
k <- length(x[1,])
if (par3 == 'Linear Trend'){
x <- cbind(x, c(1:n))
colnames(x)[k+1] <- 't'
}
x
k <- length(x[1,])
df <- as.data.frame(x)
(mylm <- lm(df))
(mysum <- summary(mylm))
if (n > n25) {
kp3 <- k + 3
nmkm3 <- n - k - 3
gqarr <- array(NA, dim=c(nmkm3-kp3+1,3))
numgqtests <- 0
numsignificant1 <- 0
numsignificant5 <- 0
numsignificant10 <- 0
for (mypoint in kp3:nmkm3) {
j <- 0
numgqtests <- numgqtests + 1
for (myalt in c('greater', 'two.sided', 'less')) {
j <- j + 1
gqarr[mypoint-kp3+1,j] <- gqtest(mylm, point=mypoint, alternative=myalt)$p.value
}
if (gqarr[mypoint-kp3+1,2] < 0.01) numsignificant1 <- numsignificant1 + 1
if (gqarr[mypoint-kp3+1,2] < 0.05) numsignificant5 <- numsignificant5 + 1
if (gqarr[mypoint-kp3+1,2] < 0.10) numsignificant10 <- numsignificant10 + 1
}
gqarr
}
bitmap(file='test0.png')
plot(x[,1], type='l', main='Actuals and Interpolation', ylab='value of Actuals and Interpolation (dots)', xlab='time or index')
points(x[,1]-mysum$resid)
grid()
dev.off()
bitmap(file='test1.png')
plot(mysum$resid, type='b', pch=19, main='Residuals', ylab='value of Residuals', xlab='time or index')
grid()
dev.off()
bitmap(file='test2.png')
hist(mysum$resid, main='Residual Histogram', xlab='values of Residuals')
grid()
dev.off()
bitmap(file='test3.png')
densityplot(~mysum$resid,col='black',main='Residual Density Plot', xlab='values of Residuals')
dev.off()
bitmap(file='test4.png')
qqnorm(mysum$resid, main='Residual Normal Q-Q Plot')
qqline(mysum$resid)
grid()
dev.off()
(myerror <- as.ts(mysum$resid))
bitmap(file='test5.png')
dum <- cbind(lag(myerror,k=1),myerror)
dum
dum1 <- dum[2:length(myerror),]
dum1
z <- as.data.frame(dum1)
z
plot(z,main=paste('Residual Lag plot, lowess, and regression line'), ylab='values of Residuals', xlab='lagged values of Residuals')
lines(lowess(z))
abline(lm(z))
grid()
dev.off()
bitmap(file='test6.png')
acf(mysum$resid, lag.max=length(mysum$resid)/2, main='Residual Autocorrelation Function')
grid()
dev.off()
bitmap(file='test7.png')
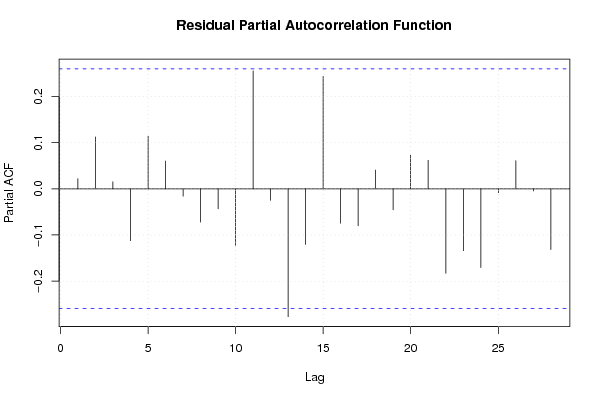
pacf(mysum$resid, lag.max=length(mysum$resid)/2, main='Residual Partial Autocorrelation Function')
grid()
dev.off()
bitmap(file='test8.png')
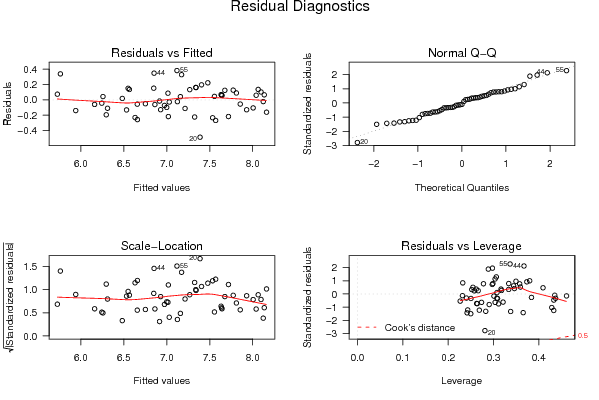
opar <- par(mfrow = c(2,2), oma = c(0, 0, 1.1, 0))
plot(mylm, las = 1, sub='Residual Diagnostics')
par(opar)
dev.off()
if (n > n25) {
bitmap(file='test9.png')
plot(kp3:nmkm3,gqarr[,2], main='Goldfeld-Quandt test',ylab='2-sided p-value',xlab='breakpoint')
grid()
dev.off()
}
load(file='createtable')
a<-table.start()
a<-table.row.start(a)
a<-table.element(a, 'Multiple Linear Regression - Estimated Regression Equation', 1, TRUE)
a<-table.row.end(a)
myeq <- colnames(x)[1]
myeq <- paste(myeq, '[t] = ', sep='')
for (i in 1:k){
if (mysum$coefficients[i,1] > 0) myeq <- paste(myeq, '+', '')
myeq <- paste(myeq, mysum$coefficients[i,1], sep=' ')
if (rownames(mysum$coefficients)[i] != '(Intercept)') {
myeq <- paste(myeq, rownames(mysum$coefficients)[i], sep='')
if (rownames(mysum$coefficients)[i] != 't') myeq <- paste(myeq, '[t]', sep='')
}
}
myeq <- paste(myeq, ' + e[t]')
a<-table.row.start(a)
a<-table.element(a, myeq)
a<-table.row.end(a)
a<-table.end(a)
table.save(a,file='mytable1.tab')
a<-table.start()
a<-table.row.start(a)
a<-table.element(a,hyperlink('ols1.htm','Multiple Linear Regression - Ordinary Least Squares',''), 6, TRUE)
a<-table.row.end(a)
a<-table.row.start(a)
a<-table.element(a,'Variable',header=TRUE)
a<-table.element(a,'Parameter',header=TRUE)
a<-table.element(a,'S.D.',header=TRUE)
a<-table.element(a,'T-STAT
H0: parameter = 0',header=TRUE)
a<-table.element(a,'2-tail p-value',header=TRUE)
a<-table.element(a,'1-tail p-value',header=TRUE)
a<-table.row.end(a)
for (i in 1:k){
a<-table.row.start(a)
a<-table.element(a,rownames(mysum$coefficients)[i],header=TRUE)
a<-table.element(a,mysum$coefficients[i,1])
a<-table.element(a, round(mysum$coefficients[i,2],6))
a<-table.element(a, round(mysum$coefficients[i,3],4))
a<-table.element(a, round(mysum$coefficients[i,4],6))
a<-table.element(a, round(mysum$coefficients[i,4]/2,6))
a<-table.row.end(a)
}
a<-table.end(a)
table.save(a,file='mytable2.tab')
a<-table.start()
a<-table.row.start(a)
a<-table.element(a, 'Multiple Linear Regression - Regression Statistics', 2, TRUE)
a<-table.row.end(a)
a<-table.row.start(a)
a<-table.element(a, 'Multiple R',1,TRUE)
a<-table.element(a, sqrt(mysum$r.squared))
a<-table.row.end(a)
a<-table.row.start(a)
a<-table.element(a, 'R-squared',1,TRUE)
a<-table.element(a, mysum$r.squared)
a<-table.row.end(a)
a<-table.row.start(a)
a<-table.element(a, 'Adjusted R-squared',1,TRUE)
a<-table.element(a, mysum$adj.r.squared)
a<-table.row.end(a)
a<-table.row.start(a)
a<-table.element(a, 'F-TEST (value)',1,TRUE)
a<-table.element(a, mysum$fstatistic[1])
a<-table.row.end(a)
a<-table.row.start(a)
a<-table.element(a, 'F-TEST (DF numerator)',1,TRUE)
a<-table.element(a, mysum$fstatistic[2])
a<-table.row.end(a)
a<-table.row.start(a)
a<-table.element(a, 'F-TEST (DF denominator)',1,TRUE)
a<-table.element(a, mysum$fstatistic[3])
a<-table.row.end(a)
a<-table.row.start(a)
a<-table.element(a, 'p-value',1,TRUE)
a<-table.element(a, 1-pf(mysum$fstatistic[1],mysum$fstatistic[2],mysum$fstatistic[3]))
a<-table.row.end(a)
a<-table.row.start(a)
a<-table.element(a, 'Multiple Linear Regression - Residual Statistics', 2, TRUE)
a<-table.row.end(a)
a<-table.row.start(a)
a<-table.element(a, 'Residual Standard Deviation',1,TRUE)
a<-table.element(a, mysum$sigma)
a<-table.row.end(a)
a<-table.row.start(a)
a<-table.element(a, 'Sum Squared Residuals',1,TRUE)
a<-table.element(a, sum(myerror*myerror))
a<-table.row.end(a)
a<-table.end(a)
table.save(a,file='mytable3.tab')
a<-table.start()
a<-table.row.start(a)
a<-table.element(a, 'Multiple Linear Regression - Actuals, Interpolation, and Residuals', 4, TRUE)
a<-table.row.end(a)
a<-table.row.start(a)
a<-table.element(a, 'Time or Index', 1, TRUE)
a<-table.element(a, 'Actuals', 1, TRUE)
a<-table.element(a, 'Interpolation
Forecast', 1, TRUE)
a<-table.element(a, 'Residuals
Prediction Error', 1, TRUE)
a<-table.row.end(a)
for (i in 1:n) {
a<-table.row.start(a)
a<-table.element(a,i, 1, TRUE)
a<-table.element(a,x[i])
a<-table.element(a,x[i]-mysum$resid[i])
a<-table.element(a,mysum$resid[i])
a<-table.row.end(a)
}
a<-table.end(a)
table.save(a,file='mytable4.tab')
if (n > n25) {
a<-table.start()
a<-table.row.start(a)
a<-table.element(a,'Goldfeld-Quandt test for Heteroskedasticity',4,TRUE)
a<-table.row.end(a)
a<-table.row.start(a)
a<-table.element(a,'p-values',header=TRUE)
a<-table.element(a,'Alternative Hypothesis',3,header=TRUE)
a<-table.row.end(a)
a<-table.row.start(a)
a<-table.element(a,'breakpoint index',header=TRUE)
a<-table.element(a,'greater',header=TRUE)
a<-table.element(a,'2-sided',header=TRUE)
a<-table.element(a,'less',header=TRUE)
a<-table.row.end(a)
for (mypoint in kp3:nmkm3) {
a<-table.row.start(a)
a<-table.element(a,mypoint,header=TRUE)
a<-table.element(a,gqarr[mypoint-kp3+1,1])
a<-table.element(a,gqarr[mypoint-kp3+1,2])
a<-table.element(a,gqarr[mypoint-kp3+1,3])
a<-table.row.end(a)
}
a<-table.end(a)
table.save(a,file='mytable5.tab')
a<-table.start()
a<-table.row.start(a)
a<-table.element(a,'Meta Analysis of Goldfeld-Quandt test for Heteroskedasticity',4,TRUE)
a<-table.row.end(a)
a<-table.row.start(a)
a<-table.element(a,'Description',header=TRUE)
a<-table.element(a,'# significant tests',header=TRUE)
a<-table.element(a,'% significant tests',header=TRUE)
a<-table.element(a,'OK/NOK',header=TRUE)
a<-table.row.end(a)
a<-table.row.start(a)
a<-table.element(a,'1% type I error level',header=TRUE)
a<-table.element(a,numsignificant1)
a<-table.element(a,numsignificant1/numgqtests)
if (numsignificant1/numgqtests < 0.01) dum <- 'OK' else dum <- 'NOK'
a<-table.element(a,dum)
a<-table.row.end(a)
a<-table.row.start(a)
a<-table.element(a,'5% type I error level',header=TRUE)
a<-table.element(a,numsignificant5)
a<-table.element(a,numsignificant5/numgqtests)
if (numsignificant5/numgqtests < 0.05) dum <- 'OK' else dum <- 'NOK'
a<-table.element(a,dum)
a<-table.row.end(a)
a<-table.row.start(a)
a<-table.element(a,'10% type I error level',header=TRUE)
a<-table.element(a,numsignificant10)
a<-table.element(a,numsignificant10/numgqtests)
if (numsignificant10/numgqtests < 0.1) dum <- 'OK' else dum <- 'NOK'
a<-table.element(a,dum)
a<-table.row.end(a)
a<-table.end(a)
table.save(a,file='mytable6.tab')
}