Free Statistics

of Irreproducible Research!

Author's title

multiple regression with seasonal effects, index cijfer van industriële pro...

Author*Unverified author*
R Software Modulerwasp_multipleregression.wasp
Title produced by softwareMultiple Regression
Date of computationWed, 18 Nov 2009 14:40:19 -0700
Cite this page as followsStatistical Computations at FreeStatistics.org, Office for Research Development and Education, URL https://freestatistics.org/blog/index.php?v=date/2009/Nov/18/t12585805402jarshsjl0jqr8y.htm/, Retrieved Sat, 04 May 2024 17:47:32 +0000
Statistical Computations at FreeStatistics.org, Office for Research Development and Education, URL https://freestatistics.org/blog/index.php?pk=57628, Retrieved Sat, 04 May 2024 17:47:32 +0000
QR Codes:

Original text written by user:
IsPrivate?No (this computation is public)
User-defined keywords
Estimated Impact147
Family? (F = Feedback message, R = changed R code, M = changed R Module, P = changed Parameters, D = changed Data)
-     [Multiple Regression] [Q1 The Seatbeltlaw] [2007-11-14 19:27:43] [8cd6641b921d30ebe00b648d1481bba0]
- RMPD  [Multiple Regression] [Seatbelt] [2009-11-12 14:03:14] [b98453cac15ba1066b407e146608df68]
-   PD      [Multiple Regression] [multiple regressi...] [2009-11-18 21:40:19] [d41d8cd98f00b204e9800998ecf8427e] [Current]
Feedback Forum

Post a new message
Dataseries X:
117.1	95.1
118.7	97
126.5	112.7
127.5	102.9
134.6	97.4
131.8	111.4
135.9	87.4
142.7	96.8
141.7	114.1
153.4	110.3
145	103.9
137.7	101.6
148.3	94.6
152.2	95.9
169.4	104.7
168.6	102.8
161.1	98.1
174.1	113.9
179	80.9
190.6	95.7
190	113.2
181.6	105.9
174.8	108.8
180.5	102.3
196.8	99
193.8	100.7
197	115.5
216.3	100.7
221.4	109.9
217.9	114.6
229.7	85.4
227.4	100.5
204.2	114.8
196.6	116.5
198.8	112.9
207.5	102
190.7	106
201.6	105.3
210.5	118.8
223.5	106.1
223.8	109.3
231.2	117.2
244	92.5
234.7	104.2
250.2	112.5
265.7	122.4
287.6	113.3
283.3	100
295.4	110.7
312.3	112.8
333.8	109.8
347.7	117.3
383.2	109.1
407.1	115.9
413.6	96
362.7	99.8
321.9	116.8
239.4	115.7
191	99.4
159.7	94.3
163.4	91


Summary of computational transaction
Raw Inputview raw input (R code)
Raw Outputview raw output of R engine
Computing time3 seconds
R Server'Gwilym Jenkins' @ 72.249.127.135

\begin{tabular}{lllllllll}
\hline
Summary of computational transaction \tabularnewline
Raw Input & view raw input (R code)  \tabularnewline
Raw Output & view raw output of R engine  \tabularnewline
Computing time & 3 seconds \tabularnewline
R Server & 'Gwilym Jenkins' @ 72.249.127.135 \tabularnewline
\hline
\end{tabular}
%Source: https://freestatistics.org/blog/index.php?pk=57628&T=0

[TABLE]
[ROW][C]Summary of computational transaction[/C][/ROW]
[ROW][C]Raw Input[/C][C]view raw input (R code) [/C][/ROW]
[ROW][C]Raw Output[/C][C]view raw output of R engine [/C][/ROW]
[ROW][C]Computing time[/C][C]3 seconds[/C][/ROW]
[ROW][C]R Server[/C][C]'Gwilym Jenkins' @ 72.249.127.135[/C][/ROW]
[/TABLE]
Source: https://freestatistics.org/blog/index.php?pk=57628&T=0

Globally Unique Identifier (entire table): ba.freestatistics.org/blog/index.php?pk=57628&T=0

As an alternative you can also use a QR Code:  

The GUIDs for individual cells are displayed in the table below:

Summary of computational transaction
Raw Inputview raw input (R code)
Raw Outputview raw output of R engine
Computing time3 seconds
R Server'Gwilym Jenkins' @ 72.249.127.135


Multiple Linear Regression - Estimated Regression Equation
prijsindgrondst[t] = -40.0102897317963 + 2.40158782962229indexindustrprod[t] + e[t]

\begin{tabular}{lllllllll}
\hline
Multiple Linear Regression - Estimated Regression Equation \tabularnewline
prijsindgrondst[t] =  -40.0102897317963 +  2.40158782962229indexindustrprod[t]  + e[t] \tabularnewline
\hline
\end{tabular}
%Source: https://freestatistics.org/blog/index.php?pk=57628&T=1

[TABLE]
[ROW][C]Multiple Linear Regression - Estimated Regression Equation[/C][/ROW]
[ROW][C]prijsindgrondst[t] =  -40.0102897317963 +  2.40158782962229indexindustrprod[t]  + e[t][/C][/ROW]
[/TABLE]
Source: https://freestatistics.org/blog/index.php?pk=57628&T=1

Globally Unique Identifier (entire table): ba.freestatistics.org/blog/index.php?pk=57628&T=1

As an alternative you can also use a QR Code:  

The GUIDs for individual cells are displayed in the table below:

Multiple Linear Regression - Estimated Regression Equation
prijsindgrondst[t] = -40.0102897317963 + 2.40158782962229indexindustrprod[t] + e[t]


Multiple Linear Regression - Ordinary Least Squares
VariableParameterS.D.T-STATH0: parameter = 02-tail p-value1-tail p-value
(Intercept)-40.0102897317963103.886828-0.38510.7015240.350762
indexindustrprod2.401587829622290.984062.44050.0176890.008845

\begin{tabular}{lllllllll}
\hline
Multiple Linear Regression - Ordinary Least Squares \tabularnewline
Variable & Parameter & S.D. & T-STATH0: parameter = 0 & 2-tail p-value & 1-tail p-value \tabularnewline
(Intercept) & -40.0102897317963 & 103.886828 & -0.3851 & 0.701524 & 0.350762 \tabularnewline
indexindustrprod & 2.40158782962229 & 0.98406 & 2.4405 & 0.017689 & 0.008845 \tabularnewline
\hline
\end{tabular}
%Source: https://freestatistics.org/blog/index.php?pk=57628&T=2

[TABLE]
[ROW][C]Multiple Linear Regression - Ordinary Least Squares[/C][/ROW]
[ROW][C]Variable[/C][C]Parameter[/C][C]S.D.[/C][C]T-STATH0: parameter = 0[/C][C]2-tail p-value[/C][C]1-tail p-value[/C][/ROW]
[ROW][C](Intercept)[/C][C]-40.0102897317963[/C][C]103.886828[/C][C]-0.3851[/C][C]0.701524[/C][C]0.350762[/C][/ROW]
[ROW][C]indexindustrprod[/C][C]2.40158782962229[/C][C]0.98406[/C][C]2.4405[/C][C]0.017689[/C][C]0.008845[/C][/ROW]
[/TABLE]
Source: https://freestatistics.org/blog/index.php?pk=57628&T=2

Globally Unique Identifier (entire table): ba.freestatistics.org/blog/index.php?pk=57628&T=2

As an alternative you can also use a QR Code:  

The GUIDs for individual cells are displayed in the table below:

Multiple Linear Regression - Ordinary Least Squares
VariableParameterS.D.T-STATH0: parameter = 02-tail p-value1-tail p-value
(Intercept)-40.0102897317963103.886828-0.38510.7015240.350762
indexindustrprod2.401587829622290.984062.44050.0176890.008845


Multiple Linear Regression - Regression Statistics
Multiple R0.302807907985026
R-squared0.0916926291382681
Adjusted R-squared0.0762975889541710
F-TEST (value)5.95598504724822
F-TEST (DF numerator)1
F-TEST (DF denominator)59
p-value0.0176891166963649
Multiple Linear Regression - Residual Statistics
Residual Standard Deviation69.4662191260859
Sum Squared Residuals284707.780380730

\begin{tabular}{lllllllll}
\hline
Multiple Linear Regression - Regression Statistics \tabularnewline
Multiple R & 0.302807907985026 \tabularnewline
R-squared & 0.0916926291382681 \tabularnewline
Adjusted R-squared & 0.0762975889541710 \tabularnewline
F-TEST (value) & 5.95598504724822 \tabularnewline
F-TEST (DF numerator) & 1 \tabularnewline
F-TEST (DF denominator) & 59 \tabularnewline
p-value & 0.0176891166963649 \tabularnewline
Multiple Linear Regression - Residual Statistics \tabularnewline
Residual Standard Deviation & 69.4662191260859 \tabularnewline
Sum Squared Residuals & 284707.780380730 \tabularnewline
\hline
\end{tabular}
%Source: https://freestatistics.org/blog/index.php?pk=57628&T=3

[TABLE]
[ROW][C]Multiple Linear Regression - Regression Statistics[/C][/ROW]
[ROW][C]Multiple R[/C][C]0.302807907985026[/C][/ROW]
[ROW][C]R-squared[/C][C]0.0916926291382681[/C][/ROW]
[ROW][C]Adjusted R-squared[/C][C]0.0762975889541710[/C][/ROW]
[ROW][C]F-TEST (value)[/C][C]5.95598504724822[/C][/ROW]
[ROW][C]F-TEST (DF numerator)[/C][C]1[/C][/ROW]
[ROW][C]F-TEST (DF denominator)[/C][C]59[/C][/ROW]
[ROW][C]p-value[/C][C]0.0176891166963649[/C][/ROW]
[ROW][C]Multiple Linear Regression - Residual Statistics[/C][/ROW]
[ROW][C]Residual Standard Deviation[/C][C]69.4662191260859[/C][/ROW]
[ROW][C]Sum Squared Residuals[/C][C]284707.780380730[/C][/ROW]
[/TABLE]
Source: https://freestatistics.org/blog/index.php?pk=57628&T=3

Globally Unique Identifier (entire table): ba.freestatistics.org/blog/index.php?pk=57628&T=3

As an alternative you can also use a QR Code:  

The GUIDs for individual cells are displayed in the table below:

Multiple Linear Regression - Regression Statistics
Multiple R0.302807907985026
R-squared0.0916926291382681
Adjusted R-squared0.0762975889541710
F-TEST (value)5.95598504724822
F-TEST (DF numerator)1
F-TEST (DF denominator)59
p-value0.0176891166963649
Multiple Linear Regression - Residual Statistics
Residual Standard Deviation69.4662191260859
Sum Squared Residuals284707.780380730


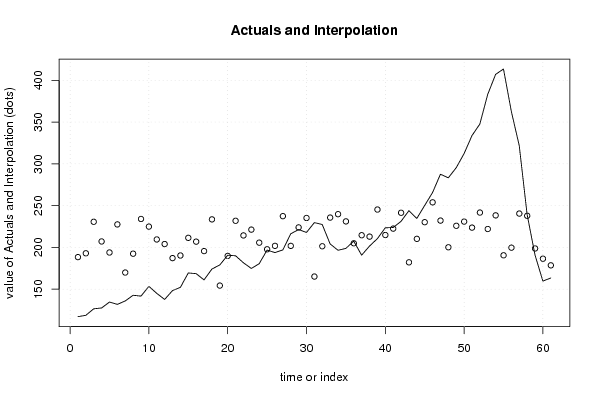
Multiple Linear Regression - Actuals, Interpolation, and Residuals
Time or IndexActualsInterpolationForecastResidualsPrediction Error
1117.1188.380712865283-71.280712865283
2118.7192.943729741566-74.2437297415658
3126.5230.648658666636-104.148658666636
4127.5207.113097936337-79.6130979363374
5134.6193.904364873415-59.3043648734147
6131.8227.526594488127-95.7265944881268
7135.9169.888486577192-33.9884865771918
8142.7192.463412175641-49.7634121756414
9141.7234.010881628107-92.310881628107
10153.4224.884847875542-71.4848478755423
11145209.514685765960-64.5146857659596
12137.7203.991033757828-66.2910337578284
13148.3187.179918950472-38.8799189504723
14152.2190.301983128981-38.1019831289813
15169.4211.435956029657-42.0359560296575
16168.6206.872939153375-38.2729391533751
17161.1195.585476354150-34.4854763541503
18174.1233.530564062183-59.4305640621826
19179154.27816568464724.7218343153530
20190.6189.8216655630570.77833443694315
21190231.849452581447-41.8494525814469
22181.6214.317861425204-32.7178614252042
23174.8221.282466131109-46.4824661311088
24180.5205.672145238564-25.1721452385639
25196.8197.746905400810-0.946905400810386
26193.8201.829604711168-8.02960471116829
27197237.373104589578-40.3731045895782
28216.3201.82960471116814.4703952888317
29221.4223.924212743693-2.52421274369338
30217.9235.211675542918-17.3116755429181
31229.7165.08531091794764.6146890820527
32227.4201.34928714524426.0507128547562
33204.2235.691993108843-31.4919931088426
34196.6239.774692419201-43.1746924192005
35198.8231.128976232560-32.3289762325602
36207.5204.9516688896772.54833111032273
37190.7214.558020208166-23.8580202081664
38201.6212.876908727431-11.2769087274308
39210.5245.298344427332-34.7983444273318
40223.5214.7981789911298.70182100887135
41223.8222.483260045921.31673995408002
42231.2241.455803899936-10.2558038999361
43244182.13658450826661.8634154917345
44234.7210.23516211484624.4648378851537
45250.2230.16834110071120.0316588992887
46265.7253.94406061397211.7559393860280
47287.6232.08961136440955.5103886355909
48283.3200.14849323043383.1515067695673
49295.4225.84548300739169.5545169926088
50312.3230.88881744959881.411182550402
51333.8223.684053960731110.115946039269
52347.7241.695962682898106.004037317102
53383.2222.002942479996161.197057520004
54407.1238.333739721427168.766260278573
55413.6190.542141911944223.057858088056
56362.7199.668175664508163.031824335492
57321.9240.49516876808781.4048312319128
58239.4237.8534221555031.54657784449734
59191198.707540532659-7.70754053265933
60159.7186.459442601586-26.7594426015856
61163.4178.534202763832-15.1342027638321

\begin{tabular}{lllllllll}
\hline
Multiple Linear Regression - Actuals, Interpolation, and Residuals \tabularnewline
Time or Index & Actuals & InterpolationForecast & ResidualsPrediction Error \tabularnewline
1 & 117.1 & 188.380712865283 & -71.280712865283 \tabularnewline
2 & 118.7 & 192.943729741566 & -74.2437297415658 \tabularnewline
3 & 126.5 & 230.648658666636 & -104.148658666636 \tabularnewline
4 & 127.5 & 207.113097936337 & -79.6130979363374 \tabularnewline
5 & 134.6 & 193.904364873415 & -59.3043648734147 \tabularnewline
6 & 131.8 & 227.526594488127 & -95.7265944881268 \tabularnewline
7 & 135.9 & 169.888486577192 & -33.9884865771918 \tabularnewline
8 & 142.7 & 192.463412175641 & -49.7634121756414 \tabularnewline
9 & 141.7 & 234.010881628107 & -92.310881628107 \tabularnewline
10 & 153.4 & 224.884847875542 & -71.4848478755423 \tabularnewline
11 & 145 & 209.514685765960 & -64.5146857659596 \tabularnewline
12 & 137.7 & 203.991033757828 & -66.2910337578284 \tabularnewline
13 & 148.3 & 187.179918950472 & -38.8799189504723 \tabularnewline
14 & 152.2 & 190.301983128981 & -38.1019831289813 \tabularnewline
15 & 169.4 & 211.435956029657 & -42.0359560296575 \tabularnewline
16 & 168.6 & 206.872939153375 & -38.2729391533751 \tabularnewline
17 & 161.1 & 195.585476354150 & -34.4854763541503 \tabularnewline
18 & 174.1 & 233.530564062183 & -59.4305640621826 \tabularnewline
19 & 179 & 154.278165684647 & 24.7218343153530 \tabularnewline
20 & 190.6 & 189.821665563057 & 0.77833443694315 \tabularnewline
21 & 190 & 231.849452581447 & -41.8494525814469 \tabularnewline
22 & 181.6 & 214.317861425204 & -32.7178614252042 \tabularnewline
23 & 174.8 & 221.282466131109 & -46.4824661311088 \tabularnewline
24 & 180.5 & 205.672145238564 & -25.1721452385639 \tabularnewline
25 & 196.8 & 197.746905400810 & -0.946905400810386 \tabularnewline
26 & 193.8 & 201.829604711168 & -8.02960471116829 \tabularnewline
27 & 197 & 237.373104589578 & -40.3731045895782 \tabularnewline
28 & 216.3 & 201.829604711168 & 14.4703952888317 \tabularnewline
29 & 221.4 & 223.924212743693 & -2.52421274369338 \tabularnewline
30 & 217.9 & 235.211675542918 & -17.3116755429181 \tabularnewline
31 & 229.7 & 165.085310917947 & 64.6146890820527 \tabularnewline
32 & 227.4 & 201.349287145244 & 26.0507128547562 \tabularnewline
33 & 204.2 & 235.691993108843 & -31.4919931088426 \tabularnewline
34 & 196.6 & 239.774692419201 & -43.1746924192005 \tabularnewline
35 & 198.8 & 231.128976232560 & -32.3289762325602 \tabularnewline
36 & 207.5 & 204.951668889677 & 2.54833111032273 \tabularnewline
37 & 190.7 & 214.558020208166 & -23.8580202081664 \tabularnewline
38 & 201.6 & 212.876908727431 & -11.2769087274308 \tabularnewline
39 & 210.5 & 245.298344427332 & -34.7983444273318 \tabularnewline
40 & 223.5 & 214.798178991129 & 8.70182100887135 \tabularnewline
41 & 223.8 & 222.48326004592 & 1.31673995408002 \tabularnewline
42 & 231.2 & 241.455803899936 & -10.2558038999361 \tabularnewline
43 & 244 & 182.136584508266 & 61.8634154917345 \tabularnewline
44 & 234.7 & 210.235162114846 & 24.4648378851537 \tabularnewline
45 & 250.2 & 230.168341100711 & 20.0316588992887 \tabularnewline
46 & 265.7 & 253.944060613972 & 11.7559393860280 \tabularnewline
47 & 287.6 & 232.089611364409 & 55.5103886355909 \tabularnewline
48 & 283.3 & 200.148493230433 & 83.1515067695673 \tabularnewline
49 & 295.4 & 225.845483007391 & 69.5545169926088 \tabularnewline
50 & 312.3 & 230.888817449598 & 81.411182550402 \tabularnewline
51 & 333.8 & 223.684053960731 & 110.115946039269 \tabularnewline
52 & 347.7 & 241.695962682898 & 106.004037317102 \tabularnewline
53 & 383.2 & 222.002942479996 & 161.197057520004 \tabularnewline
54 & 407.1 & 238.333739721427 & 168.766260278573 \tabularnewline
55 & 413.6 & 190.542141911944 & 223.057858088056 \tabularnewline
56 & 362.7 & 199.668175664508 & 163.031824335492 \tabularnewline
57 & 321.9 & 240.495168768087 & 81.4048312319128 \tabularnewline
58 & 239.4 & 237.853422155503 & 1.54657784449734 \tabularnewline
59 & 191 & 198.707540532659 & -7.70754053265933 \tabularnewline
60 & 159.7 & 186.459442601586 & -26.7594426015856 \tabularnewline
61 & 163.4 & 178.534202763832 & -15.1342027638321 \tabularnewline
\hline
\end{tabular}
%Source: https://freestatistics.org/blog/index.php?pk=57628&T=4

[TABLE]
[ROW][C]Multiple Linear Regression - Actuals, Interpolation, and Residuals[/C][/ROW]
[ROW][C]Time or Index[/C][C]Actuals[/C][C]InterpolationForecast[/C][C]ResidualsPrediction Error[/C][/ROW]
[ROW][C]1[/C][C]117.1[/C][C]188.380712865283[/C][C]-71.280712865283[/C][/ROW]
[ROW][C]2[/C][C]118.7[/C][C]192.943729741566[/C][C]-74.2437297415658[/C][/ROW]
[ROW][C]3[/C][C]126.5[/C][C]230.648658666636[/C][C]-104.148658666636[/C][/ROW]
[ROW][C]4[/C][C]127.5[/C][C]207.113097936337[/C][C]-79.6130979363374[/C][/ROW]
[ROW][C]5[/C][C]134.6[/C][C]193.904364873415[/C][C]-59.3043648734147[/C][/ROW]
[ROW][C]6[/C][C]131.8[/C][C]227.526594488127[/C][C]-95.7265944881268[/C][/ROW]
[ROW][C]7[/C][C]135.9[/C][C]169.888486577192[/C][C]-33.9884865771918[/C][/ROW]
[ROW][C]8[/C][C]142.7[/C][C]192.463412175641[/C][C]-49.7634121756414[/C][/ROW]
[ROW][C]9[/C][C]141.7[/C][C]234.010881628107[/C][C]-92.310881628107[/C][/ROW]
[ROW][C]10[/C][C]153.4[/C][C]224.884847875542[/C][C]-71.4848478755423[/C][/ROW]
[ROW][C]11[/C][C]145[/C][C]209.514685765960[/C][C]-64.5146857659596[/C][/ROW]
[ROW][C]12[/C][C]137.7[/C][C]203.991033757828[/C][C]-66.2910337578284[/C][/ROW]
[ROW][C]13[/C][C]148.3[/C][C]187.179918950472[/C][C]-38.8799189504723[/C][/ROW]
[ROW][C]14[/C][C]152.2[/C][C]190.301983128981[/C][C]-38.1019831289813[/C][/ROW]
[ROW][C]15[/C][C]169.4[/C][C]211.435956029657[/C][C]-42.0359560296575[/C][/ROW]
[ROW][C]16[/C][C]168.6[/C][C]206.872939153375[/C][C]-38.2729391533751[/C][/ROW]
[ROW][C]17[/C][C]161.1[/C][C]195.585476354150[/C][C]-34.4854763541503[/C][/ROW]
[ROW][C]18[/C][C]174.1[/C][C]233.530564062183[/C][C]-59.4305640621826[/C][/ROW]
[ROW][C]19[/C][C]179[/C][C]154.278165684647[/C][C]24.7218343153530[/C][/ROW]
[ROW][C]20[/C][C]190.6[/C][C]189.821665563057[/C][C]0.77833443694315[/C][/ROW]
[ROW][C]21[/C][C]190[/C][C]231.849452581447[/C][C]-41.8494525814469[/C][/ROW]
[ROW][C]22[/C][C]181.6[/C][C]214.317861425204[/C][C]-32.7178614252042[/C][/ROW]
[ROW][C]23[/C][C]174.8[/C][C]221.282466131109[/C][C]-46.4824661311088[/C][/ROW]
[ROW][C]24[/C][C]180.5[/C][C]205.672145238564[/C][C]-25.1721452385639[/C][/ROW]
[ROW][C]25[/C][C]196.8[/C][C]197.746905400810[/C][C]-0.946905400810386[/C][/ROW]
[ROW][C]26[/C][C]193.8[/C][C]201.829604711168[/C][C]-8.02960471116829[/C][/ROW]
[ROW][C]27[/C][C]197[/C][C]237.373104589578[/C][C]-40.3731045895782[/C][/ROW]
[ROW][C]28[/C][C]216.3[/C][C]201.829604711168[/C][C]14.4703952888317[/C][/ROW]
[ROW][C]29[/C][C]221.4[/C][C]223.924212743693[/C][C]-2.52421274369338[/C][/ROW]
[ROW][C]30[/C][C]217.9[/C][C]235.211675542918[/C][C]-17.3116755429181[/C][/ROW]
[ROW][C]31[/C][C]229.7[/C][C]165.085310917947[/C][C]64.6146890820527[/C][/ROW]
[ROW][C]32[/C][C]227.4[/C][C]201.349287145244[/C][C]26.0507128547562[/C][/ROW]
[ROW][C]33[/C][C]204.2[/C][C]235.691993108843[/C][C]-31.4919931088426[/C][/ROW]
[ROW][C]34[/C][C]196.6[/C][C]239.774692419201[/C][C]-43.1746924192005[/C][/ROW]
[ROW][C]35[/C][C]198.8[/C][C]231.128976232560[/C][C]-32.3289762325602[/C][/ROW]
[ROW][C]36[/C][C]207.5[/C][C]204.951668889677[/C][C]2.54833111032273[/C][/ROW]
[ROW][C]37[/C][C]190.7[/C][C]214.558020208166[/C][C]-23.8580202081664[/C][/ROW]
[ROW][C]38[/C][C]201.6[/C][C]212.876908727431[/C][C]-11.2769087274308[/C][/ROW]
[ROW][C]39[/C][C]210.5[/C][C]245.298344427332[/C][C]-34.7983444273318[/C][/ROW]
[ROW][C]40[/C][C]223.5[/C][C]214.798178991129[/C][C]8.70182100887135[/C][/ROW]
[ROW][C]41[/C][C]223.8[/C][C]222.48326004592[/C][C]1.31673995408002[/C][/ROW]
[ROW][C]42[/C][C]231.2[/C][C]241.455803899936[/C][C]-10.2558038999361[/C][/ROW]
[ROW][C]43[/C][C]244[/C][C]182.136584508266[/C][C]61.8634154917345[/C][/ROW]
[ROW][C]44[/C][C]234.7[/C][C]210.235162114846[/C][C]24.4648378851537[/C][/ROW]
[ROW][C]45[/C][C]250.2[/C][C]230.168341100711[/C][C]20.0316588992887[/C][/ROW]
[ROW][C]46[/C][C]265.7[/C][C]253.944060613972[/C][C]11.7559393860280[/C][/ROW]
[ROW][C]47[/C][C]287.6[/C][C]232.089611364409[/C][C]55.5103886355909[/C][/ROW]
[ROW][C]48[/C][C]283.3[/C][C]200.148493230433[/C][C]83.1515067695673[/C][/ROW]
[ROW][C]49[/C][C]295.4[/C][C]225.845483007391[/C][C]69.5545169926088[/C][/ROW]
[ROW][C]50[/C][C]312.3[/C][C]230.888817449598[/C][C]81.411182550402[/C][/ROW]
[ROW][C]51[/C][C]333.8[/C][C]223.684053960731[/C][C]110.115946039269[/C][/ROW]
[ROW][C]52[/C][C]347.7[/C][C]241.695962682898[/C][C]106.004037317102[/C][/ROW]
[ROW][C]53[/C][C]383.2[/C][C]222.002942479996[/C][C]161.197057520004[/C][/ROW]
[ROW][C]54[/C][C]407.1[/C][C]238.333739721427[/C][C]168.766260278573[/C][/ROW]
[ROW][C]55[/C][C]413.6[/C][C]190.542141911944[/C][C]223.057858088056[/C][/ROW]
[ROW][C]56[/C][C]362.7[/C][C]199.668175664508[/C][C]163.031824335492[/C][/ROW]
[ROW][C]57[/C][C]321.9[/C][C]240.495168768087[/C][C]81.4048312319128[/C][/ROW]
[ROW][C]58[/C][C]239.4[/C][C]237.853422155503[/C][C]1.54657784449734[/C][/ROW]
[ROW][C]59[/C][C]191[/C][C]198.707540532659[/C][C]-7.70754053265933[/C][/ROW]
[ROW][C]60[/C][C]159.7[/C][C]186.459442601586[/C][C]-26.7594426015856[/C][/ROW]
[ROW][C]61[/C][C]163.4[/C][C]178.534202763832[/C][C]-15.1342027638321[/C][/ROW]
[/TABLE]
Source: https://freestatistics.org/blog/index.php?pk=57628&T=4

Globally Unique Identifier (entire table): ba.freestatistics.org/blog/index.php?pk=57628&T=4

As an alternative you can also use a QR Code:  

The GUIDs for individual cells are displayed in the table below:

Multiple Linear Regression - Actuals, Interpolation, and Residuals
Time or IndexActualsInterpolationForecastResidualsPrediction Error
1117.1188.380712865283-71.280712865283
2118.7192.943729741566-74.2437297415658
3126.5230.648658666636-104.148658666636
4127.5207.113097936337-79.6130979363374
5134.6193.904364873415-59.3043648734147
6131.8227.526594488127-95.7265944881268
7135.9169.888486577192-33.9884865771918
8142.7192.463412175641-49.7634121756414
9141.7234.010881628107-92.310881628107
10153.4224.884847875542-71.4848478755423
11145209.514685765960-64.5146857659596
12137.7203.991033757828-66.2910337578284
13148.3187.179918950472-38.8799189504723
14152.2190.301983128981-38.1019831289813
15169.4211.435956029657-42.0359560296575
16168.6206.872939153375-38.2729391533751
17161.1195.585476354150-34.4854763541503
18174.1233.530564062183-59.4305640621826
19179154.27816568464724.7218343153530
20190.6189.8216655630570.77833443694315
21190231.849452581447-41.8494525814469
22181.6214.317861425204-32.7178614252042
23174.8221.282466131109-46.4824661311088
24180.5205.672145238564-25.1721452385639
25196.8197.746905400810-0.946905400810386
26193.8201.829604711168-8.02960471116829
27197237.373104589578-40.3731045895782
28216.3201.82960471116814.4703952888317
29221.4223.924212743693-2.52421274369338
30217.9235.211675542918-17.3116755429181
31229.7165.08531091794764.6146890820527
32227.4201.34928714524426.0507128547562
33204.2235.691993108843-31.4919931088426
34196.6239.774692419201-43.1746924192005
35198.8231.128976232560-32.3289762325602
36207.5204.9516688896772.54833111032273
37190.7214.558020208166-23.8580202081664
38201.6212.876908727431-11.2769087274308
39210.5245.298344427332-34.7983444273318
40223.5214.7981789911298.70182100887135
41223.8222.483260045921.31673995408002
42231.2241.455803899936-10.2558038999361
43244182.13658450826661.8634154917345
44234.7210.23516211484624.4648378851537
45250.2230.16834110071120.0316588992887
46265.7253.94406061397211.7559393860280
47287.6232.08961136440955.5103886355909
48283.3200.14849323043383.1515067695673
49295.4225.84548300739169.5545169926088
50312.3230.88881744959881.411182550402
51333.8223.684053960731110.115946039269
52347.7241.695962682898106.004037317102
53383.2222.002942479996161.197057520004
54407.1238.333739721427168.766260278573
55413.6190.542141911944223.057858088056
56362.7199.668175664508163.031824335492
57321.9240.49516876808781.4048312319128
58239.4237.8534221555031.54657784449734
59191198.707540532659-7.70754053265933
60159.7186.459442601586-26.7594426015856
61163.4178.534202763832-15.1342027638321


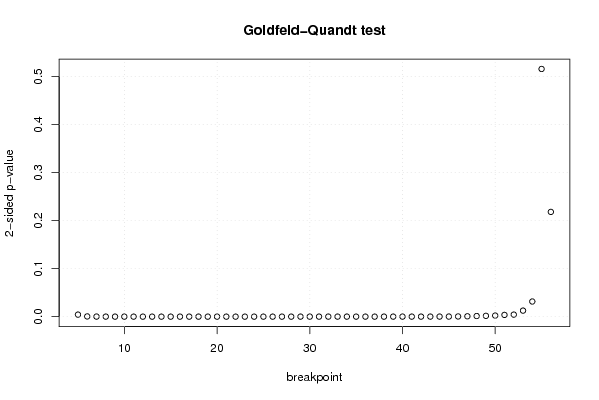
Goldfeld-Quandt test for Heteroskedasticity
p-valuesAlternative Hypothesis
breakpoint indexgreater2-sidedless
50.002128007251748690.004256014503497380.997871992748251
60.0002349348756610480.0004698697513220960.99976506512434
77.53622846936056e-050.0001507245693872110.999924637715306
83.30718468346579e-056.61436936693158e-050.999966928153165
91.00420533444249e-052.00841066888499e-050.999989957946656
108.78507831664667e-061.75701566332933e-050.999991214921683
112.4998205185364e-064.9996410370728e-060.999997500179481
124.88437919065135e-079.7687583813027e-070.99999951156208
132.24871699145993e-074.49743398291985e-070.9999997751283
141.19411927743264e-072.38823855486528e-070.999999880588072
153.78416339237948e-077.56832678475897e-070.99999962158366
165.10026675462674e-071.02005335092535e-060.999999489973325
172.95783097882315e-075.91566195764629e-070.999999704216902
183.13564951340734e-076.27129902681469e-070.999999686435049
196.13608081510266e-071.22721616302053e-060.999999386391919
201.44168793024032e-062.88337586048063e-060.99999855831207
212.83699316188593e-065.67398632377186e-060.999997163006838
222.41301801228236e-064.82603602456473e-060.999997586981988
231.56735830655739e-063.13471661311478e-060.999998432641694
241.16827633649235e-062.3365526729847e-060.999998831723663
251.69471734117948e-063.38943468235897e-060.99999830528266
261.80211665090772e-063.60423330181543e-060.999998197883349
271.93806027991559e-063.87612055983117e-060.99999806193972
284.72880417183402e-069.45760834366805e-060.999995271195828
299.08364268273567e-061.81672853654713e-050.999990916357317
301.06253133114512e-052.12506266229024e-050.999989374686689
313.14747614098436e-056.29495228196872e-050.99996852523859
324.3587120163884e-058.7174240327768e-050.999956412879836
333.57768025684938e-057.15536051369876e-050.999964223197432
343.02935343730347e-056.05870687460693e-050.999969706465627
352.58578111268122e-055.17156222536244e-050.999974142188873
362.06492701798448e-054.12985403596896e-050.99997935072982
371.69209243580322e-053.38418487160643e-050.999983079075642
381.44039037736971e-052.88078075473942e-050.999985596096226
391.82672041632283e-053.65344083264566e-050.999981732795837
402.01188035488831e-054.02376070977662e-050.99997988119645
412.31250282355324e-054.62500564710647e-050.999976874971764
423.5610827115818e-057.1221654231636e-050.999964389172884
435.66657065439823e-050.0001133314130879650.999943334293456
446.09873683608313e-050.0001219747367216630.99993901263164
458.64310036451164e-050.0001728620072902330.999913568996355
460.0001966322910706300.0003932645821412610.99980336770893
470.0003744975386576240.0007489950773152480.999625502461342
480.0006273698002838130.001254739600567630.999372630199716
490.0008376354727572880.001675270945514580.999162364527243
500.001128254228891400.002256508457782800.998871745771109
510.001827267070448930.003654534140897860.99817273292955
520.002128205668396590.004256411336793180.997871794331603
530.00628555956711370.01257111913422740.993714440432886
540.01576700660255370.03153401320510740.984232993397446
550.2578225679703040.5156451359406080.742177432029696
560.8909714064310630.2180571871378730.109028593568937

\begin{tabular}{lllllllll}
\hline
Goldfeld-Quandt test for Heteroskedasticity \tabularnewline
p-values & Alternative Hypothesis \tabularnewline
breakpoint index & greater & 2-sided & less \tabularnewline
5 & 0.00212800725174869 & 0.00425601450349738 & 0.997871992748251 \tabularnewline
6 & 0.000234934875661048 & 0.000469869751322096 & 0.99976506512434 \tabularnewline
7 & 7.53622846936056e-05 & 0.000150724569387211 & 0.999924637715306 \tabularnewline
8 & 3.30718468346579e-05 & 6.61436936693158e-05 & 0.999966928153165 \tabularnewline
9 & 1.00420533444249e-05 & 2.00841066888499e-05 & 0.999989957946656 \tabularnewline
10 & 8.78507831664667e-06 & 1.75701566332933e-05 & 0.999991214921683 \tabularnewline
11 & 2.4998205185364e-06 & 4.9996410370728e-06 & 0.999997500179481 \tabularnewline
12 & 4.88437919065135e-07 & 9.7687583813027e-07 & 0.99999951156208 \tabularnewline
13 & 2.24871699145993e-07 & 4.49743398291985e-07 & 0.9999997751283 \tabularnewline
14 & 1.19411927743264e-07 & 2.38823855486528e-07 & 0.999999880588072 \tabularnewline
15 & 3.78416339237948e-07 & 7.56832678475897e-07 & 0.99999962158366 \tabularnewline
16 & 5.10026675462674e-07 & 1.02005335092535e-06 & 0.999999489973325 \tabularnewline
17 & 2.95783097882315e-07 & 5.91566195764629e-07 & 0.999999704216902 \tabularnewline
18 & 3.13564951340734e-07 & 6.27129902681469e-07 & 0.999999686435049 \tabularnewline
19 & 6.13608081510266e-07 & 1.22721616302053e-06 & 0.999999386391919 \tabularnewline
20 & 1.44168793024032e-06 & 2.88337586048063e-06 & 0.99999855831207 \tabularnewline
21 & 2.83699316188593e-06 & 5.67398632377186e-06 & 0.999997163006838 \tabularnewline
22 & 2.41301801228236e-06 & 4.82603602456473e-06 & 0.999997586981988 \tabularnewline
23 & 1.56735830655739e-06 & 3.13471661311478e-06 & 0.999998432641694 \tabularnewline
24 & 1.16827633649235e-06 & 2.3365526729847e-06 & 0.999998831723663 \tabularnewline
25 & 1.69471734117948e-06 & 3.38943468235897e-06 & 0.99999830528266 \tabularnewline
26 & 1.80211665090772e-06 & 3.60423330181543e-06 & 0.999998197883349 \tabularnewline
27 & 1.93806027991559e-06 & 3.87612055983117e-06 & 0.99999806193972 \tabularnewline
28 & 4.72880417183402e-06 & 9.45760834366805e-06 & 0.999995271195828 \tabularnewline
29 & 9.08364268273567e-06 & 1.81672853654713e-05 & 0.999990916357317 \tabularnewline
30 & 1.06253133114512e-05 & 2.12506266229024e-05 & 0.999989374686689 \tabularnewline
31 & 3.14747614098436e-05 & 6.29495228196872e-05 & 0.99996852523859 \tabularnewline
32 & 4.3587120163884e-05 & 8.7174240327768e-05 & 0.999956412879836 \tabularnewline
33 & 3.57768025684938e-05 & 7.15536051369876e-05 & 0.999964223197432 \tabularnewline
34 & 3.02935343730347e-05 & 6.05870687460693e-05 & 0.999969706465627 \tabularnewline
35 & 2.58578111268122e-05 & 5.17156222536244e-05 & 0.999974142188873 \tabularnewline
36 & 2.06492701798448e-05 & 4.12985403596896e-05 & 0.99997935072982 \tabularnewline
37 & 1.69209243580322e-05 & 3.38418487160643e-05 & 0.999983079075642 \tabularnewline
38 & 1.44039037736971e-05 & 2.88078075473942e-05 & 0.999985596096226 \tabularnewline
39 & 1.82672041632283e-05 & 3.65344083264566e-05 & 0.999981732795837 \tabularnewline
40 & 2.01188035488831e-05 & 4.02376070977662e-05 & 0.99997988119645 \tabularnewline
41 & 2.31250282355324e-05 & 4.62500564710647e-05 & 0.999976874971764 \tabularnewline
42 & 3.5610827115818e-05 & 7.1221654231636e-05 & 0.999964389172884 \tabularnewline
43 & 5.66657065439823e-05 & 0.000113331413087965 & 0.999943334293456 \tabularnewline
44 & 6.09873683608313e-05 & 0.000121974736721663 & 0.99993901263164 \tabularnewline
45 & 8.64310036451164e-05 & 0.000172862007290233 & 0.999913568996355 \tabularnewline
46 & 0.000196632291070630 & 0.000393264582141261 & 0.99980336770893 \tabularnewline
47 & 0.000374497538657624 & 0.000748995077315248 & 0.999625502461342 \tabularnewline
48 & 0.000627369800283813 & 0.00125473960056763 & 0.999372630199716 \tabularnewline
49 & 0.000837635472757288 & 0.00167527094551458 & 0.999162364527243 \tabularnewline
50 & 0.00112825422889140 & 0.00225650845778280 & 0.998871745771109 \tabularnewline
51 & 0.00182726707044893 & 0.00365453414089786 & 0.99817273292955 \tabularnewline
52 & 0.00212820566839659 & 0.00425641133679318 & 0.997871794331603 \tabularnewline
53 & 0.0062855595671137 & 0.0125711191342274 & 0.993714440432886 \tabularnewline
54 & 0.0157670066025537 & 0.0315340132051074 & 0.984232993397446 \tabularnewline
55 & 0.257822567970304 & 0.515645135940608 & 0.742177432029696 \tabularnewline
56 & 0.890971406431063 & 0.218057187137873 & 0.109028593568937 \tabularnewline
\hline
\end{tabular}
%Source: https://freestatistics.org/blog/index.php?pk=57628&T=5

[TABLE]
[ROW][C]Goldfeld-Quandt test for Heteroskedasticity[/C][/ROW]
[ROW][C]p-values[/C][C]Alternative Hypothesis[/C][/ROW]
[ROW][C]breakpoint index[/C][C]greater[/C][C]2-sided[/C][C]less[/C][/ROW]
[ROW][C]5[/C][C]0.00212800725174869[/C][C]0.00425601450349738[/C][C]0.997871992748251[/C][/ROW]
[ROW][C]6[/C][C]0.000234934875661048[/C][C]0.000469869751322096[/C][C]0.99976506512434[/C][/ROW]
[ROW][C]7[/C][C]7.53622846936056e-05[/C][C]0.000150724569387211[/C][C]0.999924637715306[/C][/ROW]
[ROW][C]8[/C][C]3.30718468346579e-05[/C][C]6.61436936693158e-05[/C][C]0.999966928153165[/C][/ROW]
[ROW][C]9[/C][C]1.00420533444249e-05[/C][C]2.00841066888499e-05[/C][C]0.999989957946656[/C][/ROW]
[ROW][C]10[/C][C]8.78507831664667e-06[/C][C]1.75701566332933e-05[/C][C]0.999991214921683[/C][/ROW]
[ROW][C]11[/C][C]2.4998205185364e-06[/C][C]4.9996410370728e-06[/C][C]0.999997500179481[/C][/ROW]
[ROW][C]12[/C][C]4.88437919065135e-07[/C][C]9.7687583813027e-07[/C][C]0.99999951156208[/C][/ROW]
[ROW][C]13[/C][C]2.24871699145993e-07[/C][C]4.49743398291985e-07[/C][C]0.9999997751283[/C][/ROW]
[ROW][C]14[/C][C]1.19411927743264e-07[/C][C]2.38823855486528e-07[/C][C]0.999999880588072[/C][/ROW]
[ROW][C]15[/C][C]3.78416339237948e-07[/C][C]7.56832678475897e-07[/C][C]0.99999962158366[/C][/ROW]
[ROW][C]16[/C][C]5.10026675462674e-07[/C][C]1.02005335092535e-06[/C][C]0.999999489973325[/C][/ROW]
[ROW][C]17[/C][C]2.95783097882315e-07[/C][C]5.91566195764629e-07[/C][C]0.999999704216902[/C][/ROW]
[ROW][C]18[/C][C]3.13564951340734e-07[/C][C]6.27129902681469e-07[/C][C]0.999999686435049[/C][/ROW]
[ROW][C]19[/C][C]6.13608081510266e-07[/C][C]1.22721616302053e-06[/C][C]0.999999386391919[/C][/ROW]
[ROW][C]20[/C][C]1.44168793024032e-06[/C][C]2.88337586048063e-06[/C][C]0.99999855831207[/C][/ROW]
[ROW][C]21[/C][C]2.83699316188593e-06[/C][C]5.67398632377186e-06[/C][C]0.999997163006838[/C][/ROW]
[ROW][C]22[/C][C]2.41301801228236e-06[/C][C]4.82603602456473e-06[/C][C]0.999997586981988[/C][/ROW]
[ROW][C]23[/C][C]1.56735830655739e-06[/C][C]3.13471661311478e-06[/C][C]0.999998432641694[/C][/ROW]
[ROW][C]24[/C][C]1.16827633649235e-06[/C][C]2.3365526729847e-06[/C][C]0.999998831723663[/C][/ROW]
[ROW][C]25[/C][C]1.69471734117948e-06[/C][C]3.38943468235897e-06[/C][C]0.99999830528266[/C][/ROW]
[ROW][C]26[/C][C]1.80211665090772e-06[/C][C]3.60423330181543e-06[/C][C]0.999998197883349[/C][/ROW]
[ROW][C]27[/C][C]1.93806027991559e-06[/C][C]3.87612055983117e-06[/C][C]0.99999806193972[/C][/ROW]
[ROW][C]28[/C][C]4.72880417183402e-06[/C][C]9.45760834366805e-06[/C][C]0.999995271195828[/C][/ROW]
[ROW][C]29[/C][C]9.08364268273567e-06[/C][C]1.81672853654713e-05[/C][C]0.999990916357317[/C][/ROW]
[ROW][C]30[/C][C]1.06253133114512e-05[/C][C]2.12506266229024e-05[/C][C]0.999989374686689[/C][/ROW]
[ROW][C]31[/C][C]3.14747614098436e-05[/C][C]6.29495228196872e-05[/C][C]0.99996852523859[/C][/ROW]
[ROW][C]32[/C][C]4.3587120163884e-05[/C][C]8.7174240327768e-05[/C][C]0.999956412879836[/C][/ROW]
[ROW][C]33[/C][C]3.57768025684938e-05[/C][C]7.15536051369876e-05[/C][C]0.999964223197432[/C][/ROW]
[ROW][C]34[/C][C]3.02935343730347e-05[/C][C]6.05870687460693e-05[/C][C]0.999969706465627[/C][/ROW]
[ROW][C]35[/C][C]2.58578111268122e-05[/C][C]5.17156222536244e-05[/C][C]0.999974142188873[/C][/ROW]
[ROW][C]36[/C][C]2.06492701798448e-05[/C][C]4.12985403596896e-05[/C][C]0.99997935072982[/C][/ROW]
[ROW][C]37[/C][C]1.69209243580322e-05[/C][C]3.38418487160643e-05[/C][C]0.999983079075642[/C][/ROW]
[ROW][C]38[/C][C]1.44039037736971e-05[/C][C]2.88078075473942e-05[/C][C]0.999985596096226[/C][/ROW]
[ROW][C]39[/C][C]1.82672041632283e-05[/C][C]3.65344083264566e-05[/C][C]0.999981732795837[/C][/ROW]
[ROW][C]40[/C][C]2.01188035488831e-05[/C][C]4.02376070977662e-05[/C][C]0.99997988119645[/C][/ROW]
[ROW][C]41[/C][C]2.31250282355324e-05[/C][C]4.62500564710647e-05[/C][C]0.999976874971764[/C][/ROW]
[ROW][C]42[/C][C]3.5610827115818e-05[/C][C]7.1221654231636e-05[/C][C]0.999964389172884[/C][/ROW]
[ROW][C]43[/C][C]5.66657065439823e-05[/C][C]0.000113331413087965[/C][C]0.999943334293456[/C][/ROW]
[ROW][C]44[/C][C]6.09873683608313e-05[/C][C]0.000121974736721663[/C][C]0.99993901263164[/C][/ROW]
[ROW][C]45[/C][C]8.64310036451164e-05[/C][C]0.000172862007290233[/C][C]0.999913568996355[/C][/ROW]
[ROW][C]46[/C][C]0.000196632291070630[/C][C]0.000393264582141261[/C][C]0.99980336770893[/C][/ROW]
[ROW][C]47[/C][C]0.000374497538657624[/C][C]0.000748995077315248[/C][C]0.999625502461342[/C][/ROW]
[ROW][C]48[/C][C]0.000627369800283813[/C][C]0.00125473960056763[/C][C]0.999372630199716[/C][/ROW]
[ROW][C]49[/C][C]0.000837635472757288[/C][C]0.00167527094551458[/C][C]0.999162364527243[/C][/ROW]
[ROW][C]50[/C][C]0.00112825422889140[/C][C]0.00225650845778280[/C][C]0.998871745771109[/C][/ROW]
[ROW][C]51[/C][C]0.00182726707044893[/C][C]0.00365453414089786[/C][C]0.99817273292955[/C][/ROW]
[ROW][C]52[/C][C]0.00212820566839659[/C][C]0.00425641133679318[/C][C]0.997871794331603[/C][/ROW]
[ROW][C]53[/C][C]0.0062855595671137[/C][C]0.0125711191342274[/C][C]0.993714440432886[/C][/ROW]
[ROW][C]54[/C][C]0.0157670066025537[/C][C]0.0315340132051074[/C][C]0.984232993397446[/C][/ROW]
[ROW][C]55[/C][C]0.257822567970304[/C][C]0.515645135940608[/C][C]0.742177432029696[/C][/ROW]
[ROW][C]56[/C][C]0.890971406431063[/C][C]0.218057187137873[/C][C]0.109028593568937[/C][/ROW]
[/TABLE]
Source: https://freestatistics.org/blog/index.php?pk=57628&T=5

Globally Unique Identifier (entire table): ba.freestatistics.org/blog/index.php?pk=57628&T=5

As an alternative you can also use a QR Code:  

The GUIDs for individual cells are displayed in the table below:

Goldfeld-Quandt test for Heteroskedasticity
p-valuesAlternative Hypothesis
breakpoint indexgreater2-sidedless
50.002128007251748690.004256014503497380.997871992748251
60.0002349348756610480.0004698697513220960.99976506512434
77.53622846936056e-050.0001507245693872110.999924637715306
83.30718468346579e-056.61436936693158e-050.999966928153165
91.00420533444249e-052.00841066888499e-050.999989957946656
108.78507831664667e-061.75701566332933e-050.999991214921683
112.4998205185364e-064.9996410370728e-060.999997500179481
124.88437919065135e-079.7687583813027e-070.99999951156208
132.24871699145993e-074.49743398291985e-070.9999997751283
141.19411927743264e-072.38823855486528e-070.999999880588072
153.78416339237948e-077.56832678475897e-070.99999962158366
165.10026675462674e-071.02005335092535e-060.999999489973325
172.95783097882315e-075.91566195764629e-070.999999704216902
183.13564951340734e-076.27129902681469e-070.999999686435049
196.13608081510266e-071.22721616302053e-060.999999386391919
201.44168793024032e-062.88337586048063e-060.99999855831207
212.83699316188593e-065.67398632377186e-060.999997163006838
222.41301801228236e-064.82603602456473e-060.999997586981988
231.56735830655739e-063.13471661311478e-060.999998432641694
241.16827633649235e-062.3365526729847e-060.999998831723663
251.69471734117948e-063.38943468235897e-060.99999830528266
261.80211665090772e-063.60423330181543e-060.999998197883349
271.93806027991559e-063.87612055983117e-060.99999806193972
284.72880417183402e-069.45760834366805e-060.999995271195828
299.08364268273567e-061.81672853654713e-050.999990916357317
301.06253133114512e-052.12506266229024e-050.999989374686689
313.14747614098436e-056.29495228196872e-050.99996852523859
324.3587120163884e-058.7174240327768e-050.999956412879836
333.57768025684938e-057.15536051369876e-050.999964223197432
343.02935343730347e-056.05870687460693e-050.999969706465627
352.58578111268122e-055.17156222536244e-050.999974142188873
362.06492701798448e-054.12985403596896e-050.99997935072982
371.69209243580322e-053.38418487160643e-050.999983079075642
381.44039037736971e-052.88078075473942e-050.999985596096226
391.82672041632283e-053.65344083264566e-050.999981732795837
402.01188035488831e-054.02376070977662e-050.99997988119645
412.31250282355324e-054.62500564710647e-050.999976874971764
423.5610827115818e-057.1221654231636e-050.999964389172884
435.66657065439823e-050.0001133314130879650.999943334293456
446.09873683608313e-050.0001219747367216630.99993901263164
458.64310036451164e-050.0001728620072902330.999913568996355
460.0001966322910706300.0003932645821412610.99980336770893
470.0003744975386576240.0007489950773152480.999625502461342
480.0006273698002838130.001254739600567630.999372630199716
490.0008376354727572880.001675270945514580.999162364527243
500.001128254228891400.002256508457782800.998871745771109
510.001827267070448930.003654534140897860.99817273292955
520.002128205668396590.004256411336793180.997871794331603
530.00628555956711370.01257111913422740.993714440432886
540.01576700660255370.03153401320510740.984232993397446
550.2578225679703040.5156451359406080.742177432029696
560.8909714064310630.2180571871378730.109028593568937


Meta Analysis of Goldfeld-Quandt test for Heteroskedasticity
Description# significant tests% significant testsOK/NOK
1% type I error level480.923076923076923NOK
5% type I error level500.961538461538462NOK
10% type I error level500.961538461538462NOK

\begin{tabular}{lllllllll}
\hline
Meta Analysis of Goldfeld-Quandt test for Heteroskedasticity \tabularnewline
Description & # significant tests & % significant tests & OK/NOK \tabularnewline
1% type I error level & 48 & 0.923076923076923 & NOK \tabularnewline
5% type I error level & 50 & 0.961538461538462 & NOK \tabularnewline
10% type I error level & 50 & 0.961538461538462 & NOK \tabularnewline
\hline
\end{tabular}
%Source: https://freestatistics.org/blog/index.php?pk=57628&T=6

[TABLE]
[ROW][C]Meta Analysis of Goldfeld-Quandt test for Heteroskedasticity[/C][/ROW]
[ROW][C]Description[/C][C]# significant tests[/C][C]% significant tests[/C][C]OK/NOK[/C][/ROW]
[ROW][C]1% type I error level[/C][C]48[/C][C]0.923076923076923[/C][C]NOK[/C][/ROW]
[ROW][C]5% type I error level[/C][C]50[/C][C]0.961538461538462[/C][C]NOK[/C][/ROW]
[ROW][C]10% type I error level[/C][C]50[/C][C]0.961538461538462[/C][C]NOK[/C][/ROW]
[/TABLE]
Source: https://freestatistics.org/blog/index.php?pk=57628&T=6

Globally Unique Identifier (entire table): ba.freestatistics.org/blog/index.php?pk=57628&T=6

As an alternative you can also use a QR Code:  

The GUIDs for individual cells are displayed in the table below:

Meta Analysis of Goldfeld-Quandt test for Heteroskedasticity
Description# significant tests% significant testsOK/NOK
1% type I error level480.923076923076923NOK
5% type I error level500.961538461538462NOK
10% type I error level500.961538461538462NOK


Parameters (Session):
Parameters (R input):
par1 = 1 ; par2 = Do not include Seasonal Dummies ; par3 = No Linear Trend ;
R code (references can be found in the software module):
library(lattice)
library(lmtest)
n25 <- 25 #minimum number of obs. for Goldfeld-Quandt test
par1 <- as.numeric(par1)
x <- t(y)
k <- length(x[1,])
n <- length(x[,1])
x1 <- cbind(x[,par1], x[,1:k!=par1])
mycolnames <- c(colnames(x)[par1], colnames(x)[1:k!=par1])
colnames(x1) <- mycolnames #colnames(x)[par1]
x <- x1
if (par3 == 'First Differences'){
x2 <- array(0, dim=c(n-1,k), dimnames=list(1:(n-1), paste('(1-B)',colnames(x),sep='')))
for (i in 1:n-1) {
for (j in 1:k) {
x2[i,j] <- x[i+1,j] - x[i,j]
}
}
x <- x2
}
if (par2 == 'Include Monthly Dummies'){
x2 <- array(0, dim=c(n,11), dimnames=list(1:n, paste('M', seq(1:11), sep ='')))
for (i in 1:11){
x2[seq(i,n,12),i] <- 1
}
x <- cbind(x, x2)
}
if (par2 == 'Include Quarterly Dummies'){
x2 <- array(0, dim=c(n,3), dimnames=list(1:n, paste('Q', seq(1:3), sep ='')))
for (i in 1:3){
x2[seq(i,n,4),i] <- 1
}
x <- cbind(x, x2)
}
k <- length(x[1,])
if (par3 == 'Linear Trend'){
x <- cbind(x, c(1:n))
colnames(x)[k+1] <- 't'
}
x
k <- length(x[1,])
df <- as.data.frame(x)
(mylm <- lm(df))
(mysum <- summary(mylm))
if (n > n25) {
kp3 <- k + 3
nmkm3 <- n - k - 3
gqarr <- array(NA, dim=c(nmkm3-kp3+1,3))
numgqtests <- 0
numsignificant1 <- 0
numsignificant5 <- 0
numsignificant10 <- 0
for (mypoint in kp3:nmkm3) {
j <- 0
numgqtests <- numgqtests + 1
for (myalt in c('greater', 'two.sided', 'less')) {
j <- j + 1
gqarr[mypoint-kp3+1,j] <- gqtest(mylm, point=mypoint, alternative=myalt)$p.value
}
if (gqarr[mypoint-kp3+1,2] < 0.01) numsignificant1 <- numsignificant1 + 1
if (gqarr[mypoint-kp3+1,2] < 0.05) numsignificant5 <- numsignificant5 + 1
if (gqarr[mypoint-kp3+1,2] < 0.10) numsignificant10 <- numsignificant10 + 1
}
gqarr
}
bitmap(file='test0.png')
plot(x[,1], type='l', main='Actuals and Interpolation', ylab='value of Actuals and Interpolation (dots)', xlab='time or index')
points(x[,1]-mysum$resid)
grid()
dev.off()
bitmap(file='test1.png')
plot(mysum$resid, type='b', pch=19, main='Residuals', ylab='value of Residuals', xlab='time or index')
grid()
dev.off()
bitmap(file='test2.png')
hist(mysum$resid, main='Residual Histogram', xlab='values of Residuals')
grid()
dev.off()
bitmap(file='test3.png')
densityplot(~mysum$resid,col='black',main='Residual Density Plot', xlab='values of Residuals')
dev.off()
bitmap(file='test4.png')
qqnorm(mysum$resid, main='Residual Normal Q-Q Plot')
qqline(mysum$resid)
grid()
dev.off()
(myerror <- as.ts(mysum$resid))
bitmap(file='test5.png')
dum <- cbind(lag(myerror,k=1),myerror)
dum
dum1 <- dum[2:length(myerror),]
dum1
z <- as.data.frame(dum1)
z
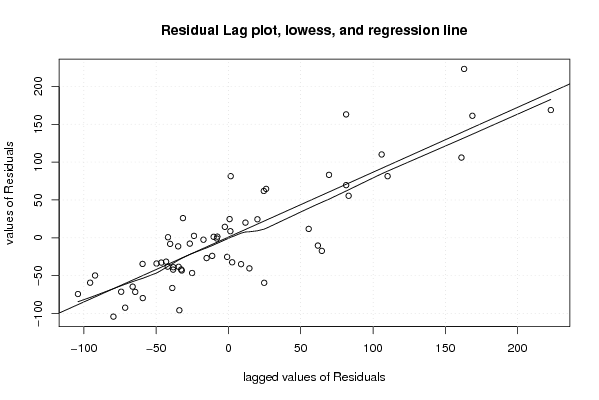
plot(z,main=paste('Residual Lag plot, lowess, and regression line'), ylab='values of Residuals', xlab='lagged values of Residuals')
lines(lowess(z))
abline(lm(z))
grid()
dev.off()
bitmap(file='test6.png')
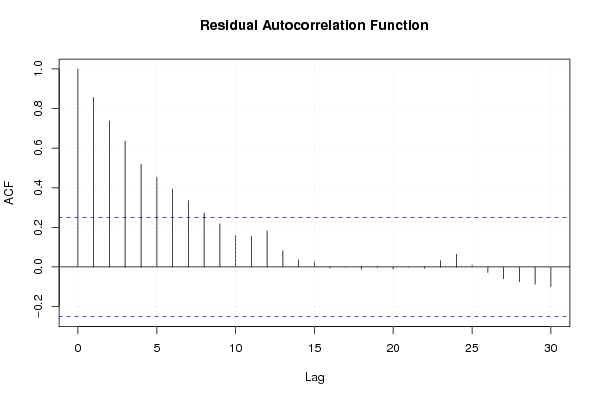
acf(mysum$resid, lag.max=length(mysum$resid)/2, main='Residual Autocorrelation Function')
grid()
dev.off()
bitmap(file='test7.png')
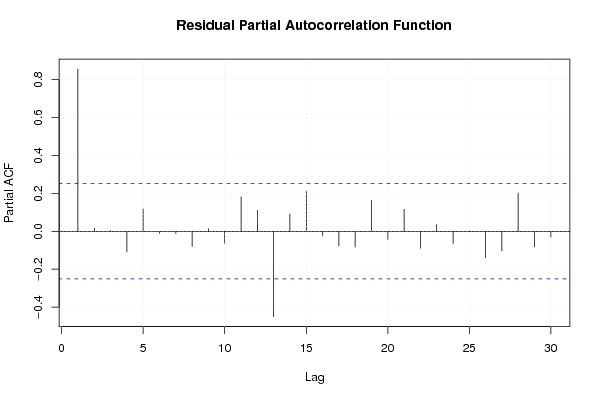
pacf(mysum$resid, lag.max=length(mysum$resid)/2, main='Residual Partial Autocorrelation Function')
grid()
dev.off()
bitmap(file='test8.png')
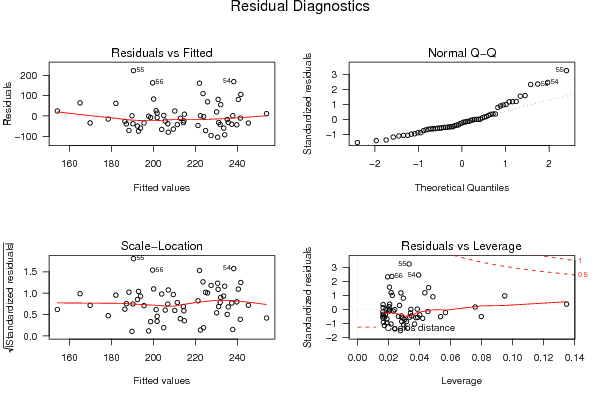
opar <- par(mfrow = c(2,2), oma = c(0, 0, 1.1, 0))
plot(mylm, las = 1, sub='Residual Diagnostics')
par(opar)
dev.off()
if (n > n25) {
bitmap(file='test9.png')
plot(kp3:nmkm3,gqarr[,2], main='Goldfeld-Quandt test',ylab='2-sided p-value',xlab='breakpoint')
grid()
dev.off()
}
load(file='createtable')
a<-table.start()
a<-table.row.start(a)
a<-table.element(a, 'Multiple Linear Regression - Estimated Regression Equation', 1, TRUE)
a<-table.row.end(a)
myeq <- colnames(x)[1]
myeq <- paste(myeq, '[t] = ', sep='')
for (i in 1:k){
if (mysum$coefficients[i,1] > 0) myeq <- paste(myeq, '+', '')
myeq <- paste(myeq, mysum$coefficients[i,1], sep=' ')
if (rownames(mysum$coefficients)[i] != '(Intercept)') {
myeq <- paste(myeq, rownames(mysum$coefficients)[i], sep='')
if (rownames(mysum$coefficients)[i] != 't') myeq <- paste(myeq, '[t]', sep='')
}
}
myeq <- paste(myeq, ' + e[t]')
a<-table.row.start(a)
a<-table.element(a, myeq)
a<-table.row.end(a)
a<-table.end(a)
table.save(a,file='mytable1.tab')
a<-table.start()
a<-table.row.start(a)
a<-table.element(a,hyperlink('ols1.htm','Multiple Linear Regression - Ordinary Least Squares',''), 6, TRUE)
a<-table.row.end(a)
a<-table.row.start(a)
a<-table.element(a,'Variable',header=TRUE)
a<-table.element(a,'Parameter',header=TRUE)
a<-table.element(a,'S.D.',header=TRUE)
a<-table.element(a,'T-STAT
H0: parameter = 0',header=TRUE)
a<-table.element(a,'2-tail p-value',header=TRUE)
a<-table.element(a,'1-tail p-value',header=TRUE)
a<-table.row.end(a)
for (i in 1:k){
a<-table.row.start(a)
a<-table.element(a,rownames(mysum$coefficients)[i],header=TRUE)
a<-table.element(a,mysum$coefficients[i,1])
a<-table.element(a, round(mysum$coefficients[i,2],6))
a<-table.element(a, round(mysum$coefficients[i,3],4))
a<-table.element(a, round(mysum$coefficients[i,4],6))
a<-table.element(a, round(mysum$coefficients[i,4]/2,6))
a<-table.row.end(a)
}
a<-table.end(a)
table.save(a,file='mytable2.tab')
a<-table.start()
a<-table.row.start(a)
a<-table.element(a, 'Multiple Linear Regression - Regression Statistics', 2, TRUE)
a<-table.row.end(a)
a<-table.row.start(a)
a<-table.element(a, 'Multiple R',1,TRUE)
a<-table.element(a, sqrt(mysum$r.squared))
a<-table.row.end(a)
a<-table.row.start(a)
a<-table.element(a, 'R-squared',1,TRUE)
a<-table.element(a, mysum$r.squared)
a<-table.row.end(a)
a<-table.row.start(a)
a<-table.element(a, 'Adjusted R-squared',1,TRUE)
a<-table.element(a, mysum$adj.r.squared)
a<-table.row.end(a)
a<-table.row.start(a)
a<-table.element(a, 'F-TEST (value)',1,TRUE)
a<-table.element(a, mysum$fstatistic[1])
a<-table.row.end(a)
a<-table.row.start(a)
a<-table.element(a, 'F-TEST (DF numerator)',1,TRUE)
a<-table.element(a, mysum$fstatistic[2])
a<-table.row.end(a)
a<-table.row.start(a)
a<-table.element(a, 'F-TEST (DF denominator)',1,TRUE)
a<-table.element(a, mysum$fstatistic[3])
a<-table.row.end(a)
a<-table.row.start(a)
a<-table.element(a, 'p-value',1,TRUE)
a<-table.element(a, 1-pf(mysum$fstatistic[1],mysum$fstatistic[2],mysum$fstatistic[3]))
a<-table.row.end(a)
a<-table.row.start(a)
a<-table.element(a, 'Multiple Linear Regression - Residual Statistics', 2, TRUE)
a<-table.row.end(a)
a<-table.row.start(a)
a<-table.element(a, 'Residual Standard Deviation',1,TRUE)
a<-table.element(a, mysum$sigma)
a<-table.row.end(a)
a<-table.row.start(a)
a<-table.element(a, 'Sum Squared Residuals',1,TRUE)
a<-table.element(a, sum(myerror*myerror))
a<-table.row.end(a)
a<-table.end(a)
table.save(a,file='mytable3.tab')
a<-table.start()
a<-table.row.start(a)
a<-table.element(a, 'Multiple Linear Regression - Actuals, Interpolation, and Residuals', 4, TRUE)
a<-table.row.end(a)
a<-table.row.start(a)
a<-table.element(a, 'Time or Index', 1, TRUE)
a<-table.element(a, 'Actuals', 1, TRUE)
a<-table.element(a, 'Interpolation
Forecast', 1, TRUE)
a<-table.element(a, 'Residuals
Prediction Error', 1, TRUE)
a<-table.row.end(a)
for (i in 1:n) {
a<-table.row.start(a)
a<-table.element(a,i, 1, TRUE)
a<-table.element(a,x[i])
a<-table.element(a,x[i]-mysum$resid[i])
a<-table.element(a,mysum$resid[i])
a<-table.row.end(a)
}
a<-table.end(a)
table.save(a,file='mytable4.tab')
if (n > n25) {
a<-table.start()
a<-table.row.start(a)
a<-table.element(a,'Goldfeld-Quandt test for Heteroskedasticity',4,TRUE)
a<-table.row.end(a)
a<-table.row.start(a)
a<-table.element(a,'p-values',header=TRUE)
a<-table.element(a,'Alternative Hypothesis',3,header=TRUE)
a<-table.row.end(a)
a<-table.row.start(a)
a<-table.element(a,'breakpoint index',header=TRUE)
a<-table.element(a,'greater',header=TRUE)
a<-table.element(a,'2-sided',header=TRUE)
a<-table.element(a,'less',header=TRUE)
a<-table.row.end(a)
for (mypoint in kp3:nmkm3) {
a<-table.row.start(a)
a<-table.element(a,mypoint,header=TRUE)
a<-table.element(a,gqarr[mypoint-kp3+1,1])
a<-table.element(a,gqarr[mypoint-kp3+1,2])
a<-table.element(a,gqarr[mypoint-kp3+1,3])
a<-table.row.end(a)
}
a<-table.end(a)
table.save(a,file='mytable5.tab')
a<-table.start()
a<-table.row.start(a)
a<-table.element(a,'Meta Analysis of Goldfeld-Quandt test for Heteroskedasticity',4,TRUE)
a<-table.row.end(a)
a<-table.row.start(a)
a<-table.element(a,'Description',header=TRUE)
a<-table.element(a,'# significant tests',header=TRUE)
a<-table.element(a,'% significant tests',header=TRUE)
a<-table.element(a,'OK/NOK',header=TRUE)
a<-table.row.end(a)
a<-table.row.start(a)
a<-table.element(a,'1% type I error level',header=TRUE)
a<-table.element(a,numsignificant1)
a<-table.element(a,numsignificant1/numgqtests)
if (numsignificant1/numgqtests < 0.01) dum <- 'OK' else dum <- 'NOK'
a<-table.element(a,dum)
a<-table.row.end(a)
a<-table.row.start(a)
a<-table.element(a,'5% type I error level',header=TRUE)
a<-table.element(a,numsignificant5)
a<-table.element(a,numsignificant5/numgqtests)
if (numsignificant5/numgqtests < 0.05) dum <- 'OK' else dum <- 'NOK'
a<-table.element(a,dum)
a<-table.row.end(a)
a<-table.row.start(a)
a<-table.element(a,'10% type I error level',header=TRUE)
a<-table.element(a,numsignificant10)
a<-table.element(a,numsignificant10/numgqtests)
if (numsignificant10/numgqtests < 0.1) dum <- 'OK' else dum <- 'NOK'
a<-table.element(a,dum)
a<-table.row.end(a)
a<-table.end(a)
table.save(a,file='mytable6.tab')
}